Seroprevalence of Antibodies to SARS-CoV-2 in 10 Sites in the United States, March 23-May 12, 2020
- PMID: 32692365
- PMCID: PMC12507447
- DOI: 10.1001/jamainternmed.2020.4130
Seroprevalence of Antibodies to SARS-CoV-2 in 10 Sites in the United States, March 23-May 12, 2020
Abstract
Importance: Reported cases of severe acute respiratory syndrome coronavirus 2 (SARS-CoV-2) infection likely underestimate the prevalence of infection in affected communities. Large-scale seroprevalence studies provide better estimates of the proportion of the population previously infected.
Objective: To estimate prevalence of SARS-CoV-2 antibodies in convenience samples from several geographic sites in the US.
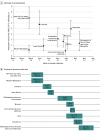
Design, setting, and participants: This cross-sectional study performed serologic testing on a convenience sample of residual sera obtained from persons of all ages. The serum was collected from March 23 through May 12, 2020, for routine clinical testing by 2 commercial laboratory companies. Sites of collection were San Francisco Bay area, California; Connecticut; south Florida; Louisiana; Minneapolis-St Paul-St Cloud metro area, Minnesota; Missouri; New York City metro area, New York; Philadelphia metro area, Pennsylvania; Utah; and western Washington State.
Exposures: Infection with SARS-CoV-2.
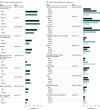
Main outcomes and measures: The presence of antibodies to SARS-CoV-2 spike protein was estimated using an enzyme-linked immunosorbent assay, and estimates were standardized to the site populations by age and sex. Estimates were adjusted for test performance characteristics (96.0% sensitivity and 99.3% specificity). The number of infections in each site was estimated by extrapolating seroprevalence to site populations; estimated infections were compared with the number of reported coronavirus disease 2019 (COVID-19) cases as of last specimen collection date.
Results: Serum samples were tested from 16 025 persons, 8853 (55.2%) of whom were women; 1205 (7.5%) were 18 years or younger and 5845 (36.2%) were 65 years or older. Most specimens from each site had no evidence of antibodies to SARS-CoV-2. Adjusted estimates of the proportion of persons seroreactive to the SARS-CoV-2 spike protein antibodies ranged from 1.0% in the San Francisco Bay area (collected April 23-27) to 6.9% of persons in New York City (collected March 23-April 1). The estimated number of infections ranged from 6 to 24 times the number of reported cases; for 7 sites (Connecticut, Florida, Louisiana, Missouri, New York City metro area, Utah, and western Washington State), an estimated greater than 10 times more SARS-CoV-2 infections occurred than the number of reported cases.
Conclusions and relevance: During March to early May 2020, most persons in 10 diverse geographic sites in the US had not been infected with SARS-CoV-2 virus. The estimated number of infections, however, was much greater than the number of reported cases in all sites. The findings may reflect the number of persons who had mild or no illness or who did not seek medical care or undergo testing but who still may have contributed to ongoing virus transmission in the population.
Conflict of interest statement
Figures


Comment in
-
Serosurveillance and the COVID-19 Epidemic in the US: Undetected, Uncertain, and Out of Control.JAMA. 2020 Aug 25;324(8):749-751. doi: 10.1001/jama.2020.14017. JAMA. 2020. PMID: 32692350 No abstract available.
References
-
- CDC confirms possible first instance of COVID-19 community transmission in California 2020. News release. California Department of Public Health; February 26, 2020. Accessed July 10, 2020. https://www.cdph.ca.gov/Programs/OPA/Pages/NR20-006.aspx
-
- Additional cases of COVID-19 in Washington State. News release. Washington State Department of Health; February 28, 2020. Accessed July 10, 2020. https://www.doh.wa.gov/Newsroom/Articles/ID/1103/Additional-Cases-of-COV...
-
- During coronavirus briefing, Governor Cuomo signs $40 million emergency management authorization for coronavirus response. News release; March 3, 2020. Accessed July 10, 2020. https://www.governor.ny.gov/news/during-coronavirus-briefing-governor-cu...
LinkOut - more resources
Full Text Sources
Miscellaneous

