. 2020 Jul;10(7):200052.
doi: 10.1098/rsob.200052. Epub 2020 Jul 22.

Bioinformatical dissection of fission yeast DNA replication origins

Affiliations

Bioinformatical dissection of fission yeast DNA replication origins

Koji Masuda et al. Open Biol. 2020 Jul.

Abstract

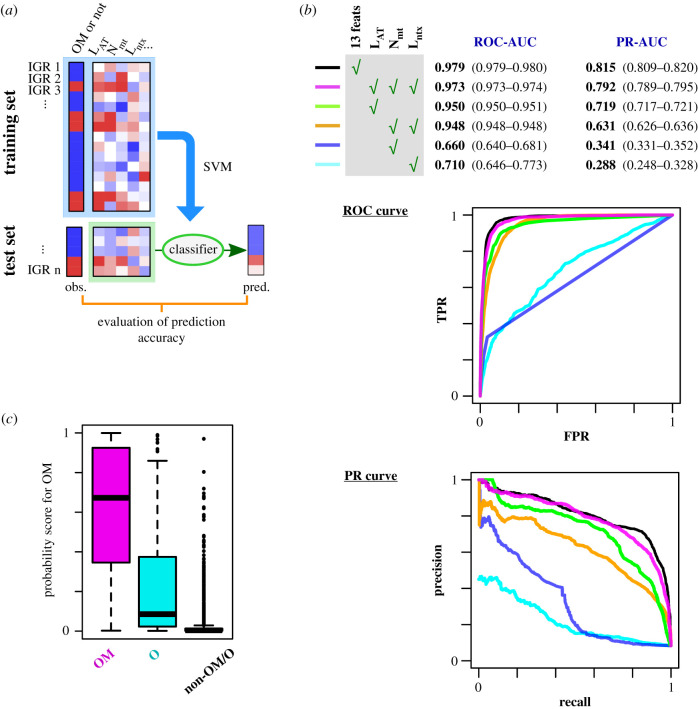
Replication origins in eukaryotes form a base for assembly of the pre-replication complex (pre-RC), thereby serving as an initiation site of DNA replication. Characteristics of replication origin vary among species. In fission yeast Schizosaccharomyces pombe, DNA of high AT content is a distinct feature of replication origins; however, it remains to be understood what the general molecular architecture of fission yeast origin is. Here, we performed ChIP-seq mapping of Orc4 and Mcm2, two representative components of the pre-RC, and described the characteristics of their binding sites. The analysis revealed that fission yeast efficient origins are associated with two similar but independent features: a ≥15 bp-long motif with stretches of As and an AT-rich region of a few hundred bp. The A-rich motif was correlated with chromosomal binding of Orc, a DNA-binding component in the pre-RC, whereas the AT-rich region was associated with efficient binding of the DNA replicative helicase Mcm. These two features, in combination with the third feature, a transcription-poor region of approximately 1 kb, enabled to distinguish efficient replication origins from the rest of chromosome arms with high accuracy. This study, hence, provides a model that describes how multiple functional elements specify DNA replication origins in fission yeast genome.

Keywords: ChIP-seq; fission yeast; machine learning; pre-replication complex; replication origins.


Conflict of interest statement

We declare we have no competing interests.

Figures

Figure 1.
Figure 1.
Identification of pre-RC- and Orc-only-binding sites in the fission yeast genome. (a) ChIP-seq profiles of PK-tagged Orc4 (Orc4-PK) and Mcm2 (Mcm2-PK) in cdc10-arrested cells. The y-axes show FE. Three representative genome regions, including well-studied replication origins (ori1–200, ars2004 and AT2080), are shown. Red arrowheads indicate sites where both Orc4 and Mcm2 were co-localized (OM sites), and magenta circles sites where only Orc4 was localized (O sites). The third row indicates Mcm4-FLAG ChIP-seq profile in hsk1 mutant [36]. The bottom row (Genes) shows position, size and direction of transcriptional units. (b) Venn diagram indicating overlap between Orc4-PK- and Mcm2-PK-binding sites detected on chromosome arms. (c) Dot plot representation of Orc4-PK and Mcm2-PK FEs at each OM (red) or O (purple) site. Black dotted lines indicate a FE of 1, i.e. no enrichment in ChIP isolated DNA. Distributions of Orc4-PK and Mcm2-PK FEs are shown on the upper and right sides of the dot plot, respectively. (d) Validation of Orc4-PK- and Mcm2-PK-binding sites by quantitative PCR measurement of DNA co-immunoprecipitated with Orc4-PK (blue) and Mcm2-PK (green). ‘no tag’ (orange) indicates a control experiment in which cells without any epitope tag were subjected to anti-PK chromatin immunoprecipitation. DNA corresponding to OM sites, O sites or sites without Orc4 or Mcm2 binding (non-OM/O sites) was quantified. The qPCR locus name represents chromosome number (Roman numerals) and coordinate (Arabic numerals following underscore in kb). FEs of ChIP-purified DNA at the indicated loci are shown relative to the average value at the non-OM/O sites. (e) The number of sites with ≥50% (dark green), 10–50% (light green) and less than 10% (grey) relative origin efficiency (Ori Eff) [51] in each indicated class of genomic sites. + and – indicate the presence and absence of Mcm4 peak in hsk1 cells, respectively. A number in parentheses indicates the total number of the sites belonging to the indicated class.
Figure 2.
Figure 2.
Poly(dA) motif is associated with Orc4-binding sites. (a) Sequence logos of DNA motifs that appeared frequently around Orc4-binding sites. Results obtained by two motif finders, MEME (top) and DME2 (bottom), are shown. (b) Position of the motifs around each OM (left) or O (right) site, relative to the Orc4 ChIP-seq peak summit. OM and O sites were sorted by distance to the nearest motif and oriented so that the nearest one was on the right side. Magenta, motif discovered by MEME; cyan, motif by DME2. Blue indicates a sequence that fits both motif signatures. Distribution profiles of the motifs were shown on the top. (c) Number of poly(dA) motifs (union of the motifs by MEME and DME2) around each OM and O site (±250 bp). Proportion of the sites possessing no, one, two and three or more sites is shown in white, light grey, dark grey and black, respectively. Genome, genome-wide average. (d,e) Correlation between Orc4 ChIP-seq FE at the OM (d) or O (e) sites and the number of motifs located around (±250 bp) the sites. The distribution of FE values for sites with the indicated motif number is shown as box plot.
Figure 3.
Figure 3.
Mcm-binding sites are associated with an AT-rich DNA segment. (a) Averaged AT content (in %, 100 bp sliding window) profiles around OM and O sites. Ave., genome-wide average. (b) Heatmap representations of Orc4 and Mcm2 ChIP-seq profiles, as well as AT content (AT%) and ΔGmelt (the calculated energy required for local DNA melting) at each OM site, relative to the summit of Orc4 peak. The OM sites were sorted based on the distance between Orc4 and Mcm2 ChIP-seq peak summits. ChIP-seq profiles were scaled so that the local maximum became equal to 1. (c) Plot of AT-content values in the regions adjacent to Orc4 peak summit (left, −500 to −100 bp; right, +100 to +500 bp; indicated as red rectangle boxes in (b)) at each OM or O site. Orange, OM sites where the Mcm2 peak was shifted rightward relative to the Orc4 peak; black, OM sites where Orc4 and Mcm2 peaks overlapped; green, OM sites where the Mcm2 peak was shifted leftward (as indicated by a coloured vertical line in (b)). Grey, O sites.
Figure 4.
Figure 4.
OM sites are preferentially located in long intergenic regions. (a) Proportion of sites located within intergenic regions (IGRs). Magenta circle, OM sites; purple triangle, O sites; green square, poly(dA) motif sites not associated with OM or O sites. Black line and error bars indicate mean and CI95% for randomly sampled genomic sites, respectively. (b) G1-phase expression levels of genes containing OM sites, O sites, or neither OM nor O sites. The numbers of the corresponding genes are 28, 173 and 5,144, respectively. *, p < 10−3; **, p < 10−6 (Mann–Whitney U-test). (c) Lengths of IGRs containing OM sites, O sites, or neither OM nor O sites. The numbers of the corresponding IGRs are 268, 175 and 3,284, respectively. **, p < 10−6; ***, p < 10−15 (Mann–Whitney U-test). (d) Scatter plot representation of length and AT content of each IGR. IGRs containing OM sites are indicated in red. OM site-negative IGRs containing no, one and two or more poly(dA) motifs are shown in black, green and blue, respectively.
Figure 5.
Figure 5.
Correlation between OM site presence and gene orientation. (a) Classification of IGRs into convergent, tandem and divergent types, based on orientation of the flanking genes. (b) Proportion of each gene orientation type for IGRs with OM sites, with O sites and without either OM or O sites. Red, convergent; green, tandem; blue, divergent. Results of Monte Carlo simulation are also shown. In ‘random’, IGRs were randomly picked from the genome, whereas in ‘length controlled’, IGRs were picked so that they had the same length distribution as that observed for IGRs with OM sites. Error bars, CI95%. (c) Another IGR classification, based on orientation of the second flanking genes. (d) Proportion of the second flanking gene orientation types for IGRs with OM sites, with O sites and with neither OM nor O sites. Pale red, convergent; pale green, tandem; pale blue, divergent. (e–h) Gene inversion experiments. (e,f) Strains used for experiments. By inverting def1+ (e) and urg1+ (f), gene orientation type of the adjacent IGR was changed (divergent to tandem in (e), tandem to convergent in (f)). Black thick line, promoter. White rectangle, a marker gene used for strain construction. (g,h) qPCR measurement of Mcm2-PK bound to the indicated genomic loci in the gene-inverted and control strains arrested in G1 phase. Loci in magenta correspond to the IGRs with gene inversion. I_3952 and III_1968 are IGRs with OM sites. II_235 is an IGR without Mcm2 binding. Means with error bars (SD) from three biological replicates are shown.
Figure 6.
Figure 6.
DNA-encoded features are sufficient to specify OM site location. (a) An outline of classifier building and evaluation. (b) ROC and PR curves of classifiers based on the indicated features. The averaged result of ten times repeated fourfold cross validation is shown. Numbers shown at the top are the means and 95% confidence intervals (in parentheses) of AUC. 13 feats, all the 13 features listed in electronic supplementary material, figure S2a. TPR, true-positive rate; FPR, false-positive rate. AUC, area under the curve. (c) Box plot of the probability scores calculated for IGRs that actually contain OM sites (OM), O sites (O), and neither OM nor O sites (non-OM/O). The used classifiers were trained on LAT, Nmt and Lntx.
Figure 7.
Figure 7.
Each of LAT, Nmt and Lntx shows correlation with OM site presence. (a,b) Stacked histograms of IGRs with the indicated LAT and Nmt values (a), and LAT and Lntx values (b). Magenta, IGR with OM sites; cyan, IGR with O sites; grey, IGRs without OM or O sites.

References

    1. O'Donnell M, Langston L, Stillman B. 2013. Principles and concepts of DNA replication in Bacteria, Archaea, and Eukarya. Cold Spring Harb. Perspect. Biol. 5, a010108 (10.1101/cshperspect.a010108.PRINCIPLES) - DOI - PMC - PubMed
    1. Siddiqui K, On KF, Diffley JFX. 2013. Regulating DNA replication in Eukarya. Cold Spring Harb. Perspect. Biol. 5, a012930 (10.1101/cshperspect.a012930) - DOI - PMC - PubMed
    1. Parker MW, Botchan MR, Berger JM. 2017. Mechanisms and regulation of DNA replication initiation in eukaryotes. Crit. Rev. Biochem. Mol. Biol. 52, 107–144. (10.1080/10409238.2016.1274717) - DOI - PMC - PubMed
    1. Riera A, Barbon M, Noguchi Y, Reuter LM, Schneider S, Speck C. 2017. From structure to mechanism— understanding initiation of DNA replication. Genes Dev. 31, 1073–1088. (10.1101/gad.298232.117.) - DOI - PMC - PubMed
    1. Creager RL, Li Y, MacAlpine DM. 2015. SnapShot: origins of DNA replication. Cell 161, 418 (10.1016/j.cell.2015.03.043) - DOI - PubMed

Publication types

MeSH terms