. 2020 Oct 22;136(17):1956-1967.
doi: 10.1182/blood.2019004776.

Novel manifestations of immune dysregulation and granule defects in gray platelet syndrome

Matthew C Sims  1   2   3 Louisa Mayer  1   2 Janine H Collins  1   2   4 Tadbir K Bariana  1   4   5 Karyn Megy  1   2   6 Cecile Lavenu-Bombled  7 Denis Seyres  1   2   6 Laxmikanth Kollipara  8 Frances S Burden  1   2   6 Daniel Greene  1   6   9 Dave Lee  10 Antonio Rodriguez-Romera  1   2 Marie-Christine Alessi  11 William J Astle  2   9 Wadie F Bahou  12 Loredana Bury  13 Elizabeth Chalmers  14 Rachael Da Silva  10 Erica De Candia  15   16 Sri V V Deevi  1   6 Samantha Farrow  1   2   6 Keith Gomez  5 Luigi Grassi  1   2   6 Andreas Greinacher  17 Paolo Gresele  13 Dan Hart  18 Marie-Françoise Hurtaud  7 Anne M Kelly  1 Ron Kerr  19 Sandra Le Quellec  20 Thierry Leblanc  7 Eva B Leinøe  21 Rutendo Mapeta  1   6 Harriet McKinney  1   2   6 Alan D Michelson  22 Sara Morais  23   24 Diane Nugent  25 Sofia Papadia  1   2   6 Soo J Park  26 John Pasi  18 Gian Marco Podda  27 Man-Chiu Poon  28 Rachel Reed  10 Mallika Sekhar  29 Hanna Shalev  30 Suthesh Sivapalaratnam  1   4 Orna Steinberg-Shemer  31   32 Jonathan C Stephens  1   6 Robert C Tait  33 Ernest Turro  1   2   6   9 John K M Wu  34 Barbara Zieger  35 NIHR BioResourceTaco W Kuijpers  36   37 Anthony D Whetton  10 Albert Sickmann  8   38   39 Kathleen Freson  40 Kate Downes  1   6 Wendy N Erber  41   42 Mattia Frontini  1   2   43 Paquita Nurden  44 Willem H Ouwehand  1   2   6   45 Remi Favier  7   46 Jose A Guerrero  1   2
Affiliations

Novel manifestations of immune dysregulation and granule defects in gray platelet syndrome

Matthew C Sims et al. Blood. .

Abstract

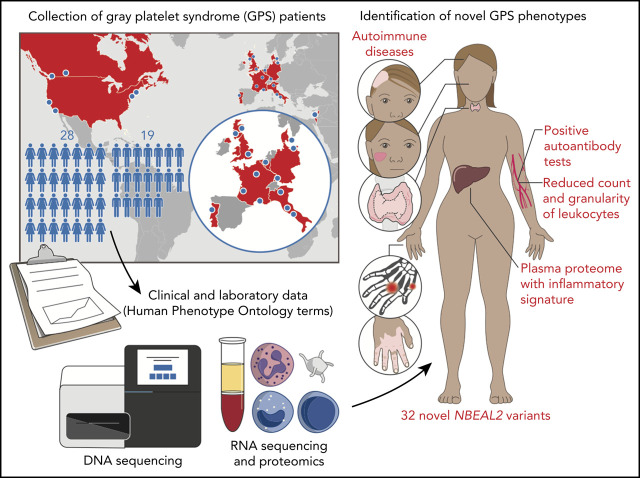
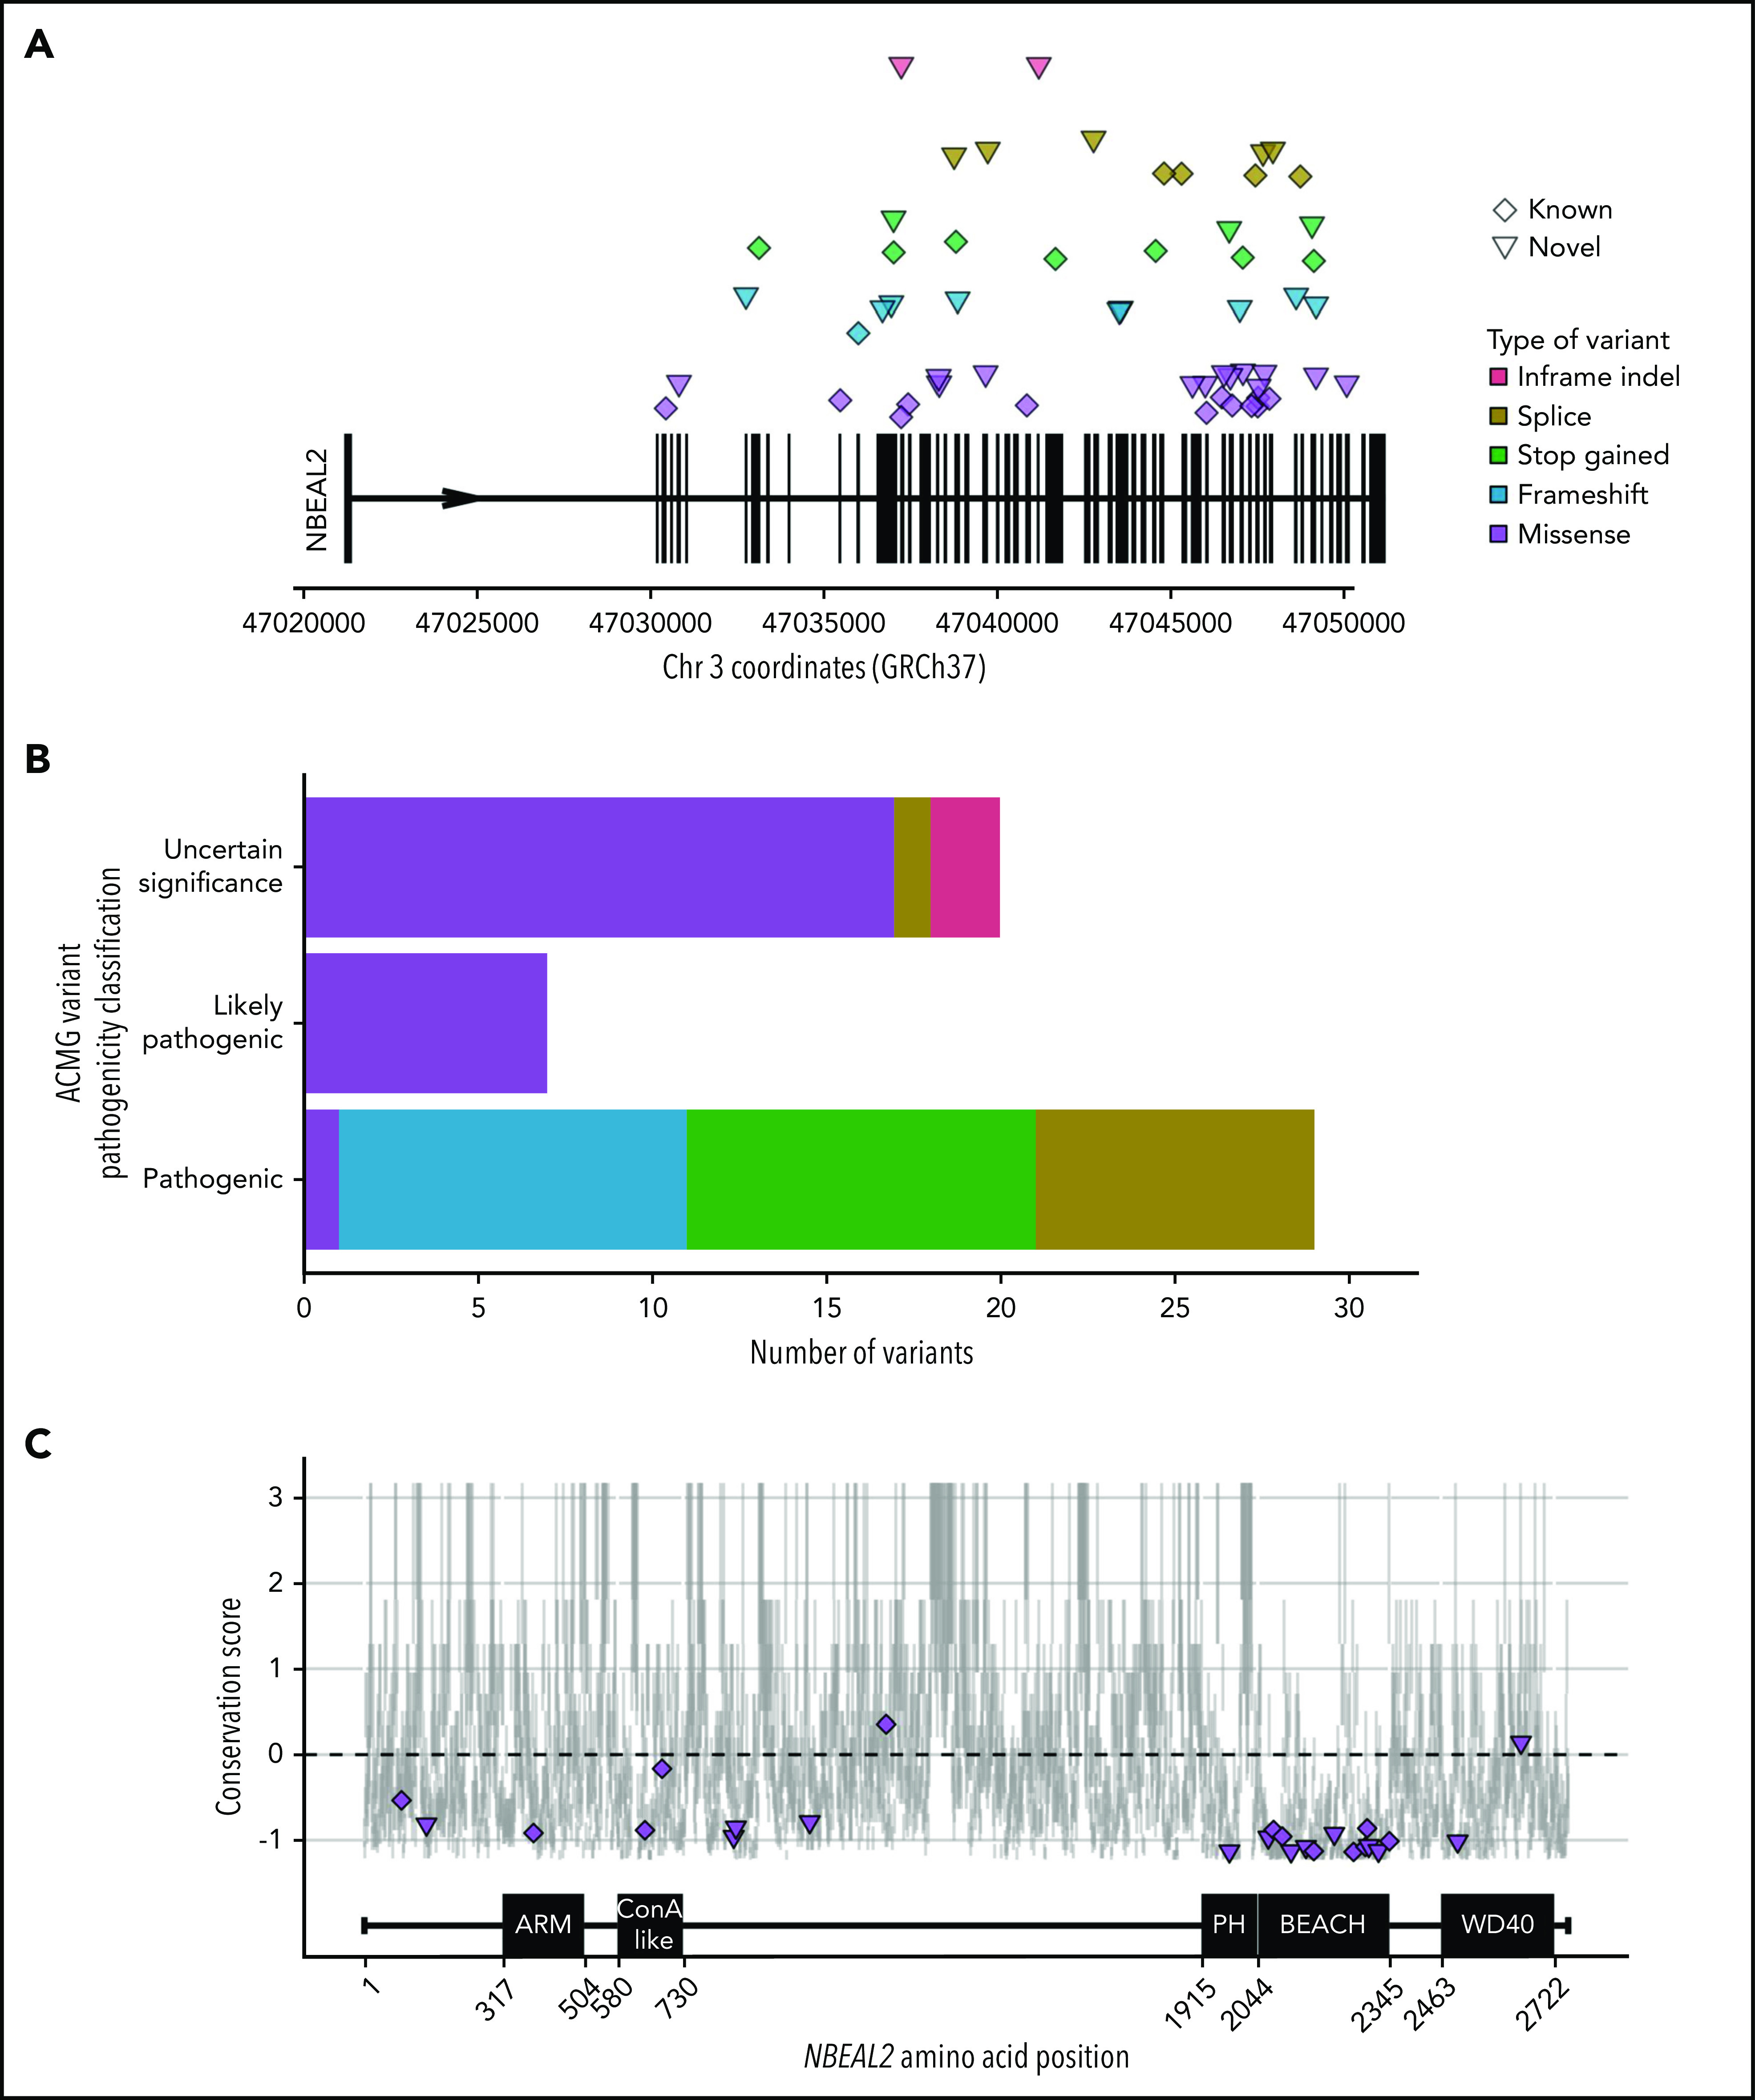
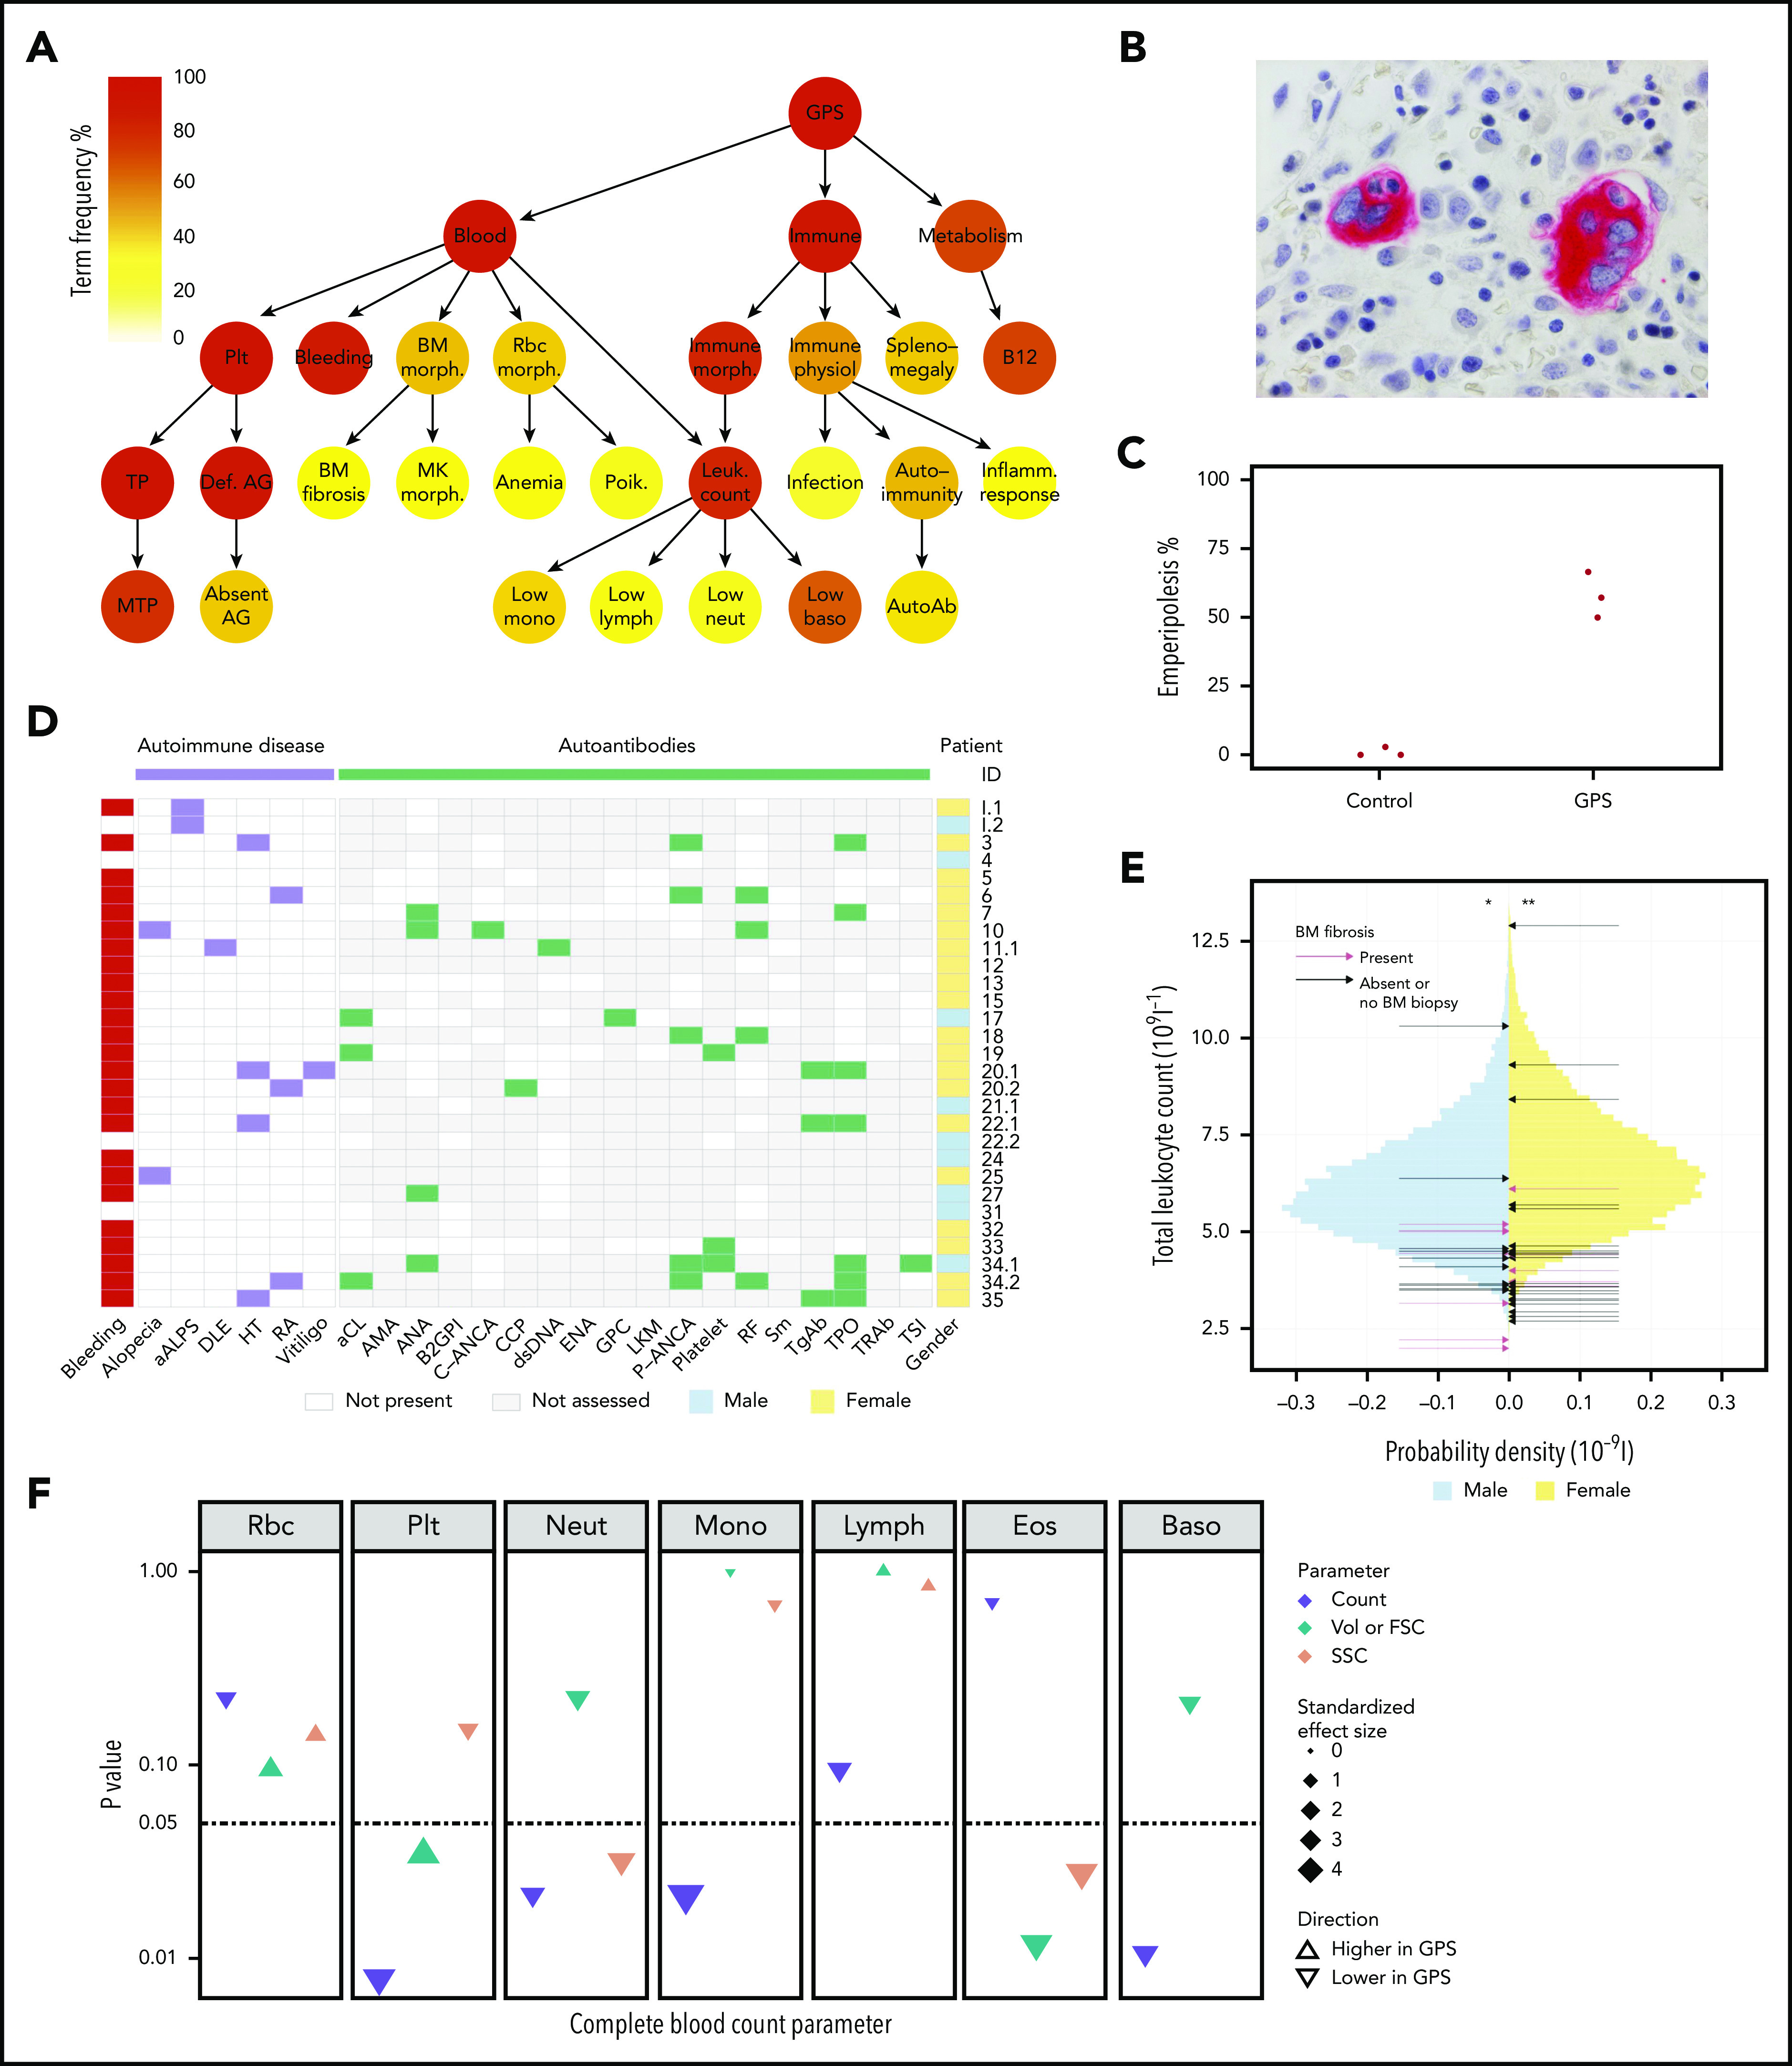
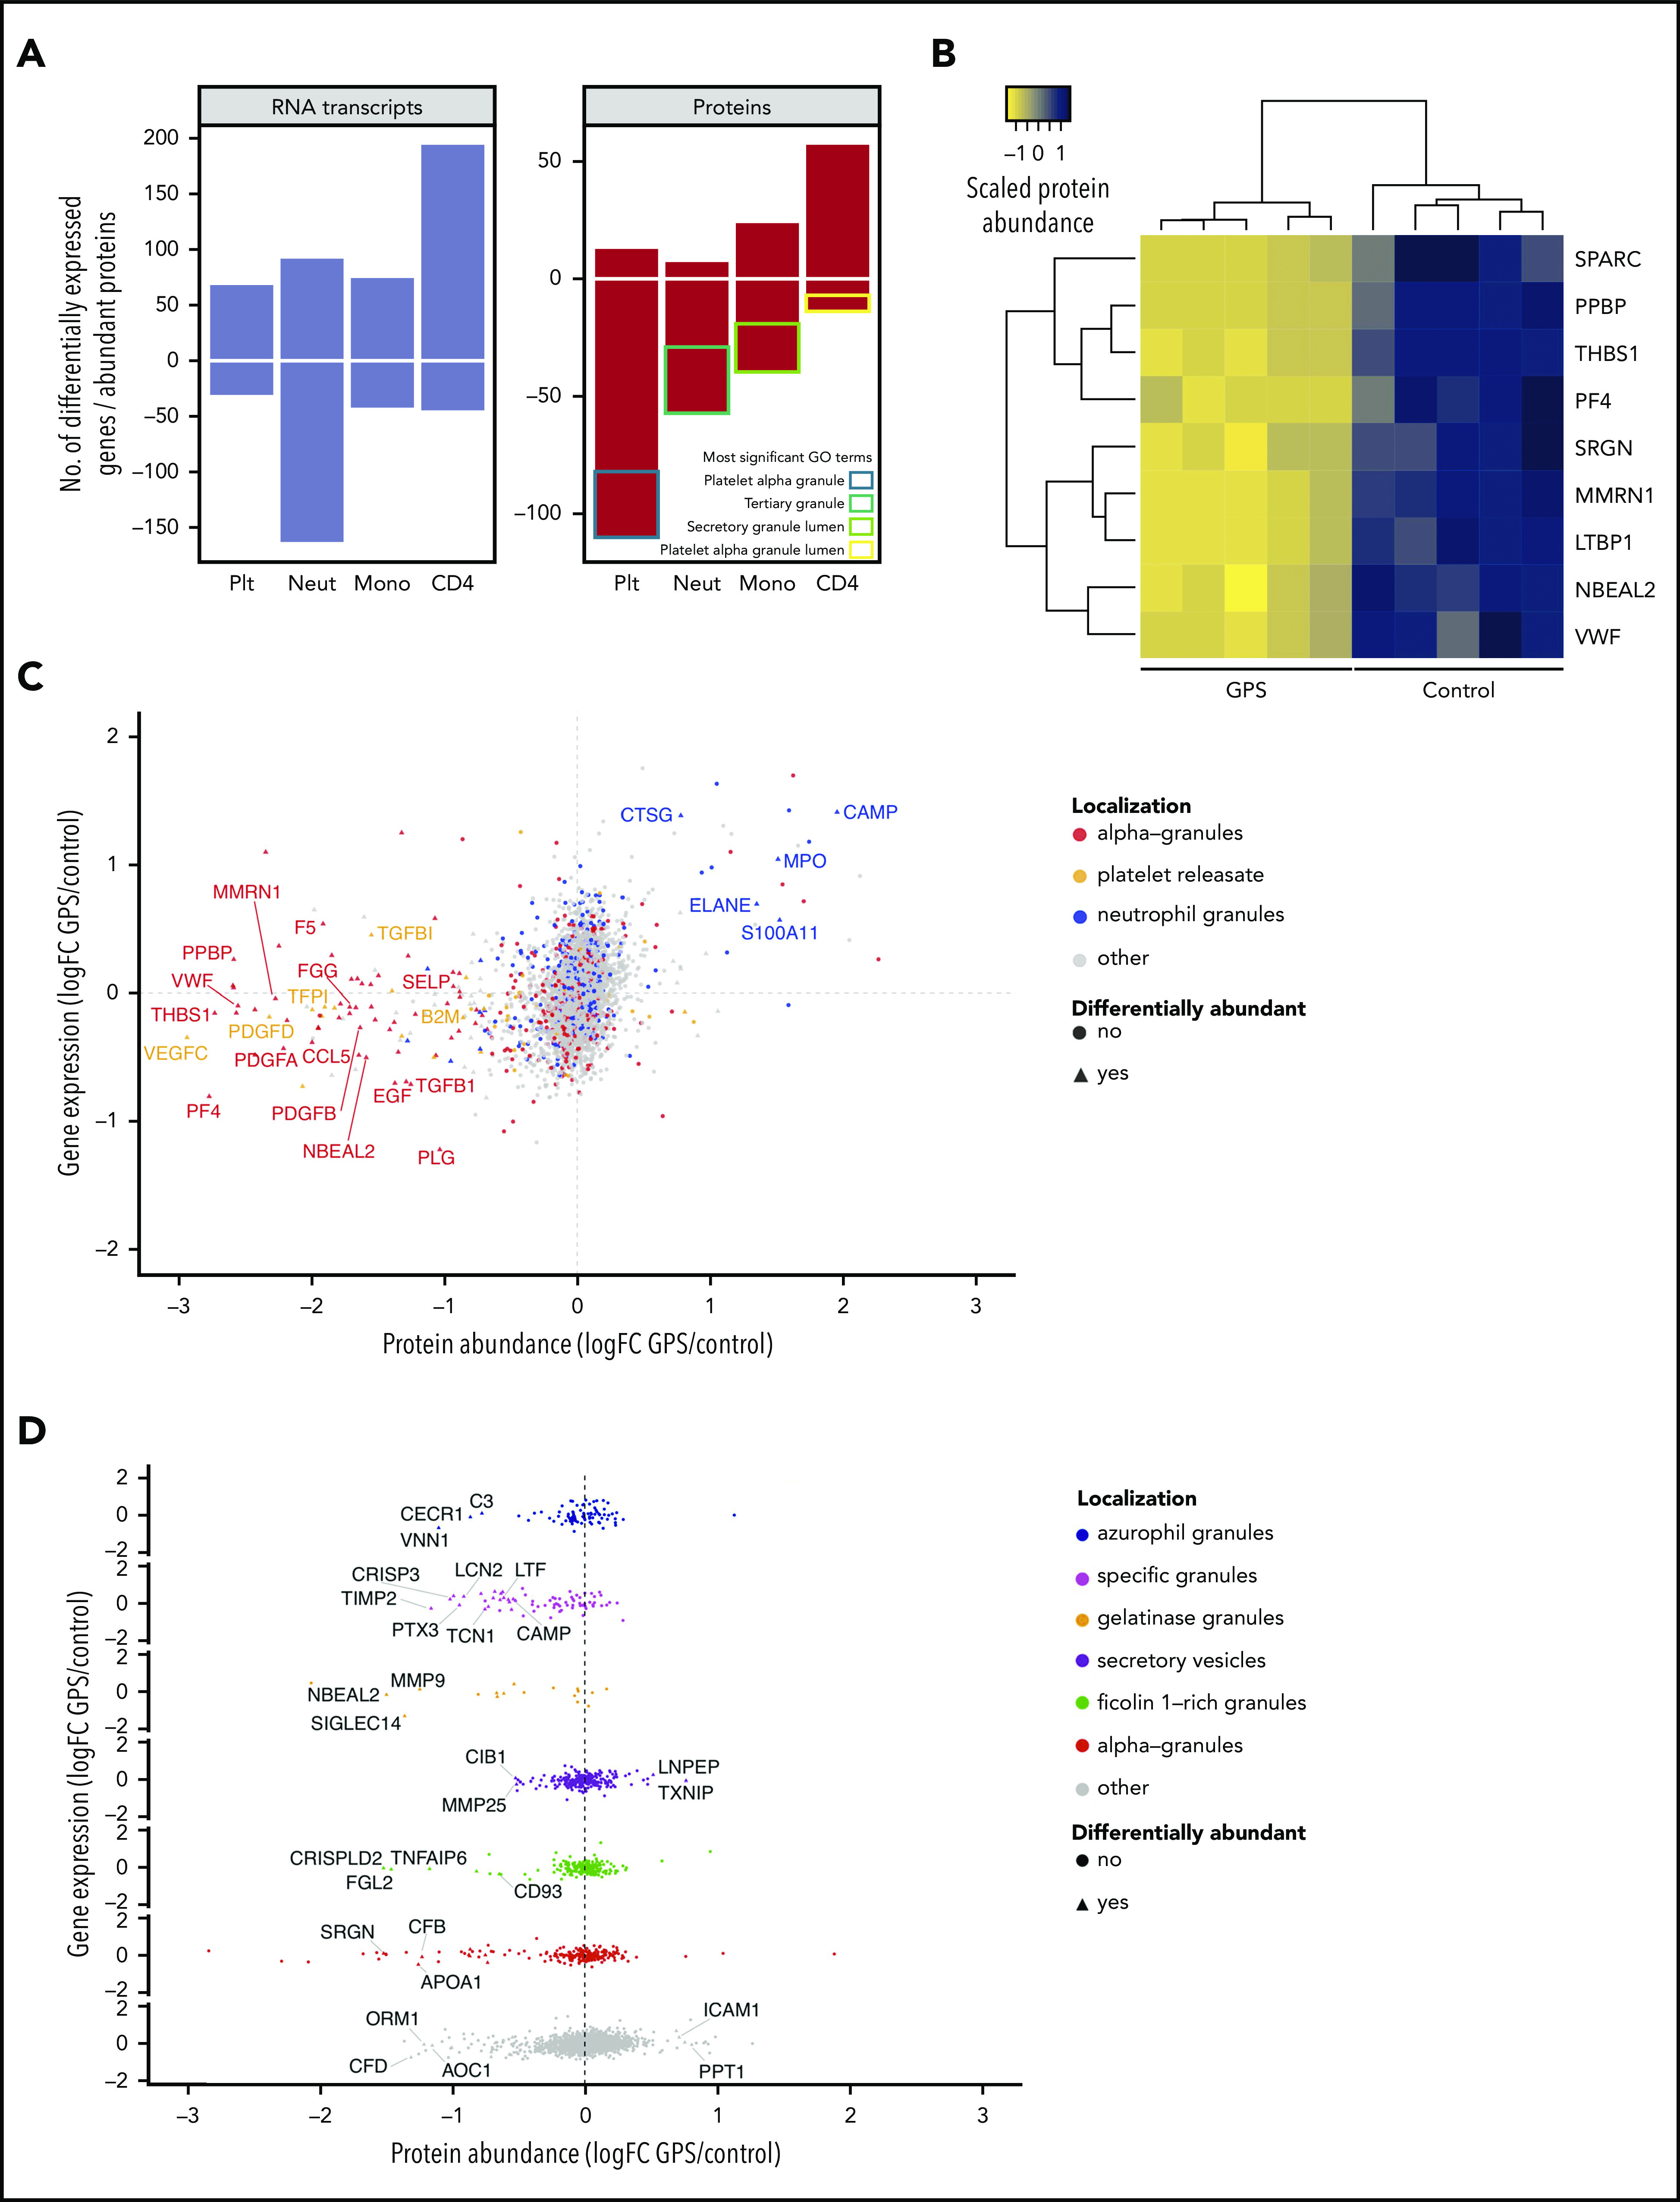
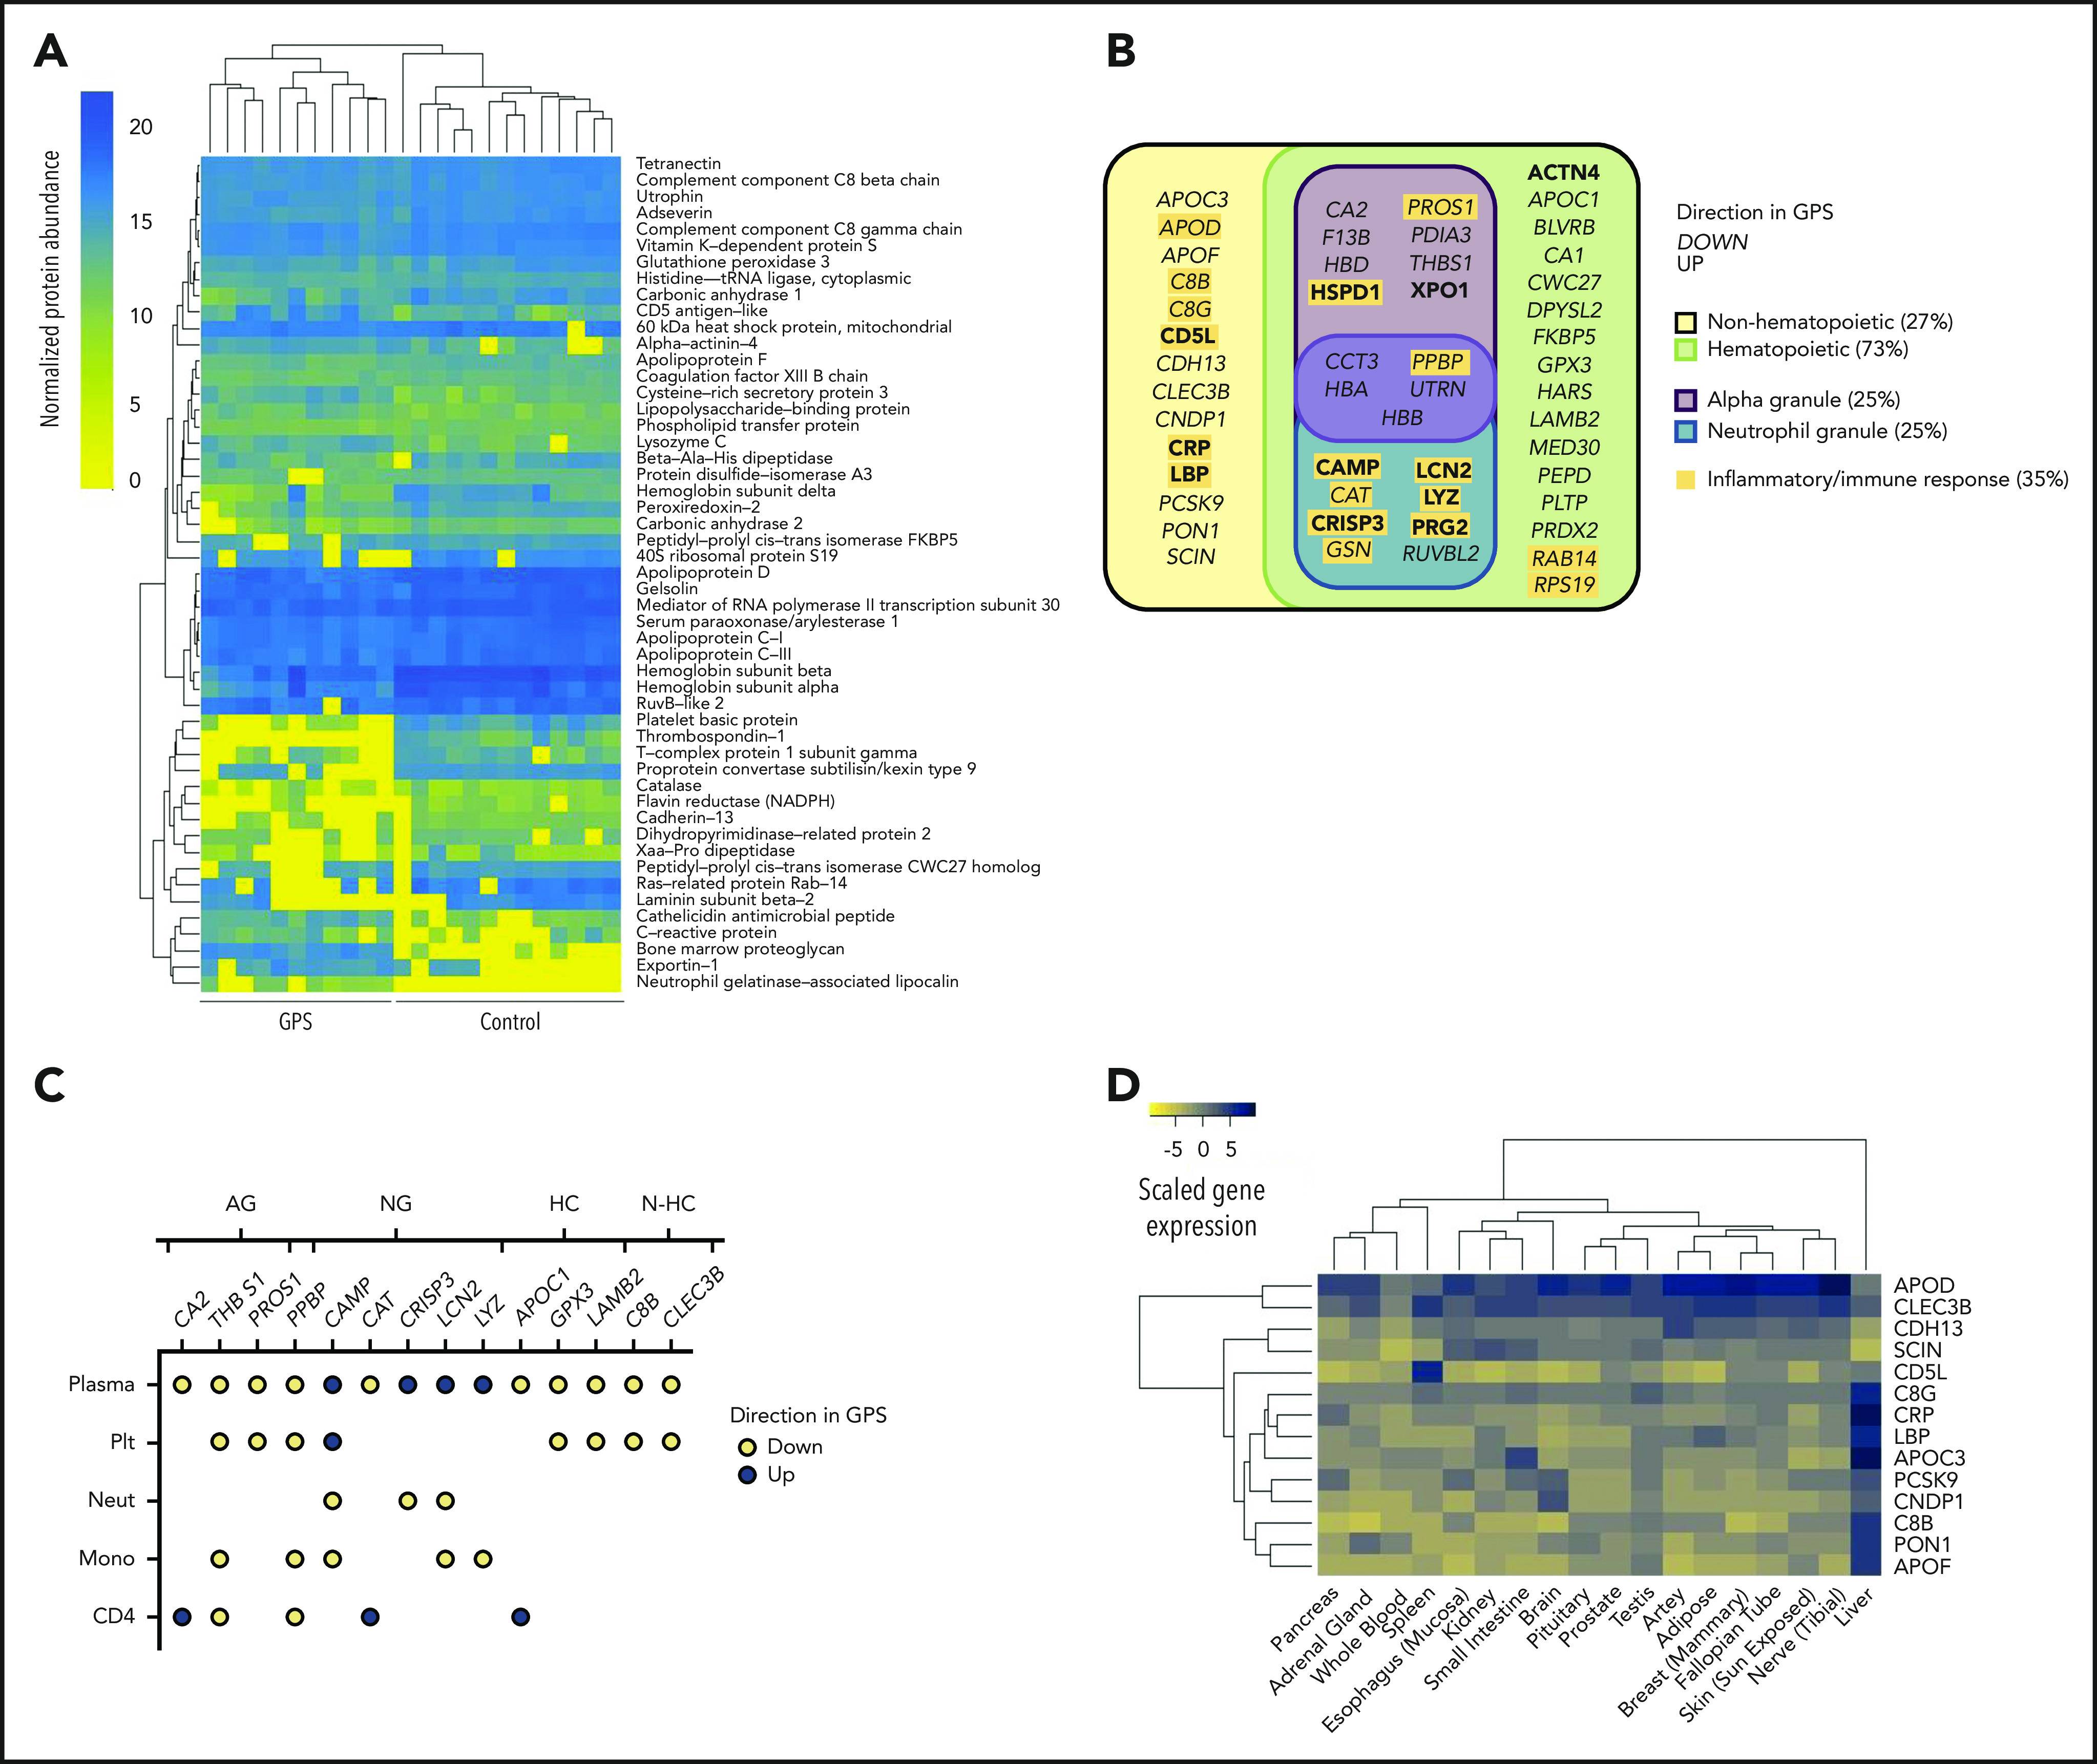
Gray platelet syndrome (GPS) is a rare recessive disorder caused by biallelic variants in NBEAL2 and characterized by bleeding symptoms, the absence of platelet α-granules, splenomegaly, and bone marrow (BM) fibrosis. Due to the rarity of GPS, it has been difficult to fully understand the pathogenic processes that lead to these clinical sequelae. To discern the spectrum of pathologic features, we performed a detailed clinical genotypic and phenotypic study of 47 patients with GPS and identified 32 new etiologic variants in NBEAL2. The GPS patient cohort exhibited known phenotypes, including macrothrombocytopenia, BM fibrosis, megakaryocyte emperipolesis of neutrophils, splenomegaly, and elevated serum vitamin B12 levels. Novel clinical phenotypes were also observed, including reduced leukocyte counts and increased presence of autoimmune disease and positive autoantibodies. There were widespread differences in the transcriptome and proteome of GPS platelets, neutrophils, monocytes, and CD4 lymphocytes. Proteins less abundant in these cells were enriched for constituents of granules, supporting a role for Nbeal2 in the function of these organelles across a wide range of blood cells. Proteomic analysis of GPS plasma showed increased levels of proteins associated with inflammation and immune response. One-quarter of plasma proteins increased in GPS are known to be synthesized outside of hematopoietic cells, predominantly in the liver. In summary, our data show that, in addition to the well-described platelet defects in GPS, there are immune defects. The abnormal immune cells may be the drivers of systemic abnormalities such as autoimmune disease.


Conflict of interest statement

Conflict-of-interest disclosure: The authors declare no competing financial interests.

Figures

None
Graphical abstract
Figure 1.
Figure 1.
NBEAL2 variants identified in patients with GPS participating in this study. (A) Position of the 56 unique variants relative to NBEAL2 on chromosome 3 (Chr 3) using Genome Reference Consortium human genome build 37 (GRCh37). Vertical black bars represent exons. The color and shape used to represent variants in the legend apply throughout the figure. Inframe indel refers to variants which are inframe small insertions and/or deletions ≤50 base pairs. (B) The frequency of unique variants classified by pathogenicity, according to the American College of Medical Genetics and Genomics (ACMG) guidelines. (C) The location of missense variants compared with the amino acid sequence of Nbeal2 and known functional domains (on the x-axis). The y-axis position of the variant is the estimated evolutionary conservation score of the affected residue calculated by using ConSurf. A positive score corresponds to lower conservation, and a negative score represents higher conservation. Vertical gray lines represent the range of conservation scores of the 50% confidence interval: the bottom and top of the bar are the 25th and 75th percentile, respectively, of the inferred evolutionary rate distribution.
Figure 2.
Figure 2.
Novel clinical phenotypes. (A) Summary HPO tree, showing the 3 most frequent HPO organ systems represented in the 47 patients with GPS: Blood (“Abnormality of blood and blood-forming tissues”), Immune (“Abnormality of the immune system”), and Metabolism (“Abnormality of metabolism/homeostasis”). HPO terms affecting ≥8 patients are shown except terms associated with “Bleeding,” which are displayed in supplemental Figure 2.1. HPO term labels: Plt, “Abnormal thrombocyte morphology”; Bleeding, “Abnormal bleeding”; BM morph., “Abnormality of bone marrow cell morphology”; Rbc morph., “Abnormal erythrocyte morphology”; Immune morph., “Abnormal immune system morphology”; Immune physiol., “Abnormality of immune system physiology”; Splenomegaly, “Splenomegaly”; B12, “Abnormal vitamin B12 level”; TP, “Thrombocytopenia”; Def. AG, “Abnormal number of alpha granules”; BM fibrosis, “Myelofibrosis”; MK morph., “Abnormal megakaryocyte morphology”; Anemia, “Anemia”; Poik., “Poikilocytosis”; Leuk. count, “Abnormal leukocyte count”; Infection, “Recurrent infections”; Autoimmunity, “Autoimmunity”; Inflamm. response, “Increased inflammatory response”; MTP, “Macrothrombocytopenia”; Absent AG, “Absence of alpha granules”; Low mono, “Monocytopenia”; Low lymph, “Lymphopenia”; Low neut, “Neutropenia”; Low baso, “Decreased basophil count”; AutoAb, “Autoimmune antibody positivity.” (B) BM trephine image with CD61 stain (1000×) of patient ID 20.3, which shows neutrophil emperipolesis by 2 MKs. (C) Dot plot showing percentage of MKs with neutrophil emperipolesis in 3 patients with GPS (patient IDs 18, 33, and 34.1) (supplemental Figure 2.2 presents representative BM trephine images) and 3 control subjects. (D) Representation of autoimmune disease, results of autoantibody tests, and presence of bleeding symptoms in 29 patients with GPS (labeled according to patient ID) in whom autoantibody tests were performed. Autoantibodies tested in at least 3 patients are included (listed per order in graphic): aALPS, atypical autoimmune lymphoproliferative syndrome; DLE, discoid lupus erythematosus; HT, Hashimoto’s thyroiditis; RA, rheumatoid arthritis; and autoantibodies against: aCL, cardiolipin; AMA, mitochondria; ANA, nuclear; B2GPI, beta2-glycoprotein I; C-ANCA, neutrophil cytoplasmic; CCP, cyclic citrullinated peptide; dsDNA, double-stranded DNA; ENA, extractable nuclear antigen; GPC, gastric parietal cell; LKM, liver–kidney microsome; P-ANCA, neutrophil perinuclear; RF, rheumatoid factor; Sm, spliceosomal; TgAb, thyroglobulin; TPO, thyroperoxidase; TRAb, thyroid-stimulating hormone receptor; TSI, thyroid stimulating immunoglobulin. (E) Histogram showing the total leukocyte count of 45 032 blood donors in the INTERVAL study stratified according to sex, upon which the results of the patients with GPS are represented by arrows. The median total leukocyte count of both male and female patients with GPS was significantly (P = 3 × 10⁻³ and 4 × 10⁻⁴, respectively) lower than INTERVAL participants using a one-sample Wilcoxon signed-rank test, as represented by * and **. (F) CBC results for 5 patients with GPS vs 5 control subjects. The data point for each cell type and CBC parameter shows the absolute standardized effect size and directionality. On the y-axis (log10 scale), the P value (Mann-Whitney U test) is shown; the horizontal dotted line represents P < .05. Volume (Vol) or forward scatter (FSC) refers to the following measurements: mean cell volume (MCV) for red blood cells (Rbc), platelet mean frequent volume (P-MFV) for platelets (Plt); FSC for neutrophils (Neut), monocytes (Mono), lymphocytes (Lymph), eosinophils (Eos), and basophils (Baso). SSC was available for all parameters except basophils and reflects the complexity of cellular contents, including granularity.
Figure 3.
Figure 3.
The transcriptome and proteome of platelets, neutrophils, monocytes, and CD4 lymphocytes. For all panels, log2 fold change (log2 fold change [logFC]) for gene expression (by RNA-seq) and protein abundance (by MS) was determined by log2-transforming the ratio of the means of individual normalized values of the 5 patients with GPS and 5 control subjects. Negative values represent genes/proteins that are reduced in GPS and vice versa. The threshold for differential abundance/expression was determined by each experimental method and the corresponding analysis used (supplemental Methods). (A) Bar chart showing differentially expressed genes by RNA-seq (left) and differentially abundant proteins by MS (right). The y-axis represents the absolute number of genes or proteins determined by each method, and negative numbers represent significant reduction in GPS cells and vice versa. The most significant GO cellular component terms for the differentially less abundant proteins of each of the cell types is illustrated in the “Proteins” panel. (B) For each individual, the protein abundance was calculated for each of the 9 proteins that are differentially less abundant in at least 3 types of cells and averaged across all of the cells. The results were scaled from −1 to 1 and plotted as a dendrogram with heatmap, such that positive (dark blue) and negative (yellow) values represent higher and lower protein abundance, respectively. Hierarchical clustering was applied by using the complete linkage method, and dissimilarity between rows and columns was based on the Euclidean distance. Each column represents an individual GPS patient or control subject. (C) The comparison of gene expression and protein abundance of platelets (GPS vs control) highlights the high proportion of “alpha-granules” and “releasate” proteins (in red and orange, respectively), which are significantly diminished in GPS platelets at the protein level (P < 2.2 × 10⁻¹⁶), and also shows that proteins normally resident in neutrophil granules (blue) are increased in GPS platelets. (D) The comparison of gene expression and protein abundance of neutrophils (GPS vs control) separated vertically by subcellular localization shows a significantly lower abundance of specific and gelatinase granule proteins in GPS neutrophils (P < 1.3 × 10⁻⁸ and < 2.2 × 10⁻¹⁶, respectively).
Figure 4.
Figure 4.
The GPS plasma proteome. (A) A heatmap of normalized protein abundance of the 51 discriminatory proteins detected in plasma from 11 patients with GPS and 13 control subjects, which showed segregation by unsupervised clustering. Each column represents an individual GPS patient or control subjects. (B) Classification of the 51 discriminatory proteins of the plasma proteome by directionality in GPS plasma, cellular origin (hematopoietic or nonhematopoietic), and subcellular localization (platelet α or neutrophil granules). Proteins involved in inflammatory or immune responses are highlighted in yellow. (C) A dot plot representing the 14 discriminatory plasma proteins that are also differentially abundant proteins in at least one of the cell types evaluated by using Sequential Window Acquisition of All Theoretical Mass Spectra-Mass Spectrometry (platelets [Plt], neutrophils [Neut], monocytes [Mono], and CD4 lymphocytes [CD4]). Each data point represents a protein and is color-coded according to its directionality in the respective proteome. Absence of a protein in an explicit cell-specific proteome denotes a protein that was determined not to be differentially abundant. Proteins are annotated by granule localization (AG = platelet α granule, NG = neutrophil granule) or, for proteins not localized in granules, gene expression in hematopoietic cells (HC) or non-hematopoietic cells (N-HC) in the BLUEPRINT consortium atlas. (D) A heatmap showing the gene expression of the 14 discriminatory plasma proteins of nonhematopoietic origin in the Genotype-Tissue Expression Project., Scaled gene expression represents log2 transformation of transcripts per million base pairs mapped.

Comment in

References

    1. Albers CA, Cvejic A, Favier R, et al. . Exome sequencing identifies NBEAL2 as the causative gene for gray platelet syndrome. Nat Genet. 2011;43(8):735-737. - PMC - PubMed
    1. Gunay-Aygun M, Falik-Zaccai TC, Vilboux T, et al. . NBEAL2 is mutated in gray platelet syndrome and is required for biogenesis of platelet α-granules. Nat Genet. 2011;43(8):732-734. - PMC - PubMed
    1. Kahr WH, Hinckley J, Li L, et al. . Mutations in NBEAL2, encoding a BEACH protein, cause gray platelet syndrome. Nat Genet. 2011;43(8):738-740. - PMC - PubMed
    1. Lo RW, Li L, Leung R, Pluthero FG, Kahr WHA. NBEAL2 (Neurobeachin-Like 2) is required for retention of cargo proteins by α-granules during their production by megakaryocytes. Arterioscler Thromb Vasc Biol. 2018;38(10):2435-2447. - PubMed
    1. Mayer L, Jasztal M, Pardo M, et al. . Nbeal2 interacts with Dock7, Sec16a, and Vac14. Blood. 2018;131(9):1000-1011. - PMC - PubMed

Publication types

MeSH terms