. 2020 Jan-Dec:29:963689720943608.
doi: 10.1177/0963689720943608.

NEAT1 Negatively Regulates Cell Proliferation and Migration of Neuroblastoma Cells by miR-183-5p/FOXP1 Via the ERK/AKT Pathway

Affiliations

NEAT1 Negatively Regulates Cell Proliferation and Migration of Neuroblastoma Cells by miR-183-5p/FOXP1 Via the ERK/AKT Pathway

Weikang Pan et al. Cell Transplant. 2020 Jan-Dec.

Abstract

Neuroblastoma, a malignant tumor of the sympathetic nervous system, is an aggressive extracranial tumor in childhood. Long noncoding RNAs (lncRNAs) have been discovered to play a key role in the eukaryotic regulatory gene network and be involved in a wide variety of biological processes. We observed that the expression of lncRNA nuclear-enriched abundant transcript-1 (NEAT1) was significantly decreased in human neuroblastoma tissues and cell lines, compared with the normal. We observed cell proliferation, migration, and invasion with Cell Counting Kit-8 assay, colony formation assay, and Transwell assay to investigate the effects of NEAT1, miR-183-5p, or FOXP1 on neuroblastoma cells. And we also used StarBase and luciferase reporter gene assay to predict and confirm the interaction of NEAT1, miR-183-5p, and FOXP1 in neuroblastoma cells. First, overexpression of NEAT1 suppressed cell proliferation and played a key role in cell migration and invasion. In addition, NEAT1 was demonstrated to directly interact with miR-183-5p and exerted its antioncogenic role in neuroblastoma by negatively regulating miR-183-5p expression. miR-183-5p suppressed the expression of FOXP1 and regulated cell proliferation and migration by directly targeting FOXP1 mRNA 3'-untranslated region. Moreover, FOXP1 antagonized the effect of miR-183-5p on the phosphorylation of extracellular-regulated kinase/protein kinase B (ERK/AKT), while FOXP1 siRNA increased the reduced phosphorylation of ERK/AKT caused by miR-183-5p inhibitor in neuroblastoma cells. Taken together, these data showed that NEAT1 negatively regulated cell proliferation and migration of neuroblastoma by the miR-183-5p/FOXP1 axis via suppression of the ERK/AKT pathway. Our findings may provide a new target for the study of pathogenesis and treatment of neuroblastoma.

Keywords: FOXP1; NEAT1; miR-183-5p; neuroblastoma; the ERK/AKT pathway.


Conflict of interest statement

Declaration of Conflicting Interests: The author(s) declared no potential conflicts of interest with respect to the research, authorship, and/or publication of this article.

Figures

Fig. 1.
Fig. 1.
Expression of NEAT1 in human neuroblastoma tissues and cell lines using real-time quantitative polymerase chain reaction analysis. (A) Expression of NEAT1 in human neuroblastoma tissues (n = 30) and normal tissues (n = 30). β-actin was used as an internal reference. (B) Expression of NEAT1 in different tumor stages (stage I, n = 5; stage II, n = 12; stage III, n = 9; stage IV, n = 4). (C) Expression of NEAT1 in different age groups (n < 18 mo and n > 18 mo). (D) Expression of NEAT1 in different cell lines. Statistical significance was determined using an independent-sample t-test. Values were expressed as mean ± standard error of mean, n = 3. *P < 0.05 and **P < 0.01 vs normal or control. NB: neuroblastoma; NEAT1: nuclear-enriched abundant transcript-1; HUVEC: human umbilical vein endothelial cell.
Fig. 2.
Fig. 2.
NEAT1 overexpression regulated the cell proliferation, migration, and invasion in neuroblastoma cells. (A, B) real-time quantitative polymerase chain reaction was performed to determine the expression of NEAT1 in SK-N-SH or SH-SY5Y neuroblastoma cells (1.0 × 10⁵/cm2) transfected with pcDNA3.1 (vector, 1 μg/ml), pcDNA-NEAT1 (1 or 2 μg/ml), or control. (C, D) The colony-forming ability was tested by using the colony formation assay. (E, F) Cell proliferation ability was tested by Cell Counting Kit-8. (G–I) The Transwell assay detected the migrative and invasive abilities in neuroblastoma cells. Neuroblastoma cells were transfected with pcDNA-NEAT1 for 48 h. Statistical significance was determined using an independent-sample t-test. Values were expressed as mean ± standard error of mean, n = 3. *P < 0.05 and **P < 0.01 vs vector or control. # P < 0.05 and ## P < 0.01 vs vector or control. NEAT1: nuclear-enriched abundant transcript-1.
Fig. 3.
Fig. 3.
NEAT1 directly targeted miR-183-5p. (A) Online database StarBase showed sequence alignment between NEAT1 and miR-183-5p. (B) The luciferase reporter gene assay validated the binding of NEAT1 and miR-183-5p. Firefly and Renilla luciferase activities were determined. (C) HEK293 cells were transfected with biotinylated miR-183-5p (Bio-183-5p-wt) or its mutant form (Bio-183-5p-mut), and then a biotin-based pull-down assay was performed to detect NEAT1 expression and normalized to a biotinylated mimic control (Bio-NC) by RT-qPCR. (D) Expression of mir-183-5p in different cell lines. (E) Expression of miR-183-5p in human neuroblastoma tissues (n = 30) and normal tissues (n = 30). U6 was used as an internal reference. (F, G) Effect of NEAT1 overexpression on miR-183-5p in SK-N-SH or SH-SY5Y neuroblastoma cells. RT-qPCR was performed to determine the expression of mir-183-5p. Statistical significance was determined using an independent-sample t-test. Values were expressed as mean ± standard error of mean, n = 3. *P < 0.05 and **P < 0.01 vs normal or control. HUVEC: human umbilical vein endothelial cell; NB: neuroblastoma; NEAT1: nuclear-enriched abundant transcript-1; RT-qPCR: real-time quantitative polymerase chain reaction.
Fig. 4.
Fig. 4.
MiR-183-5p overexpression promoted the cell proliferation, migration, and invasion in neuroblastoma cells. SK-N-SH or SH-SY5Y neuroblastoma cells (1.0 × 10⁵/cm2) were transfected with NC mimic (20 nM), miR-183-5p mimic (20 nM), NC inhibitor (20 nM), and miR-183-5p inhibitor (20 nM) for 48 h. (A) Expression of miR-183-5p was transfected with miR-183-5p mimic, miR-183-5p inhibitor, and control (NC mimic and NC inhibitor) in SK-N-SH cells and (E) SH-SY5Y cells. (B) The capacity of cell proliferation was tested by Cell Counting Kit 8 in SK-N-SH cells and (F) SH-SY5Y cells. (C, D) Transwell assay detected the migrative and invasive abilities in SK-N-SH cells and (G, H) SH-SY5Y cells. Statistical significance was determined using an independent-sample t-test. Values were expressed as mean ± standard error of mean, n = 3. *P < 0.05 and **P < 0.01 vs NC mimic or NC inhibitor.
Fig. 5.
Fig. 5.
MiR-183-5p overexpression reversed the effect of NEAT1 in neuroblastoma cells. SK-N-SH or SH-SY5Y neuroblastoma cells (1.0 × 10⁵/cm2) were co-transfected with pcDNA-NEAT1 (2 μg/ml) and miR-183-5p mimic (20 nM) for 48 h. (A) The capacity of cell proliferation was tested by Cell Counting Kit 8 in SK-N-SH cells and (E) SH-SY5Y cells. (B) The colony-forming capacity was tested by colony formation assay in SK-N-SH cells and (F) SH-SY5Y cells. (C, D) The Transwell assay detected the migrative and invasive abilities in SK-N-SH cells and (G, H) SH-SY5Y cells. Statistical significance was determined using an independent-sample t-test. Values were expressed as mean ± standard error of mean, n = 3. *P < 0.05 and **P < 0.01 vs control. NEAT1: nuclear-enriched abundant transcript-1.
Fig. 6.
Fig. 6.
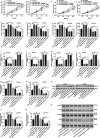
MiR-183-5p directly targeted FOXP1. (A) Online database StarBase showed sequence alignment between miR-183-5p and FOXP1. (B) The luciferase reporter gene assay validated the binding of miR-183-5p and FOXP1. Firefly and Renilla luciferase activities were determined. (C) Expression of FOXP1 in different cell lines was tested by using western blot analysis. (D) The quantification of band intensity relative to β-actin intensity of (C) was quantified by MBF ImageJ software. (E) Expression of FOXP1 in human neuroblastoma tissues (n = 30) and normal tissues (n = 30). β-actin was used as an internal reference. (F) Effect of miR-183-5p on FOXP1 in SK-N-SH or (G) SH-SY5Y neuroblastoma cells and the quantification of band intensity relative to β-actin intensity of (F, G) was quantified by MBF ImageJ software. (H) Expression of FOXP1 in different cell lines was tested by using western blot analysis. (I) Western blot detected the phosphorylation of ERK, AKT, and pS6 in neuroblastoma cells. (J–L) The quantification of band intensity relative to β-actin intensity of (I) was quantified by MBF ImageJ software. Statistical significance was determined using an independent-sample t-test. Values were expressed as mean ± standard error of mean, n = 3. *P < 0.05 and **P < 0.01 vs normal or control.
Fig. 7.
Fig. 7.
MiR-183-5p participates in the ERK/AKT pathway by targeting FOXP1. SK-N-SH or SH-SY5Y neuroblastoma cells (1.0 × 10⁵/cm2) were co-transfected with pcDNA-NEAT1 (2 μg/ml) and miR-183-5p mimic (20 nM), or co-transfected with FOXP1 siRNA (20 nM) and miR-183-5p inhibitor (20 nM) for 48 h. (A–D) The capacity of cell proliferation was tested by Cell Counting Kit 8 in SK-N-SH cells and SH-SY5Y cells. (E, G) The Transwell assay detected the migrative and invasive abilities in SK-N-SH cells and (F, H) SH-SY5Y cells. (I, J) Expression of FOXP1 mRNA and (K, L) protein in SK-N-SH or SH-SY5Y neuroblastoma cell lines. (M, N) Expression of miR-183-5p in different cell lines was tested by using RT-qPCR analysis. (O) The quantification of band intensity relative to β-actin intensity of (K, L) was quantified by MBF ImageJ software. (P) Western blot detected the phosphorylation of AKT and (Q) ERK in neuroblastoma cells. (R) The quantification of band intensity normalized to β-actin intensity of (P, Q) was quantified by MBF ImageJ software. Statistical significance was determined using an independent-sample t-test. Values were expressed as mean ± standard error of mean, n = 3. *P < 0.05 and **P < 0.01 vs normal or control.NEAT1: nuclear-enriched abundant transcript-1.

Similar articles

Cited by

References

    1. Janoueix-Lerosey I, Schleiermacher G, Delattre O. Molecular pathogenesis of peripheral neuroblastic tumors. Oncogene. 2010; 29(11):1566–1579. - PubMed
    1. Scaruffi P, Stigliani S, Moretti S, Coco S, De Vecchi C, Valdora F, Garaventa A, Bonassi S, Tonini GP. Transcribed-ultra conserved Region expression is associated with outcome in high-risk neuroblastoma. BMC Cancer. 2009;9(1):441–467. - PMC - PubMed
    1. Wang SS, Hsiao R, Limpar MM, Lomahan S, Tran TA, Maloney NJ, Ikegaki N, Tang XX. Destabilization of MYC/MYCN by the mitochondrial inhibitors, metaiodobenzylguanidine, metformin and phenformin. Int J Mol Med. 2014;33(1):35–42. - PMC - PubMed
    1. Park JR, Eggert A, Caron H. Neuroblastoma: biology, prognosis, and treatment. Hematol Oncol Clin North Am. 2010;24(1):65–86. - PubMed
    1. Haemmerle M, Gutschner T. Long non-coding RNAs in cancer and development: where do we go from here? Int J Mol Sci. 2015;16(1):1395–1405. - PMC - PubMed

Publication types

MeSH terms