. 2020 Aug 4;117(31):18858-18868.
doi: 10.1073/pnas.2002313117. Epub 2020 Jul 21.

Allosteric deactivation of PIFs and EIN3 by microproteins in light control of plant development

Affiliations

Allosteric deactivation of PIFs and EIN3 by microproteins in light control of plant development

Qingqing Wu et al. Proc Natl Acad Sci U S A. .

Abstract

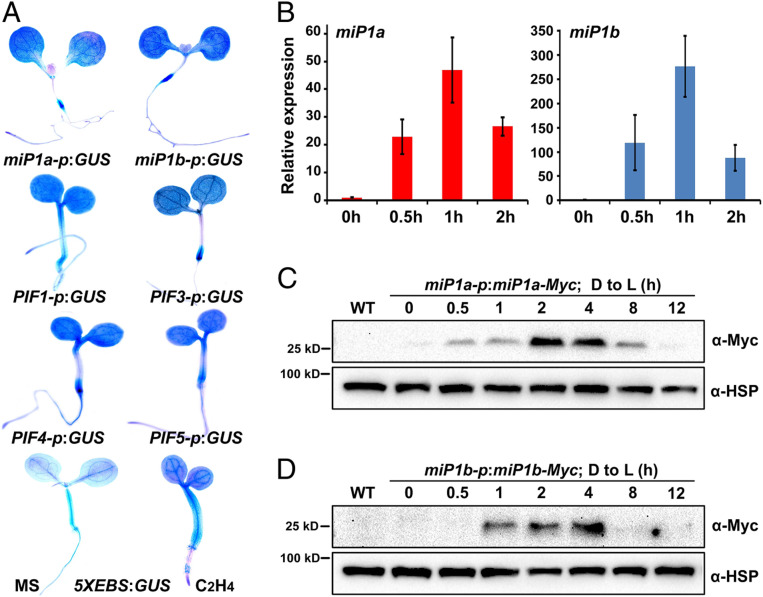
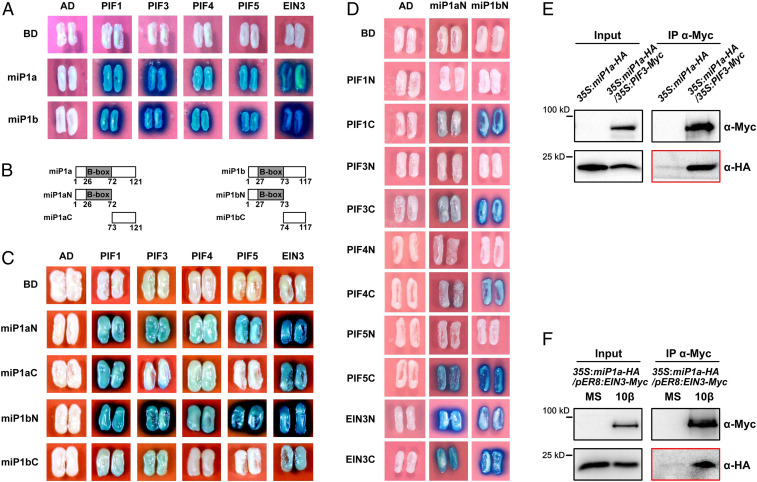
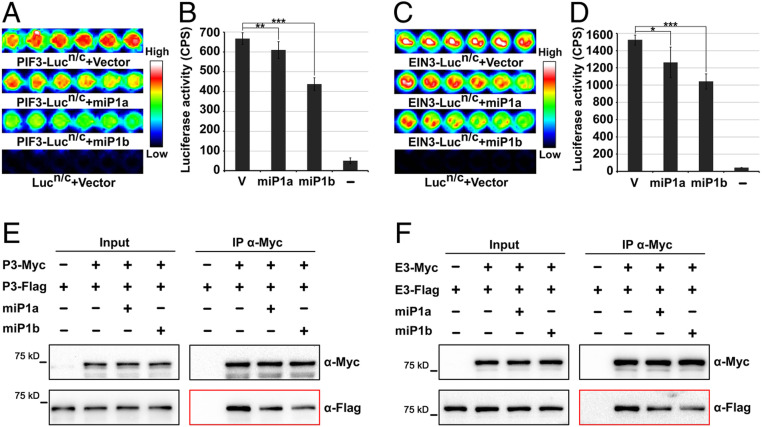
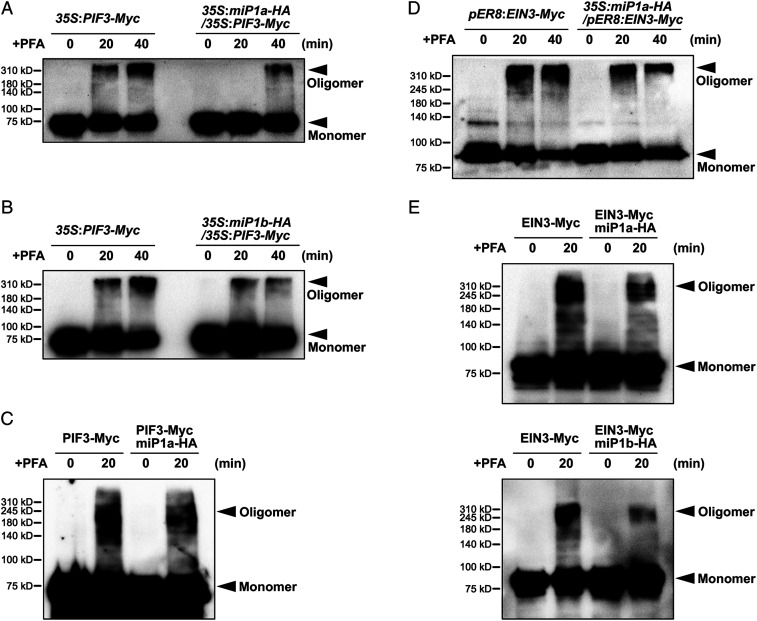
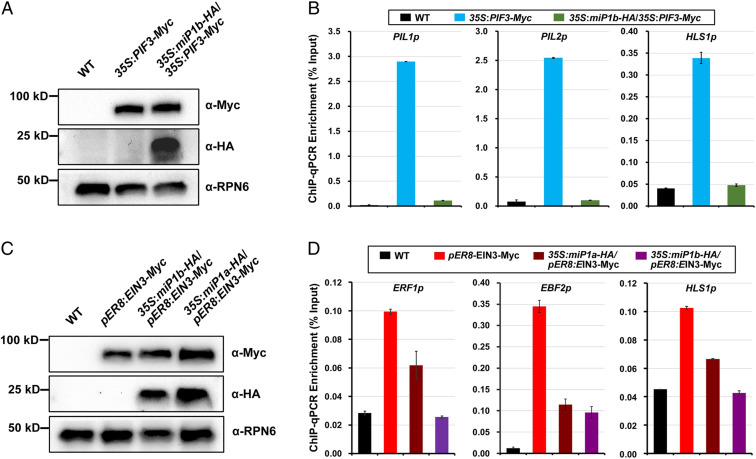
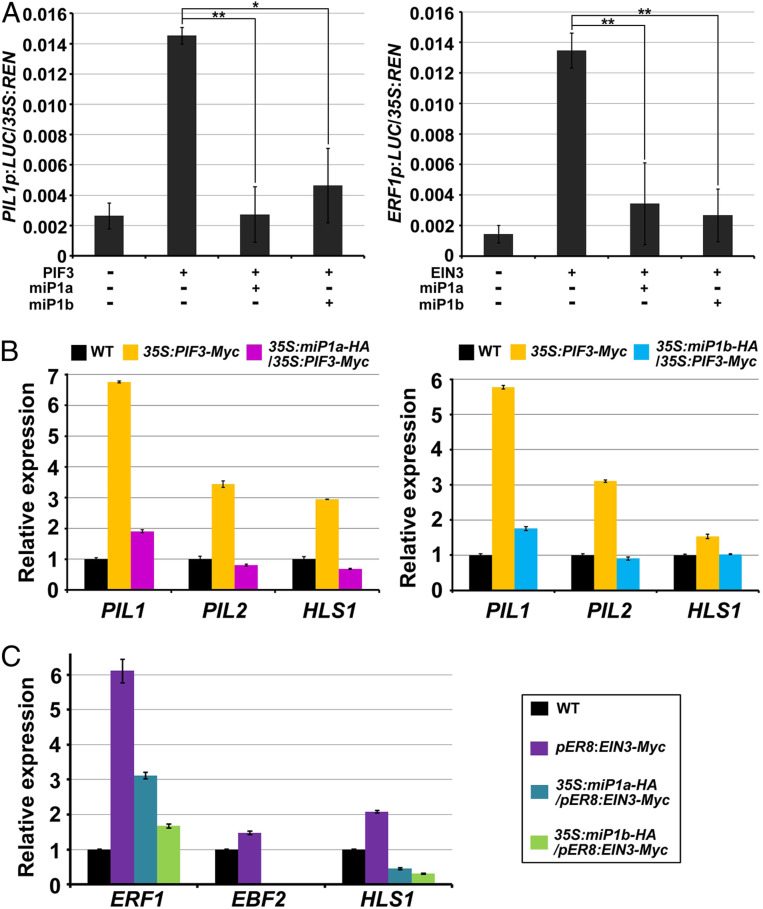
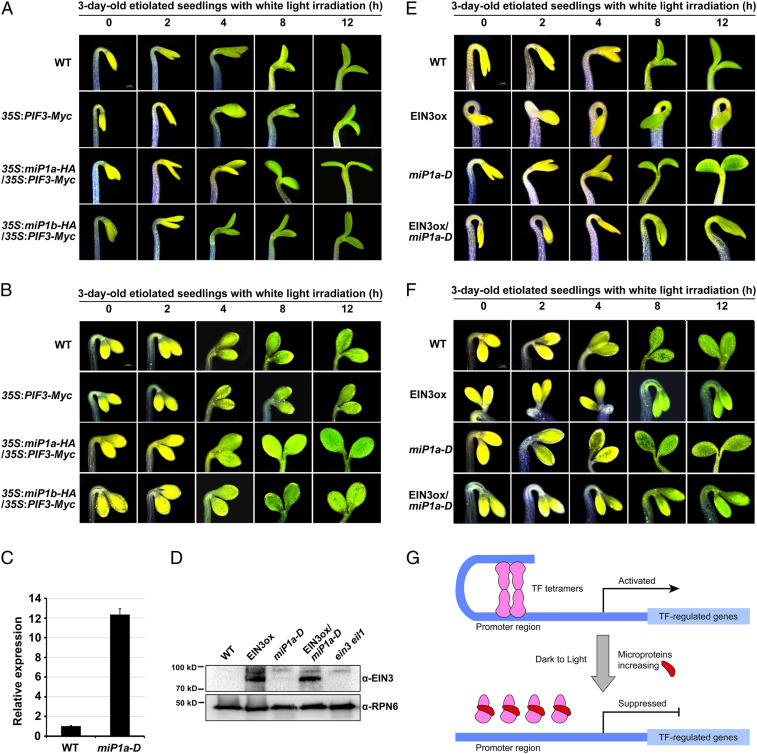
Buried seedlings undergo dramatic developmental transitions when they emerge from soil into sunlight. As central transcription factors suppressing light responses, PHYTOCHROME-INTERACTING FACTORs (PIFs) and ETHYLENE-INSENSITIVE 3 (EIN3) actively function in darkness and must be promptly repressed upon light to initiate deetiolation. Microproteins are evolutionarily conserved small single-domain proteins that act as posttranslational regulators in eukaryotes. Although hundreds to thousands of microproteins are predicted to exist in plants, their target molecules, biological roles, and mechanisms of action remain largely unknown. Here, we show that two microproteins, miP1a and miP1b (miP1a/b), are robustly stimulated in the dark-to-light transition. miP1a/b are primarily expressed in cotyledons and hypocotyl, exhibiting tissue-specific patterns similar to those of PIFs and EIN3 We demonstrate that PIFs and EIN3 assemble functional oligomers by self-interaction, while miP1a/b directly interact with and disrupt the oligomerization of PIFs and EIN3 by forming nonfunctional protein complexes. As a result, the DNA binding capacity and transcriptional activity of PIFs and EIN3 are predominantly suppressed. These biochemical findings are further supported by genetic evidence. miP1a/b positively regulate photomorphogenic development, and constitutively expressing miP1a/b rescues the delayed apical hook unfolding and cotyledon development of plants overexpressing PIFs and EIN3 Our study reveals that microproteins provide a temporal and negative control of the master transcription factors' oligomerization to achieve timely developmental transitions upon environmental changes.

Keywords: EIN3/EIL1; PIFs; light signaling; microprotein; protein oligomerization.


Conflict of interest statement

The authors declare no competing interest.

Figures

Fig. 1.
Fig. 1.
Spatial and temporal expression patterns of miP1a and miP1b genes in Arabidopsis seedlings. (A) Representative images of GUS staining in 5-d-old light-grown seedlings. 5XEBS:GUS seedlings were grown on 1/2 MS medium without (MS) or with 10 ppm ethylene (C2H4). (B) RT-qPCR analysis of the gene expression levels of miP1a and miP1b during the dark-to-light transition. WT seedlings were grown in the dark for 3 d and then exposed to light for the indicated periods of time. Mean ± SD; n = 3. (C and D) Immunoblot analysis of miP1a (C) and miP1b (D) protein abundance during the dark-to-light transition. The seedlings were grown in the dark for 3 d and then exposed to light for the indicated periods of time. Anti-Myc and anti-HSP antibodies were used for immunoblots. WT was used as a negative control. HSP proteins were utilized for loading controls.
Fig. 2.
Fig. 2.
miP1a and miP1b physically interact with PIF1, PIF3, PIF4, PIF5, and EIN3. (A) Yeast two-hybrid assays for the interactions between miP1a and miP1b (miP1a/b) with PIFs and EIN3. Full-length miP1a or miP1b was fused with a LexA DNA binding domain (BD). Full-length PIF1, PIF3, PIF4, PIF5, or EIN3 was fused with an activation domain (AD). Empty vectors (BD or AD) were used as negative controls. (B) Schematic representations of the full-length and various truncated versions of miP1a (Left) and miP1b (Right) used in the yeast two-hybrid assays. The numbers represent the amino acid residues. (C and D) Yeast two-hybrid assays for the interactions between truncated versions of miP1a/b with PIFs and EIN3. The N or C terminus of miP1a/b was fused with a BD. The full-length and truncated PIFs or EIN3 was fused with an AD. Empty vectors (BD or AD) were used as negative controls. (E) Co-IP assays for the interactions between miP1a and PIF3 in Arabidopsis seedlings. Total protein was extracted from 3-d-old etiolated seedlings and immunoprecipitated by anti-Myc antibodies. Anti-Myc and anti-HA antibodies were used for immunoblots. (F) Co-IP assays for the interactions between miP1a and EIN3 in Arabidopsis seedlings. The seedlings were grown on 1/2 MS medium without (MS) or with (10β) 10 μM β-estradiol in the dark for 3 d. Anti-Myc antibodies were used for immunoprecipitation. Anti-Myc and anti-HA antibodies were used for immunoblots.
Fig. 3.
Fig. 3.
miP1a and miP1b repress the self-interactions of PIF3 and EIN3. (AD) Representative images (A and C) and quantitative analysis (B and D) of luciferase bioluminescence from LCI assays in HEK293T cells showing that miP1a/b repress the self-associations of PIF3 (A and B) and EIN3 (C and D). Full-length PIF3 or EIN3 was fused with the split N- or C-terminal fragments of luciferase (Lucn/c). pcDNA3.1-miP1a-HA, pcDNA3.1-miP1b-HA, or pcDNA3.1-HA empty vector (V) was cotransformed into HEK293T cells. Empty pcDNA3.1-Lucn/c and pcDNA3.1-HA vectors were used as negative controls (−). CPS, counts per second. Mean ± SD; n = 6. *P < 0.05, **P < 0.01, and ***P < 0.001. Student’s t test. (E and F) Co-IP assays determining the effects of miP1a/b on the self-interactions of PIF3 (E) and EIN3 (F). Full-length PIF3 or EIN3 was fused with Myc or Flag tag. Myc and Flag-tagged PIF3 (P3-Myc and P3-Flag) or EIN3 (E3-Myc and E3-Flag) proteins were coexpressed with pcDNA3.1-HA empty vector (−) or with pcDNA3.1-miP1a/b-HA (+) in HEK293T cells. Anti-Myc antibodies were used for immunoprecipitation. Anti-Myc and anti-Flag antibodies were used for immunoblots.
Fig. 4.
Fig. 4.
miP1a and miP1b disrupt the oligomerization of PIF3 and EIN3. (A and B) Chemical crosslinking assays show that PIF3 forms an oligomer in vivo, while miP1a (A) or miP1b (B) represses PIF3 oligomerization. Three-day-old etiolated seedlings were incubated with PFA for the indicated periods of time. Immunoblot analysis was performed using anti-Myc antibodies. (C) miP1a directly inhibits PIF3 oligomerization in vitro. PIF3-Myc protein mixed with or without miP1a-HA was treated with PFA for the indicated periods of time. Immunoblot analysis was performed using anti-Myc antibodies. (D) Chemical crosslinking assays show that EIN3 forms an oligomer in vivo, while miP1a represses EIN3 oligomerization. Three-day-old etiolated seedlings grown on 1/2 MS medium with 10 μM β-estradiol were incubated with PFA for the indicated periods of time. Immunoblot analysis was performed using anti-Myc antibodies. (E) miP1a/b directly inhibit EIN3 oligomerization in vitro. EIN3-Myc mixed with or without miP1a-HA (Top) or miP1b-HA (Bottom) was treated with PFA for the indicated periods of time. Immunoblot analysis was performed using anti-Myc antibodies.
Fig. 5.
Fig. 5.
miP1a and miP1b sequester PIF3 and EIN3 binding to their target genes. (A) Immunoblot analysis of PIF3-Myc and miP1b-HA protein abundance in 3-d-old etiolated seedlings. WT was used as a negative control and the RPN6 protein was utilized as a loading control. (B) ChIP-qPCR assay showing enrichment of the promoter fragments of PIL1, PIL2, and HLS1 bound by PIF3 in 3-d-old etiolated seedlings. Anti-Myc antibodies were used for precipitation. WT seedlings with anti-Myc antibodies were used as negative controls. Mean ± SD; n = 3. (C) Immunoblot analysis of EIN3-Myc, miP1a-HA, and miP1b-HA protein abundance. Seedlings were grown on 1/2 MS medium with 10 μM β-estradiol in the dark for 3 d. WT was used as a negative control and the RPN6 protein was utilized as a loading control. (D) ChIP-qPCR assay showing enrichment of the promoter fragments of ERF1, EBF2, and HLS1 bound by EIN3 in seedlings. Seedlings were grown on 1/2 MS medium with 10 μM β-estradiol in the dark for 3 d. Anti-Myc antibodies were used for precipitation. WT seedlings with anti-Myc antibodies were used as negative controls. Mean ± SD; n = 3.
Fig. 6.
Fig. 6.
miP1a and miP1b repress the transcriptional activity of PIF3 and EIN3. (A) Transient dual LUC reporter gene assays for assessing the transcriptional activity of PIF3 and EIN3 in N. benthamiana leaf cells. The leaves were transfected with the firefly luciferase (LUC) reporter PIL1p:LUC construct cotransformed with PIF3 + vector, PIF3 + miP1a, or PIF3 + miP1b (Left), or the leaves were transfected with the reporter ERF1p:LUC construct cotransformed with EIN3 + vector, EIN3 + miP1a, or EIN3 + miP1b (Right). LUC activity was normalized to renilla luciferase (35S:REN). Mean ± SD; n = 5. Empty vectors were used as negative controls (−). *P < 0.05, and **P < 0.01. Student’s t test. (B and C) RT-qPCR results showing the expression levels of the indicated genes in 3-d-old etiolated seedlings grown on 1/2 MS medium (B) or 1/2 MS medium with 10 μM β-estradiol (C). Mean ± SD; n = 3.
Fig. 7.
Fig. 7.
miP1a and miP1b predominantly suppress the function of PIF3 and EIN3 to promote photomorphogenic development. (A and B) Representative images of light-induced apical hook unfolding, cotyledon opening (A) and cotyledon expansion (B) of etiolated seedlings. Seedlings were grown in the dark for 3 d and then exposed to light for the indicated periods of time. (Scale bar: 1 mm.) (C) RT-qPCR results showing the gene expression levels of miP1a in 3-d-old etiolated seedlings. Mean ± SD; n = 3. (D) Immunoblots for endogenous EIN3 protein in 3-d-old etiolated seedlings. Anti-EIN3 and anti-RPN6 antibodies were used for immunoblots. ein3 eil1 was used as a negative control. RPN6 was used as a loading control. (E and F) Representative images of light-induced apical hook unfolding, cotyledon opening (E) and cotyledon expansion (F) of etiolated seedlings. Seedlings were grown in the dark for 3 d and then exposed to light for the indicated periods of time. (Scale bar: 1 mm.) (G) A proposed model depicting microprotein-directed disassembly of key transcription factor oligomers during the dark-to-light transition. In the dark, transcription factors (TF, PIFs, and EIN3/EIL1) assemble active tetramers, and subsequently associate with and regulate downstream genes to repress light responses. Upon light exposure, two microproteins, miP1a and miP1b, are robustly elevated. miP1a/b directly interact with target TFs, disrupt TF tetramers, and sequester their DNA binding capacity, promptly suppressing their function to initiate photomorphogenic development.

References

    1. Chen M., Chory J., Fankhauser C., Light signal transduction in higher plants. Annu. Rev. Genet. 38, 87–117 (2004). - PubMed
    1. Leivar P., Monte E., PIFs: Systems integrators in plant development. Plant Cell 26, 56–78 (2014). - PMC - PubMed
    1. de Wit M., Galvão V. C., Fankhauser C., Light-mediated hormonal regulation of plant growth and development. Annu. Rev. Plant Biol. 67, 513–537 (2016). - PubMed
    1. Wei N. et al. ., Arabidopsis COP8, COP10, and COP11 genes are involved in repression of photomorphogenic development in darkness. Plant Cell 6, 629–643 (1994). - PMC - PubMed
    1. Shi H. et al. ., Genome-wide regulation of light-controlled seedling morphogenesis by three families of transcription factors. Proc. Natl. Acad. Sci. U.S.A. 115, 6482–6487 (2018). - PMC - PubMed

Publication types

MeSH terms