Conservation of Cdc14 phosphatase specificity in plant fungal pathogens: implications for antifungal development
- PMID: 32694511
- PMCID: PMC7374715
- DOI: 10.1038/s41598-020-68921-3
Conservation of Cdc14 phosphatase specificity in plant fungal pathogens: implications for antifungal development
Abstract
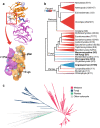
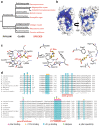
Cdc14 protein phosphatases play an important role in plant infection by several fungal pathogens. This and other properties of Cdc14 enzymes make them an intriguing target for development of new antifungal crop treatments. Active site architecture and substrate specificity of Cdc14 from the model fungus Saccharomyces cerevisiae (ScCdc14) are well-defined and unique among characterized phosphatases. Cdc14 appears absent from some model plants. However, the extent of conservation of Cdc14 sequence, structure, and specificity in fungal plant pathogens is unknown. We addressed this by performing a comprehensive phylogenetic analysis of the Cdc14 family and comparing the conservation of active site structure and specificity among a sampling of plant pathogen Cdc14 homologs. We show that Cdc14 was lost in the common ancestor of angiosperm plants but is ubiquitous in ascomycete and basidiomycete fungi. The unique substrate specificity of ScCdc14 was invariant in homologs from eight diverse species of dikarya, suggesting it is conserved across the lineage. A synthetic substrate mimetic inhibited diverse fungal Cdc14 homologs with similar low µM Ki values, but had little effect on related phosphatases. Our results justify future exploration of Cdc14 as a broad spectrum antifungal target for plant protection.
Conflict of interest statement
The authors declare no competing interests.
Figures


Similar articles
-
Cdc14 phosphatases use an intramolecular pseudosubstrate motif to stimulate and regulate catalysis.J Biol Chem. 2024 Sep;300(9):107644. doi: 10.1016/j.jbc.2024.107644. Epub 2024 Aug 8. J Biol Chem. 2024. PMID: 39122012 Free PMC article.
-
A Substrate Trapping Method for Identification of Direct Cdc14 Phosphatase Targets.Methods Mol Biol. 2017;1505:119-132. doi: 10.1007/978-1-4939-6502-1_10. Methods Mol Biol. 2017. PMID: 27826861
-
Kinetic and mechanistic studies of a cell cycle protein phosphatase Cdc14.J Biol Chem. 2004 Jul 16;279(29):30459-68. doi: 10.1074/jbc.M402217200. Epub 2004 May 5. J Biol Chem. 2004. PMID: 15128740
-
Cdc14: a highly conserved family of phosphatases with non-conserved functions?J Cell Sci. 2010 Sep 1;123(Pt 17):2867-76. doi: 10.1242/jcs.074815. J Cell Sci. 2010. PMID: 20720150 Review.
-
Getting in the ring: proline-directed substrate specificity in the cell cycle proteins Cdc14 and CDK2-cyclinA3.Cell Cycle. 2003 Nov-Dec;2(6):500-2. doi: 10.4161/cc.2.6.556. Cell Cycle. 2003. PMID: 14504459 Review. No abstract available.
Cited by
-
Development of Novel Phosphonodifluoromethyl-Containing Phosphotyrosine Mimetics and a First-In-Class, Potent, Selective, and Bioavailable Inhibitor of Human CDC14 Phosphatases.J Med Chem. 2024 Jun 13;67(11):8817-8835. doi: 10.1021/acs.jmedchem.4c00149. Epub 2024 May 20. J Med Chem. 2024. PMID: 38768084 Free PMC article.
-
The Anti-Fungal Activity of Nitropropenyl Benzodioxole (NPBD), a Redox-Thiol Oxidant and Tyrosine Phosphatase Inhibitor.Antibiotics (Basel). 2022 Sep 2;11(9):1188. doi: 10.3390/antibiotics11091188. Antibiotics (Basel). 2022. PMID: 36139967 Free PMC article.
-
Membrane Protein Bcest Is Involved in Hyphal Growth, Virulence and Stress Tolerance of Botrytis cinerea.Microorganisms. 2023 May 6;11(5):1225. doi: 10.3390/microorganisms11051225. Microorganisms. 2023. PMID: 37317199 Free PMC article.
-
Various Biomimetics, Including Peptides as Antifungals.Biomimetics (Basel). 2023 Oct 28;8(7):513. doi: 10.3390/biomimetics8070513. Biomimetics (Basel). 2023. PMID: 37999154 Free PMC article. Review.
-
Cdc14 phosphatase contributes to cell wall integrity and pathogenesis in Candida albicans.Front Microbiol. 2023 Feb 16;14:1129155. doi: 10.3389/fmicb.2023.1129155. eCollection 2023. Front Microbiol. 2023. PMID: 36876065 Free PMC article.
References
-
- Bebber DP, Gurr SJ. Crop-destroying fungal and oomycete pathogens challenge food security. Fungal Genet. Biol. 2015;74:62–64. - PubMed
-
- Lucas, J.A. Chapter one—fungi, food crops, and biosecurity: Advances and challenges. In Advances in Food Security and Sustainability (ed. Barling, D.) 1–40 (Elsevier, Amsterdam, 2017)
-
- Strange RN, Scott PR. Plant disease: A threat to global food security. Annu. Rev. Phytopathol. 2005;43:83–116. - PubMed
-
- Chakraborty S, Newton AC. Climate change, plant diseases and food security: An overview. Plant Pathol. 2011;60:2–14.
Publication types
MeSH terms
Substances
Grants and funding
LinkOut - more resources
Full Text Sources
Molecular Biology Databases

