. 2020 Jul 21;10(1):12031.
doi: 10.1038/s41598-020-68721-9.

Insulin signaling and glucose metabolism in different hepatoma cell lines deviate from hepatocyte physiology toward a convergent aberrant phenotype

Affiliations

Insulin signaling and glucose metabolism in different hepatoma cell lines deviate from hepatocyte physiology toward a convergent aberrant phenotype

Angela Molinaro et al. Sci Rep. .

Abstract

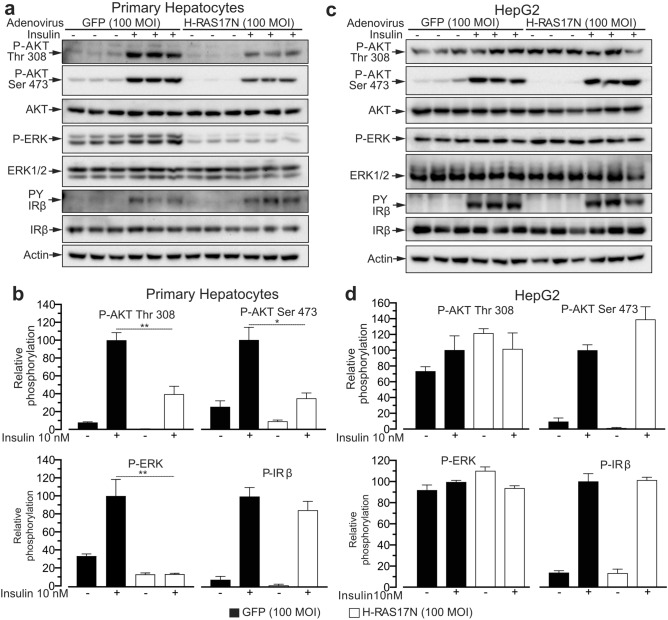
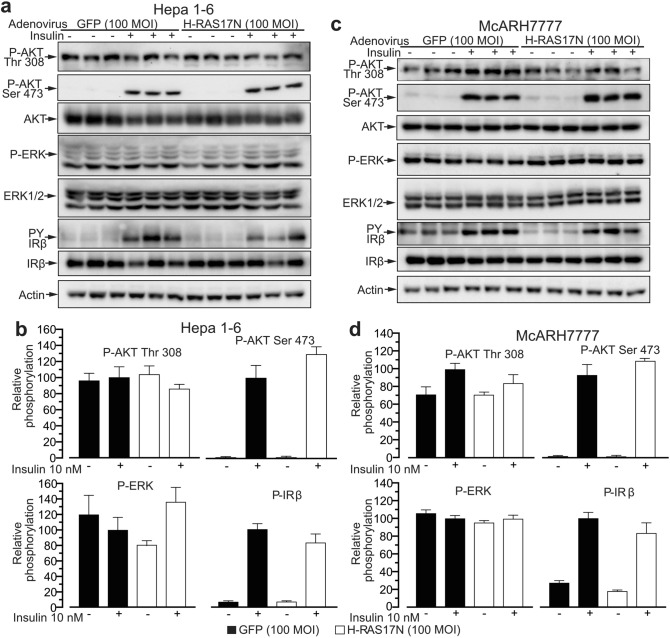
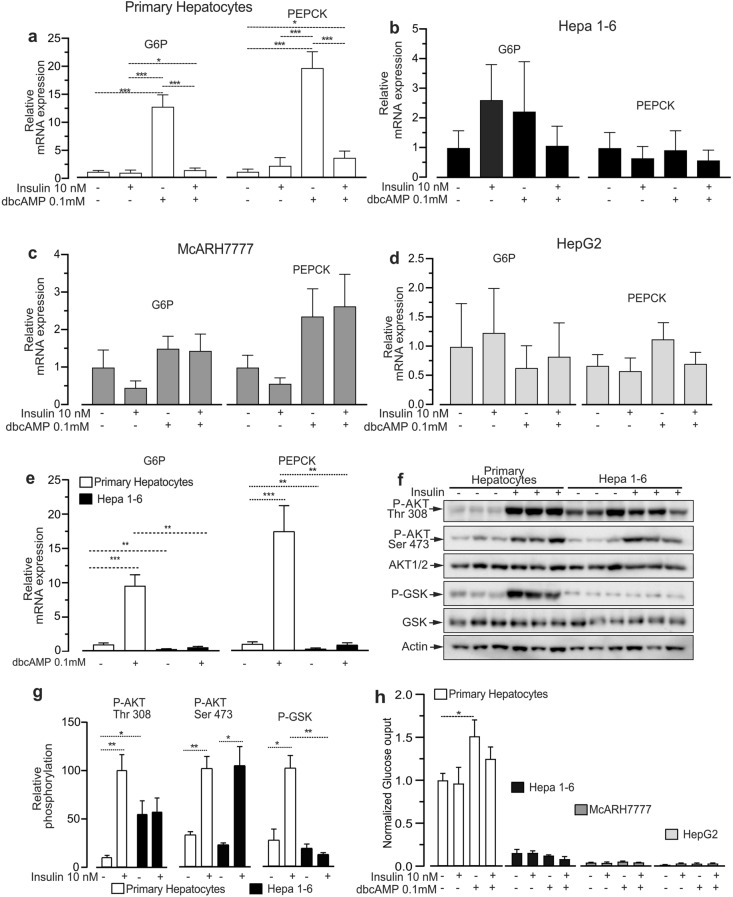
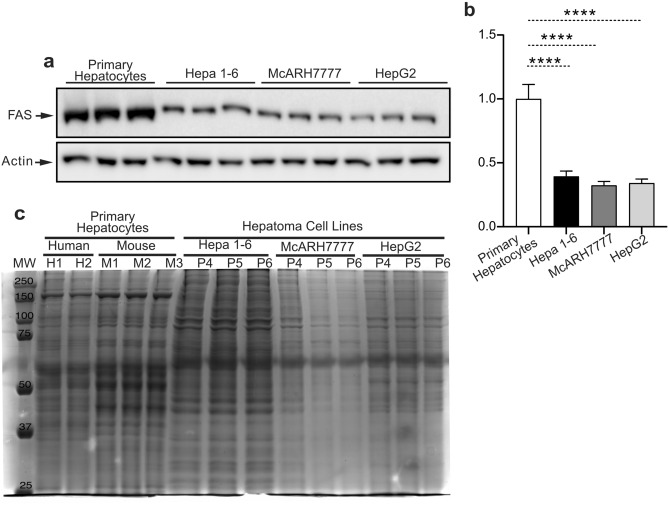
Hepatoma cell lines are widely used to model the hepatocyte for insulin signaling and fatty liver disease. However, a direct comparison of insulin action in primary hepatocytes and in hepatoma cell lines is needed to validate this model and to better understand liver cancer. Here we have investigated insulin signaling, gluconeogenic gene expression, glucose production, and fatty acid synthase abundance in primary hepatocytes and in HepG2, Hepa 1-6, and McARH7777 hepatoma cell lines. Differences in the electrophoretic profiles of protein extracts from human and mouse primary hepatocytes and the hepatoma cells lines are shown. Compared to primary hepatocytes, hepatoma cells showed high basal phosphorylation of AKT at Thr 308 and constitutively activated RAS-MAPK signaling, which were resistant to the dominant negative Ras mutant H-Ras17N. Hepatoma cell lines also showed defective expression of gluconeogenic enzymes, insulin unresponsive GSK phosphorylation, and marginal glucose production. Hepatoma cells also showed lower protein levels of fatty acid synthase and a largely distinct protein electrophoresis profile from hepatocytes but similar between different hepatoma lines. We conclude that hepatoma cell lines do not accurately model the hepatocyte for insulin action but may be valuable tools to investigate the proteomic changes conferring to hepatocellular carcinoma its peculiar metabolisms.


Conflict of interest statement

The authors declare no competing interests.

Figures

Figure 1
Figure 1
The HepG2 human hepatoma cell line displays aberrant insulin signaling compared to murine primary hepatocytes. (a) Immunoblot analysis of insulin signaling in primary mouse hepatocytes infected with a control adenovirus expressing the GFP or a virus expressing the negative dominant RAS mutant H-RAS17N and stimulated with 10 nM insulin for 8 min. (b) Quantification of blots in (a). (c) Immunoblot analysis of insulin signaling and insulin receptor phosphorylation performed as in (a) but using the HepG2 cell line. (d) Quantification of blots in (c). n = 3 biological replicates (mice) for primary hepatocytes and 3 independent experiments for HepG2. Data are represented as mean ± SEM.
Figure 2
Figure 2
Murine hepatoma cell line Hepa 1–6 and rat hepatoma cell line McARH7777 display aberrant insulin signaling. (a) Immunoblot analysis of insulin signaling in the Hepa 1–6 cells infected with 100 MOI of a control adenovirus expressing the GFP or a virus expressing the negative dominant RAS mutant H-RAS17N and stimulated with 10 nM insulin for 8 min. (b) Quantification of blots in (a). (c) Immunoblot analysis of insulin signaling and insulin receptor phosphorylation as in (a) was performed using the McARH7777 cell line. (d) Quantification of blots in (c). n = 3 independent experiments. Data are represented as mean ± SEM.
Figure 3
Figure 3
Hepatoma cell lines display severely impaired gluconeogenic gene expression and blunted glucose production. (a) qPCR analysis of mRNA levels of glucose 6 phosphatase (G6P) and phosphoenolpyruvate carboxykinase (PEPCK) in primary mouse hepatocytes exposed for 6 h to 100 µM of dbcAMP, or 10 nM insulin, or 100 µM dbcAMP and 10 nM insulin. (b) qPCR analysis of mRNA levels of G6P and PEPCK in Hepa 1–6 cells treated as in (a). (c) qPCR analysis of mRNA levels of G6P and PEPCK in McARH7777 cell line treated as in (a). (s) qPCR analysis of mRNA levels of G6P and PEPCK in HepG2 cells treated as in (a). (e) Direct comparison of basal and cAMP-induced G6P and PEPCK mRNA levels in primary mouse hepatocytes and mouse Hepa 1–6. (f) Immunoblot analysis of insulin-driven AKT Thr 308 phosphorylation, AKT Ser 473 phosphorylation and GSK3β phosphorylation in primary hepatocytes and Hepa 1–6 cells stimulated for 8 min with 10 nM insulin. (g) Quantification of blots in (f). (h) Relative glucose production in primary hepatocytes, Hepa 1–6, McARH7777, and HepG2 stimulated with 100 µM dbcAMP in presence or not of 10 nM insulin for 6 h. n = 8 for (a); n = 5 for (b); n = 8 for (c); n = 7 for (d); and (e) n = 8 for heaptocytes and n = 5 for Hepa 1–6 n = 3 for (f, g) n = 3; for (h) n = 5 hepatocytes and n = 4 for each hepatoma cell line. n indicates biological replicates for primary hepatocytes, and independent experiments for cell lines. Data are represented as mean ± SEM.
Figure 4
Figure 4
Hepatoma cell lines display reduced fatty acid synthase expression and a distinct protein electrophoresis pattern. (a) Immunoblot analysis of FAS on primary hepatocytes, Hepa 1–6, McARH7777, and HepG2. (b) Quantification of blots in (a). (c) Coomassie staining of a protein electrophoresis of extracts from human primary hepatocytes, murine primary hepatocytes, Hepa 1–6, McARH7777, and HepG2. n = 9 for a and b; n = 2–3 for c. n indicates biological replicates for primary hepatocytes, technical replicates for human hepatocytes, and independent experiments for cell lines. Data are represented as mean ± SEM.

References

    1. Zimmet PZ. Diabetes and its drivers: the largest epidemic in human history? Clin. Diabetes Endocrinol. 2017;3:1. doi: 10.1186/s40842-016-0039-3. - DOI - PMC - PubMed
    1. Estes C, et al. Modeling NAFLD disease burden in China, France, Germany, Italy, Japan, Spain, United Kingdom, and United States for the period 2016–2030. J. Hepatol. 2018;69:896–904. doi: 10.1016/j.jhep.2018.05.036. - DOI - PubMed
    1. Samuel VT, Shulman GI. Nonalcoholic fatty liver disease as a nexus of metabolic and hepatic diseases. Cell Metab. 2018;27:22–41. doi: 10.1016/j.cmet.2017.08.002. - DOI - PMC - PubMed
    1. Titchenell PM, Lazar MA, Birnbaum MJ. Unraveling the regulation of hepatic metabolism by insulin. Trends Endocrinol. Metab. 2017;28:497–505. doi: 10.1016/j.tem.2017.03.003. - DOI - PMC - PubMed
    1. Solinas G, Boren J, De Dulloo AG. novo lipogenesis in metabolic homeostasis: more friend than foe? Mol. Metab. 2015;4:367–377. doi: 10.1016/j.molmet.2015.03.004. - DOI - PMC - PubMed

Publication types