. 2020 Jul 21;11(1):3652.
doi: 10.1038/s41467-020-17433-9.

A global lipid map defines a network essential for Zika virus replication

Affiliations

A global lipid map defines a network essential for Zika virus replication

Hans C Leier et al. Nat Commun. .

Abstract

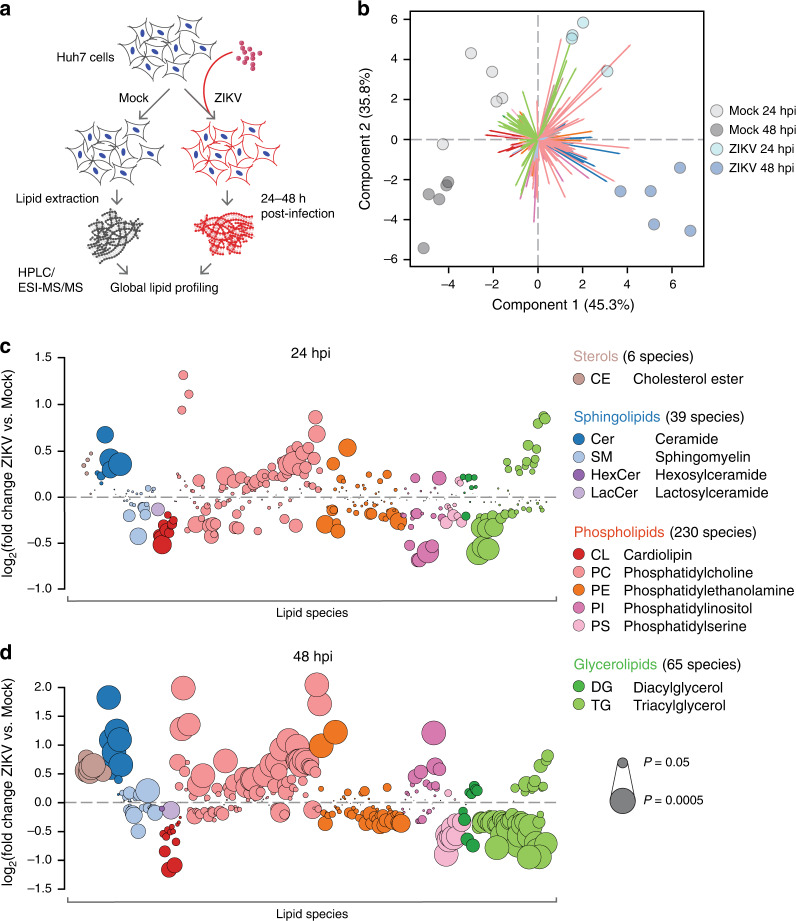
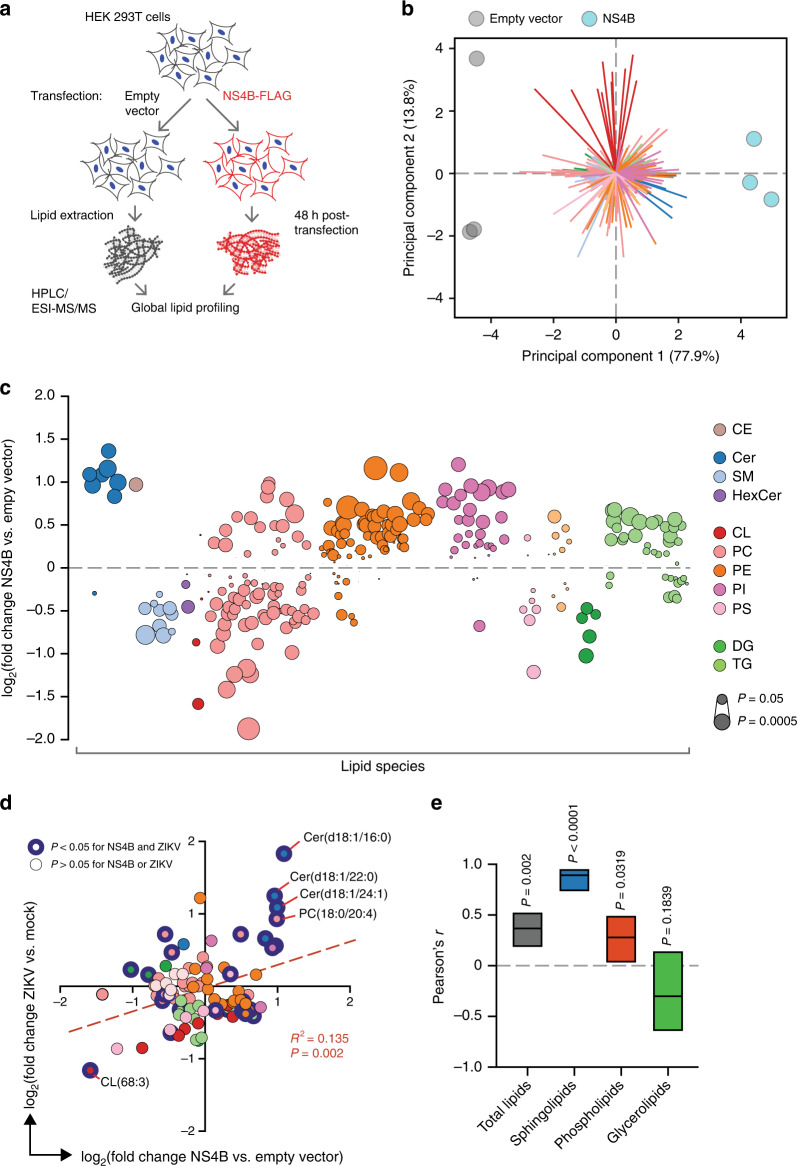
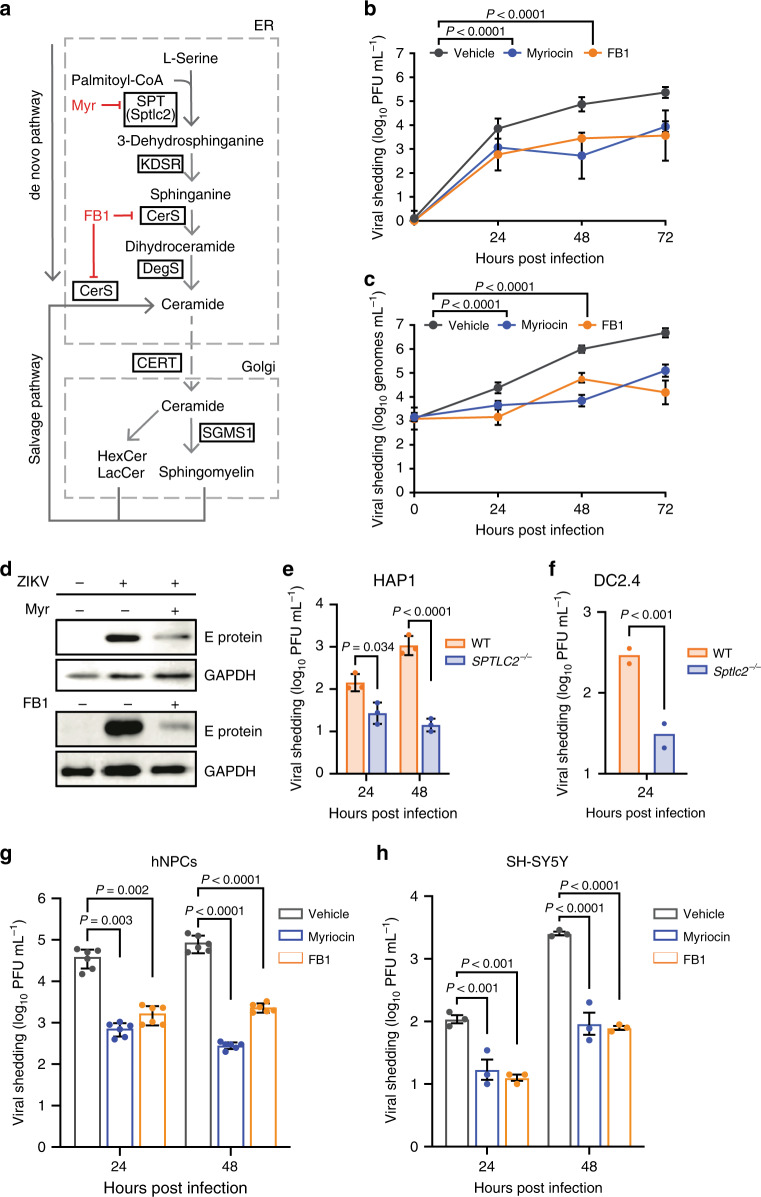
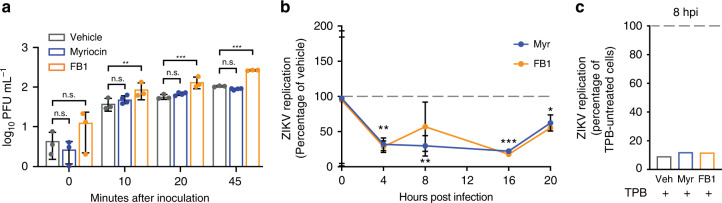
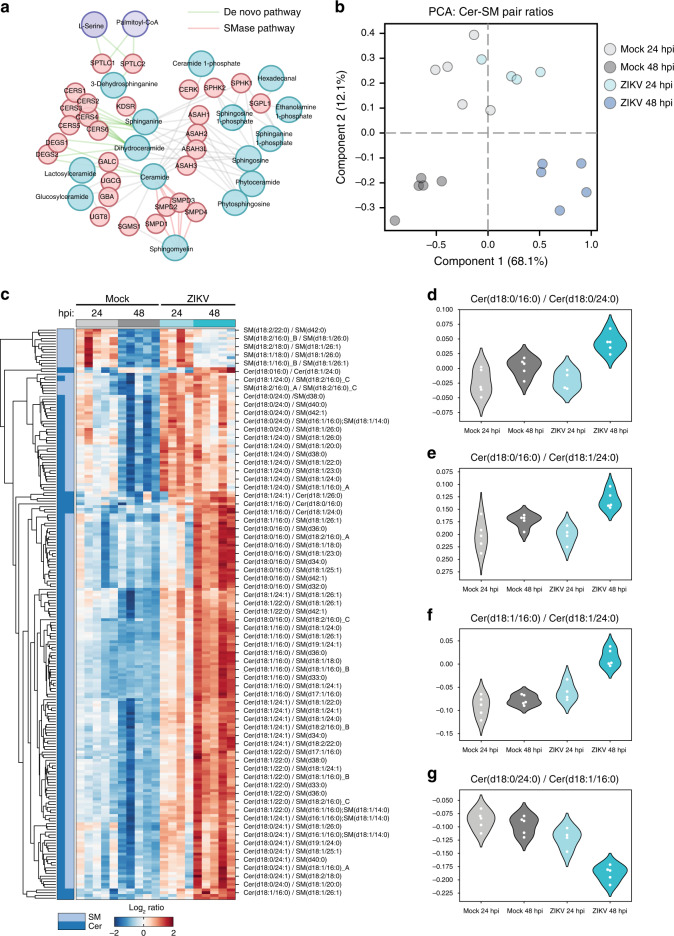
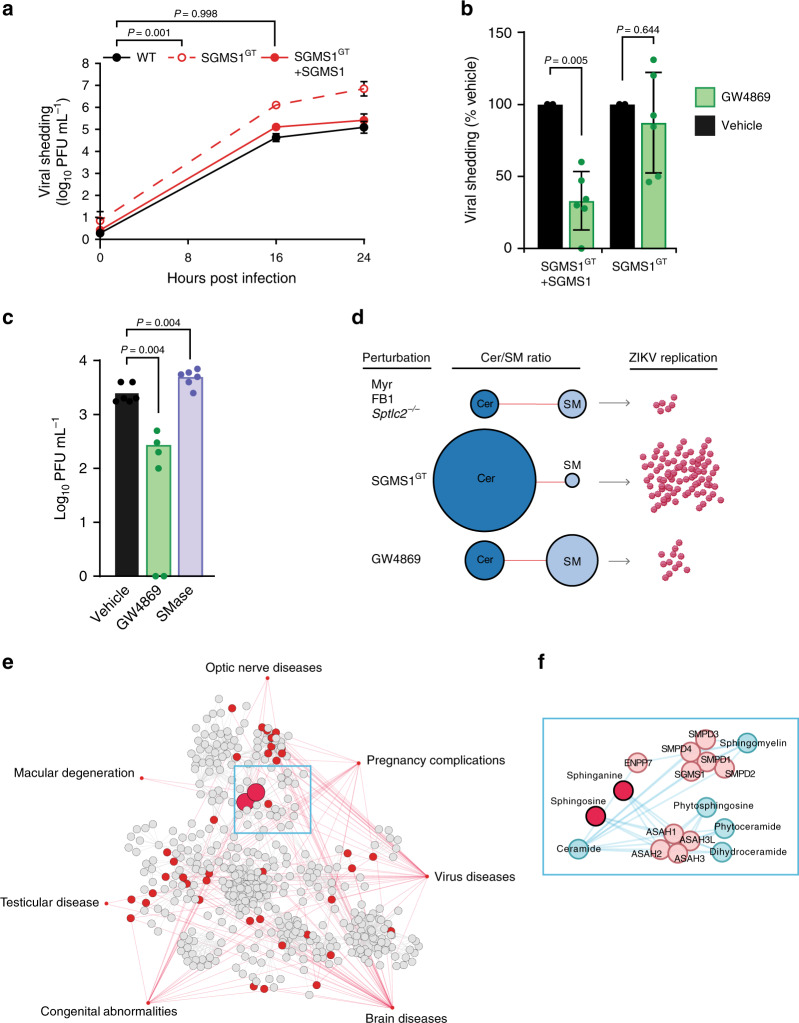
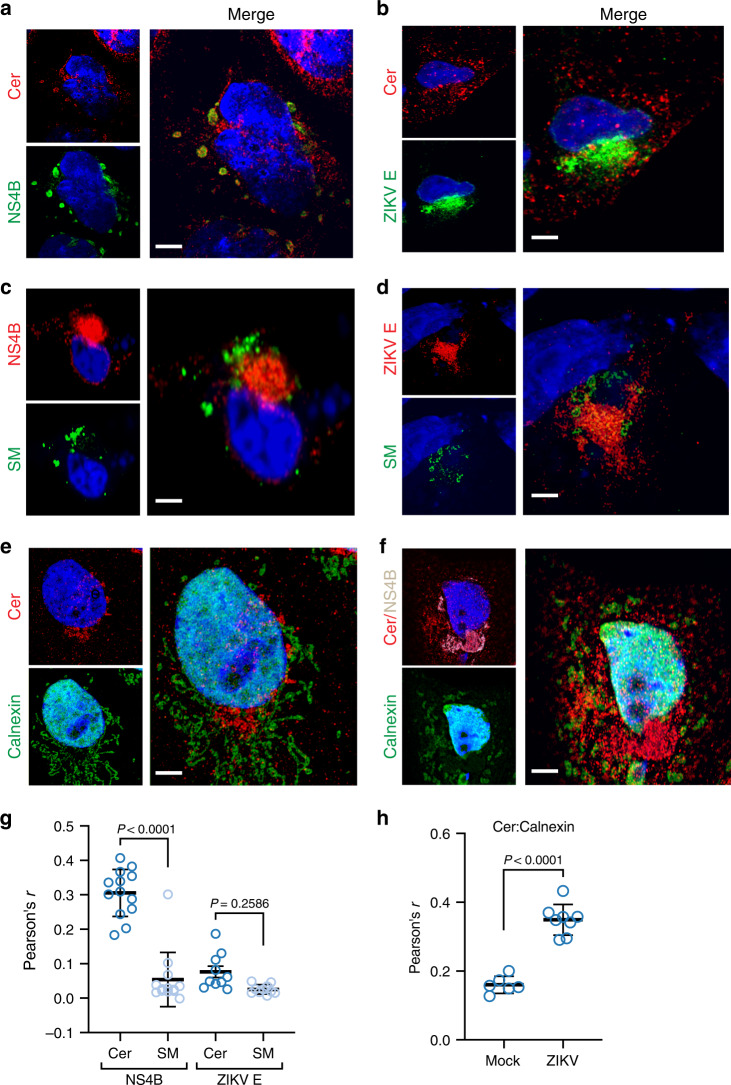
Zika virus (ZIKV), an arbovirus of global concern, remodels intracellular membranes to form replication sites. How ZIKV dysregulates lipid networks to allow this, and consequences for disease, is poorly understood. Here, we perform comprehensive lipidomics to create a lipid network map during ZIKV infection. We find that ZIKV significantly alters host lipid composition, with the most striking changes seen within subclasses of sphingolipids. Ectopic expression of ZIKV NS4B protein results in similar changes, demonstrating a role for NS4B in modulating sphingolipid pathways. Disruption of sphingolipid biosynthesis in various cell types, including human neural progenitor cells, blocks ZIKV infection. Additionally, the sphingolipid ceramide redistributes to ZIKV replication sites, and increasing ceramide levels by multiple pathways sensitizes cells to ZIKV infection. Thus, we identify a sphingolipid metabolic network with a critical role in ZIKV replication and show that ceramide flux is a key mediator of ZIKV infection.


Conflict of interest statement

The authors declare no competing interests.

Figures

Fig. 1
Fig. 1. Global lipidomics of ZIKV-infected human cells.
a Study overview. Huh7 cells were infected with ZIKV strain FSS13025 for 24 or 48 h. Each experimental condition (Mock 24 hpi, ZIKV 24 hpi, Mock 48 hpi, and ZIKV 48 hpi) had n = 5 replicates for a total of 20 biological samples, 19 of which were included in our final analysis. b Principal component analysis (PCA) of the lipidomics dataset. Colored arrows represent individual lipid species. c, d Bubble plots of log2 fold changes in abundance of lipid species in ZIKV-infected cells relative to mock at 24 hpi (c) and 48 hpi (d). Bubble size represents P value from one-way ANOVA or g test. See also Supplementary Fig. 1, Supplementary Data 1, and the Source Data file.
Fig. 2
Fig. 2. ZIKV NS4B dysregulates host lipid metabolism.
a Design of transfection experiment. Total lipids were extracted from HEK 293T cells transfected with NS4B or an empty vector control; n = 3 biological replicates per condition. b PCA of the lipidomics dataset. Colored arrows represent individual lipid species. c Bubble plots of log2 fold changes in abundance of lipid species in ZIKV-infected cells relative to mock at 24 hpi. Bubble size represents P value from one-way ANOVA or g test. d Correlation of log2 fold-change values of lipid species (n = 95) identified in both ZIKV-infection and NS4B-transfection experiments (see Supplementary Data 1 and 2, respectively). Linear regression best-fit line (y = 0.3212 × 0.02533), R2, and P values are shown. e Pearson’s correlation coefficient (r) for total or subclasses of lipid pairs. Lines and bars are r values with 95% CI, respectively. See also Supplementary Fig. 3, Supplementary Data 2, and the Source Data file.
Fig. 3
Fig. 3. Sphingolipids are essential for ZIKV infection.
a Overview of sphingolipid biosynthesis. SPT serine palmitoyltransferase, KDSR 3-ketodihydrosphingosine reductase, DegS delta 4-desaturase, sphingolipid, CerS ceramide synthase, SGMS1 sphingomyelin synthase 1, CERT ceramide transfer protein. b, c Huh7 cells treated with myriocin, FB1, or a vehicle control were infected with ZIKV (MOI = 0.1). At the indicated times post infection, culture supernatants were collected and analyzed by plaque assay (b) or RT-qPCR (c); n = 3 independent experiments. Two-way ANOVA with Dunnett’s multiple-comparison test. d Vero cells treated with myriocin, FB1, or vehicle were infected with ZIKV (MOI = 0.1). At 72 hpi, intracellular levels of ZIKV E protein were assessed by immunoblotting. Blot is representative of two independent experiments. e, f HAP1 human (e) and DC2.4 murine dendritic (f) WT and SPTLC2-knockout cells were infected with ZIKV (MOI = 0.1). At the indicated timepoints, culture supernatants were collected and analyzed by plaque assay; n = 3 independent experiments. Two-way ANOVA with Sidak’s multiple-comparison test (e) and two-tailed Student’s t test (f). g iPSC-derived human neural progenitor cells (hNPCs) treated with myriocin, FB1, or vehicle were infected with ZIKV (MOI = 0.1). At the indicated times post infection, culture supernatants were collected and analyzed by plaque assay; n = 6 independent infections. Two-way ANOVA with Tukey’s multiple- comparison test. h SH-5YSY human neuroblastoma cells were treated with inhibitors, infected with ZIKV (MOI = 0.1), and analyzed by plaque assay. Two-way ANOVA with Tukey’s multiple-comparison test. Data are mean ± SD. See also Supplementary Data 3, Supplementary Fig. 4, Supplementary Fig. 5, and the Source Data file.
Fig. 4
Fig. 4. Sphingolipids are required for ZIKV replication.
a Monolayers of Vero cells pretreated for 3 days with myriocin, FB1, or a vehicle control were incubated on ice for the indicated times with 100 PFUs before washing and overlay with media without the inhibitors. Plaques were counted after 3 days. Data are representative of four independent experiments. Two-way ANOVA with Tukey’s multiple-comparison test. b Huh7 cells pretreated for 3 days with myriocin, FB1, or a vehicle control were infected with ZIKV (MOI = 20). Intracellular ZIKV replication in myriocin or FB1-treated cells was measured at the timepoints shown and plotted relative to vehicle. n = 3 independent experiments. n = 4 independent experiments. c Huh7 cells treated with inhibitors as in (b) were pretreated for 24 h with the RNA polymerase inhibitor TPB, infected as before, then maintained in TPB and inhibitor/vehicle-treated media for 8 h. At 8 hpi, intracellular replication in TPB-treated cells was measured relative to non-TPB-treated cells for each condition. n = 2 independent experiments. Data are mean ± SD; n.s. not significant, *P < 0.05, **P < 0.01, ***P < 0.001, two-tailed Student’s t test. See also the Source Data file.
Fig. 5
Fig. 5. Targeted regulation of sphingolipid metabolism by ZIKV.
a Overview of the ceramide metabolism network. b Ratios of normalized lipid levels were calculated for all combinations of SM and Cer species in our dataset. Ratios that varied significantly across conditions (n = 382, P < 0.01, one-way ANOVA) were analyzed with recursive feature elimination with cross-validation, and the resulting high-interest Cer/SM pairs (n = 250) were analyzed with PCA. c Heatmap of clustered log2 SM/Cer ratios identified in (b). Each column represents a single biological sample. dg Log2 ratios from (b) that met the following criteria: PC length > 0.1, F score > 50, and P < 0.01. SM sphingomyelin, Cer ceramide. See also Supplementary Data 4 and the Source Data file.
Fig. 6
Fig. 6. Elevated ceramide levels increase ZIKV infection.
a KBM7 WT, SGMS1GT, and SGMS1GT + SGMS1 cells were infected with ZIKV (MOI = 1). At the indicated timepoints, culture supernatants were collected and titrated by plaque assay; n = 8 biological replicates. Two-way ANOVA with Dunnett’s multiple-comparison test. b KBM7 SGMS1GT and SGMS1GT + SGMS1 cells were infected with ZIKV (MOI = 1) and treated with 10 μM GW4869 or vehicle. At 24 hpi, supernatants were collected and analyzed by plaque assay; n = 6 independent infections. Two-tailed Student’s t test. c Huh7 cells were infected with ZIKV (MOI = 1) and treated with 10 μM GW4869 or recombinant neutral sphingomyelinase (SMase). At 24 hpi, culture supernatants were analyzed by plaque assay; n = 2 independent experiments. One-way ANOVA with Dunnett’s multiple-comparison test. d Model of experimental perturbations to the Cer/SM metabolic network and their effects on ZIKV replication. e Network of associations between disease modules similar to congenital ZIKV syndrome and lipid metabolism pathways. A metabolic network connecting the lipid subclasses identified by lipidomics was mapped to seven medical subject heading (MeSH) disease terms selected for their phenotypic similarity to clinical ZIKV syndrome. Nodes represent enzymes, lipids, and other metabolites in lipid biosynthesis, and gray lines represent reactions. Red nodes are metabolites associated with the MeSH ontologies linked by red lines. f Inset panel showing the metabolic neighborhood of the sphingolipids sphinganine and sphingosine. Data are mean ± SD. See also Supplementary Figs. 6–8, Supplementary Data 5, and the Source Data file.
Fig. 7
Fig. 7. Ceramide redistributes to ZIKV replication sites.
Huh7 cells were infected with ZIKV (MOI = 10). At 24 hpi, mock and infected cells were fixed, co-stained with the indicated antibodies, and visualized with Airyscan superresolution light microscopy. All images are representative of four independent experiments. a, b Cells were co-stained with antibodies against ceramide and ZIKV replication marker NS4B (a) or E protein (b). c, d Huh7 cells were transfected with SM-Eqt-GFP immediately following infection, then fixed, stained with antibodies against ceramide and NS4B (c) or E protein (d), and visualized as before. e, f Mock (e) and infected (f) cells were stained with antibodies against ceramide, NS4B, and the ER marker calnexin. g, h Pearson’s correlation coefficient was calculated for the indicated pairs of signals (n = 10 cells per condition pooled from four independent experiments; each dot represents r from a single field of view containing one or more cells). Thick central bar, mean; upper and lower bars, SD. Unpaired two-tailed Student’s t test. af Scale bar, 10 μm.

References

    1. Petersen LR, Jamieson DJ, Powers AM, Honein MA. Zika. Virus N. Engl. J. Med. 2016;374:1552–1563. - PubMed
    1. Miner JJ, Diamond MS. Zika virus pathogenesis and tissue tropism. Cell Host Microbe. 2017;21:134–142. - PMC - PubMed
    1. Scaturro P, et al. An orthogonal proteomic survey uncovers novel Zika virus host factors. Nature. 2018;561:253–257. - PubMed
    1. Zanini F, Pu SY, Bekerman E, Einav S, Quake SR. Single-cell transcriptional dynamics of flavivirus infection. Elife. 2018;7:e32942. - PMC - PubMed
    1. Aderem A, et al. A systems biology approach to infectious disease research: innovating the pathogen-host research paradigm. MBio. 2011;2:e00325–10. - PMC - PubMed

Publication types