. 2020 Jul 21;10(1):11286.
doi: 10.1038/s41598-020-67646-7.

A new island-scale tropical cyclone outlook for southwest Pacific nations and territories

Affiliations

A new island-scale tropical cyclone outlook for southwest Pacific nations and territories

Andrew D Magee et al. Sci Rep. .

Abstract

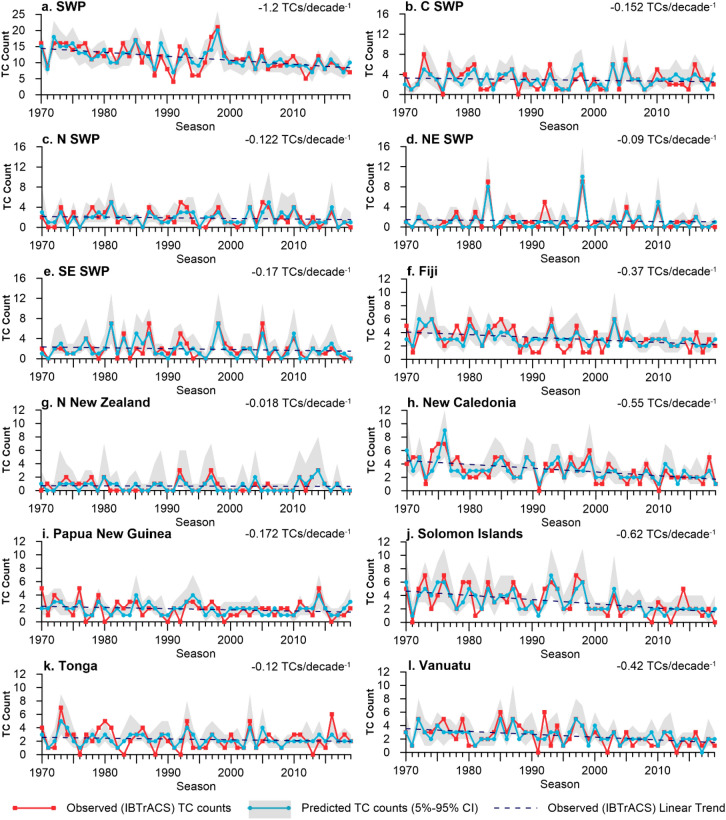
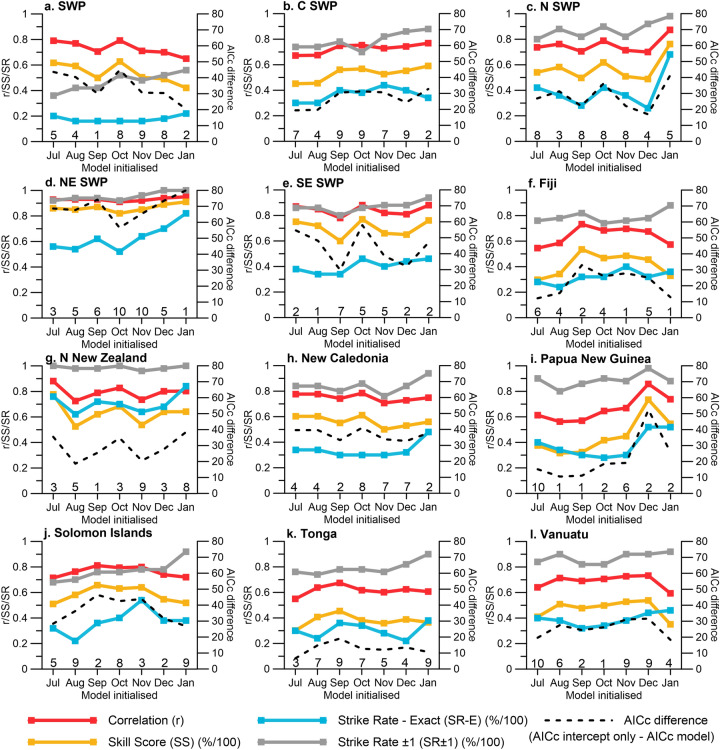
The southwest Pacific (SWP) region is vulnerable to tropical cyclone (TC) related impacts which adversely affect people, infrastructure and economies across several nations and territories. Skilful TC outlooks are needed for this region, but the erratic nature of SWP TCs and the complex ocean-atmosphere interactions that influence TC behaviour on seasonal timescales presents significant challenges. Here, we present a new TC outlook tool for the SWP using multivariate Poisson regression with indices of multiple climate modes. This approach provides skilful, island-scale TC count outlooks from July (four months ahead of the official TC season start in November). Monthly island-scale TC frequency outlooks are generated between July and December, enabling continuous refinement of predicted TC counts before and during a TC season. Use of this approach in conjunction with other seasonal climate guidance (including dynamical models) has implications for preparations ahead of severe weather events, resilience and risk reduction.


Conflict of interest statement

The authors declare no competing interests.

Figures

Figure 1
Figure 1
Panel a: Exclusive Economic Zones (EEZ) considered in this study with the shading seasonal TC climatology (Nov–Apr) between 1970 and 2019. Contours represent seasonal (Nov–Apr) TC track density between 1970 and 2019 (0.5 TCs/season intervals). Panel b: Location of 12 regional, sub-regional and island scale models (including entire SWP region: 0°–35°S, 135°E–120­W). Where individual EEZ climatology was < 1.5 TCs per season, surrounding EEZs were merged to form the following sub-regions: Northern SWP (N SWP; Tuvalu, Wallis & Futuna and Tokelau), Central SWP (C SWP; Samoa, American Samoa and Niue), Northeast SWP (NE SWP; Northern Cook Islands, E.Kiribati: Line Islands, Marquesas, Tuamotu Archipelago, Gambier Islands and Pitcairn Islands), and Southeast SWP (SE SWP; Southern Cook Islands, Society Islands and Austral Islands). Island-scale models were derived for the following: Papua New Guinea, Solomon Islands, Vanuatu, New Caledonia, Fiji, Tonga and Northern New Zealand. Models for W.Kiribati: Gilbert Islands and C.Kiribati: Phoenix Islands have not been derived or included as part of a larger sub-region as these locations have a low seasonal TC climatology (≤ 0.06 TCs) and are at minimal risk of TC activity. Figure created using a basemap from Natural Earth (www.naturalearthdata.com) and EEZ boundaries from.
Figure 2
Figure 2
Evaluation of predictor model skill for outlooks initialised in October for the November–April TC season (see Table 1 for predictor model summary). Dots indicate models with superior model performance based on highest SS.
Figure 3
Figure 3
Comparison of observed (IBTrACS) TC counts and predicted TC counts for outlooks initialised in October for the following November–April TC season. 5–95% confidence intervals (CI) for predicted TC counts are shown in grey. Dashed line represents linear trend of observed (IBTrACS) TC counts.
Figure 4
Figure 4
Model overestimate (O) and underestimate (U) time series for TC models initiated in October according to El Niño, La Niña and Neutral Phases (NINO3.4 Nov–Apr anomalies (1981–2010 climatology); >  + 0.5° = El Niño, < 0.5 °C = La Niña, ENSO neutral between + 0.5 °C and − 0.5 °C. O (U) indicates model has overestimated (underestimated) TC counts compared to IBTrACS observations. Exact strike rate (SR-E) is the % of time where predicted TCs and observed TCs match between 1970 and 2019. Statistics (%) for SR-E, O and U are also summarised on each panel.
Figure 5
Figure 5
Model performance according to month of model initialisation. Models initialised in July–October predict the entire SWP TC season (November–April). In-season outlooks initialised in November, December and January, predict TCs for the remaining TC season; December–April, January–April and February–April, respectively. Numbers above x-axis indicate chosen predictor model due to superior model performance (see Table 1 for predictor model summary). See Tables S1 and S2 (supplementary material) for more information regarding model performance according to month of model initialisation.
Figure 6
Figure 6
Indo-Pacific climate indices (model covariates) considered in this analysis. Indices representing El Niño-Southern Oscillation (ENSO) include: NINO1 + 2, NINO3, NINO4, NINO3.4, Southern Oscillation Index (SOI), ENSO Modoki Index (EMI), Coupled ENSO Index (CEI), Oceanic Nino Index (ONI), Trans NINO Index (TNI) and ENSO Longitude Index (ELI). Other indices considered include the Southern Annular Mode (SAM), Indian Ocean Dipole West pole (IOD W), Indian Ocean Dipole East pole (IOD E), and the Dipole Mode Index (DMI). Ten predictor model combinations used in analysis are summarised to the right of the panel and in Table 1. Monthly averaged lags (lag 1–6) are generated for each outlook initiation period. Basemap from Natural Earth (www.naturalearthdata.com).

References

    1. Bettencourt, S. et al. Not If But When: Adapting to Natural Hazards in the Pacific Islands Region - A Policy Note (English) (World Bank, Washington, DC, 2006). http://documents.worldbank.org/curated/en/840931468086057665/Not-if-but-....
    1. Terry JP, McGree S, Raj R. The exceptional flooding on Vanua Levu Island, Fiji, during Tropical Cyclone Ami in January 2003. J. Nat. Disaster Sci. 2004;26:27–36.
    1. McInnes, K. L., Grady, J. G. O., Walsh, K. J. E. & Colberg, F. Progress towards quantifying storm surge risk in Fiji due to climate variability and change. J. Coast. Res. Special Issue 64: Proceedings of the 11th international coastal symposium ICS2011, 1121–1124 (2011).
    1. Brown P, Daigneault A, Gawith D. Climate change and the economic impacts of flooding on Fiji. Clim. Dev. 2016;5529:1–12.
    1. Barnett J. Adapting to climate change in Pacific Island countries: the problem of uncertainty. World Dev. 2001;29:977–993.