. 2020 Jul 21;10(1):12055.
doi: 10.1038/s41598-020-68881-8.

Genetic architecture of complex traits and disease risk predictors

Affiliations

Genetic architecture of complex traits and disease risk predictors

Soke Yuen Yong et al. Sci Rep. .

Abstract

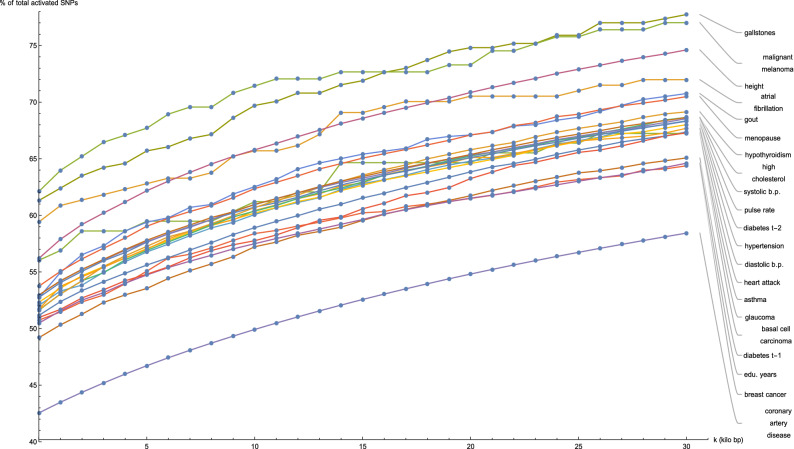
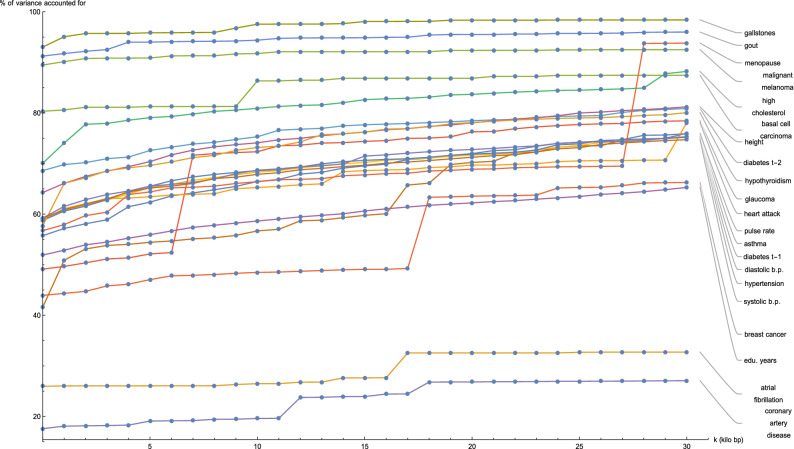
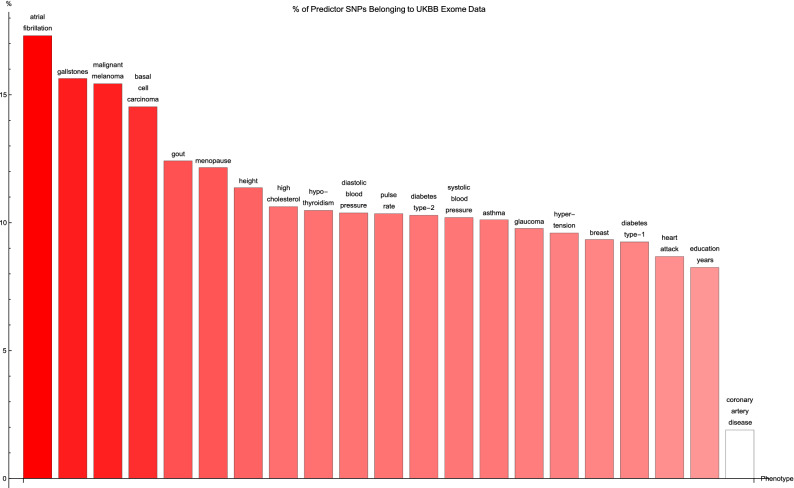
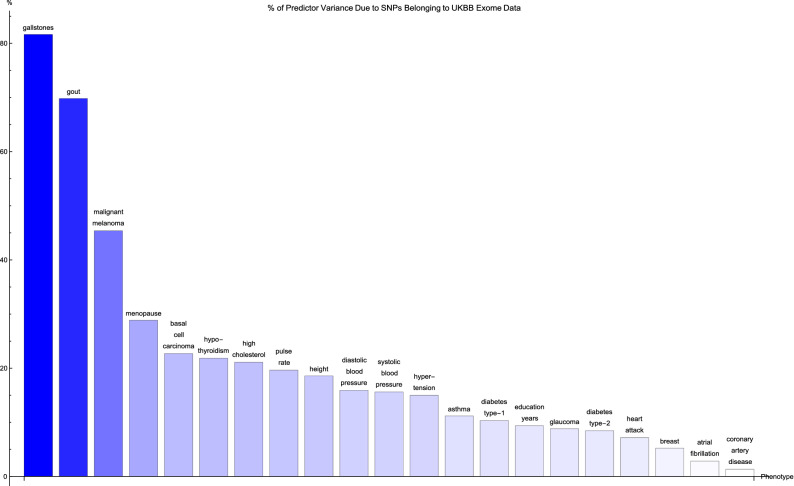
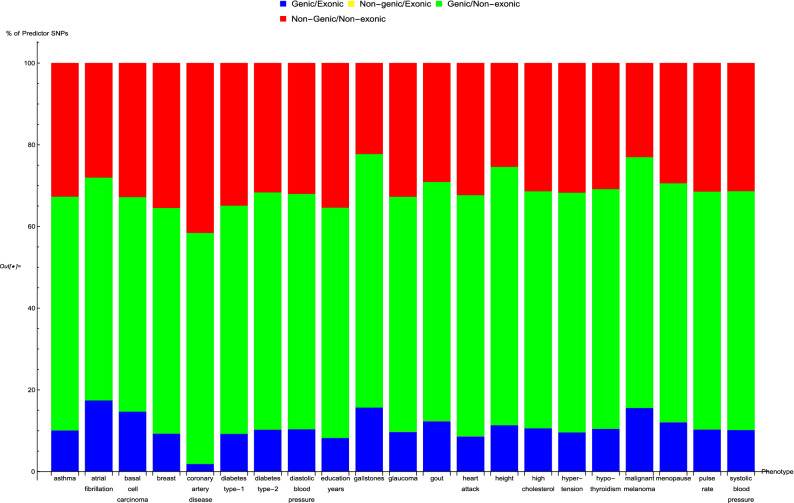
Genomic prediction of complex human traits (e.g., height, cognitive ability, bone density) and disease risks (e.g., breast cancer, diabetes, heart disease, atrial fibrillation) has advanced considerably in recent years. Using data from the UK Biobank, predictors have been constructed using penalized algorithms that favor sparsity: i.e., which use as few genetic variants as possible. We analyze the specific genetic variants (SNPs) utilized in these predictors, which can vary from dozens to as many as thirty thousand. We find that the fraction of SNPs in or near genic regions varies widely by phenotype. For the majority of disease conditions studied, a large amount of the variance is accounted for by SNPs outside of coding regions. The state of these SNPs cannot be determined from exome-sequencing data. This suggests that exome data alone will miss much of the heritability for these traits-i.e., existing PRS cannot be computed from exome data alone. We also study the fraction of SNPs and of variance that is in common between pairs of predictors. The DNA regions used in disease risk predictors so far constructed seem to be largely disjoint (with a few interesting exceptions), suggesting that individual genetic disease risks are largely uncorrelated. It seems possible in theory for an individual to be a low-risk outlier in all conditions simultaneously.


Conflict of interest statement

Stephen Hsu is a shareholder and serves on the board of directors of Genomic Prediction, Inc.. Louis Lello joined the company, becoming an employee and shareholder, during the writing and submission of this paper. Soke Yuen Yong and Timothy Raben declare no competing interests.

Figures

Figure 1
Figure 1
Plots of the number of predictor SNPs located within genic regions, expressed as a percentage of the total number of predictor SNPs for that disease condition, against expansion of GENCODE Release 19 gene boundaries by k kilo base pairs.
Figure 2
Figure 2
Plots of the variance accounted for by predictor SNPs located within genic regions, expressed as a percentage of the total variance accounted for by all predictor SNPs for that disease condition, against expansion of GENCODE Release 19 gene boundaries by k kilo base pairs.
Figure 3
Figure 3
The percentage of predictor SNPs which are found both in genic regions and the UK Biobank exome data, for each disease condition. The disease conditions are listed from left to right on the horizontal axis in order of decreasing percentage. Each vertical bar is colored red with a depth of shade proportional to the height of the bar. Here, “genic” SNPs are contained within the GENCODE Release 19 gene boundaries plus 30 kilo base pairs at both ends.
Figure 4
Figure 4
The variance accounted for by predictor SNPs which are both in genic regions and detected by the UK Biobank exome data, as a percentage of the total variance accounted for by all predictor SNPs, for each disease condition. The disease conditions are listed from left to right on the horizontal axis in order of decreasing percentage. Each vertical bar is colored blue with a depth of shade proportional to the height of the bar. Here, “genic” SNPs are contained within the GENCODE Release 19 gene boundaries plus 30 kilo base pairs at both ends.
Figure 5
Figure 5
The breakdown of the percentage of predictor SNPs according to whether their location is genic and whether the exome data serves to probe them, for each predictor. The bar sections representing predictor SNPs in genic regions and in the exome data are labelled ‘Genic/Exonic’ and colored blue, those representing predictor SNPs not in genic regions but present in the exome data are ‘Non-genic/Exonic’ and colored yellow, those representing predictor SNPs which are located in genic regions but not found in the exome data are ‘Genic/Non-exonic’ and colored green, and those representing predictor SNPs neither in genic regions nor in the exome data are ‘Non-genic/Non-exonic’ and colored red. As expected, the yellow ‘Non-genic/Exonic’ bar sections are too small to be discernible. Here, “genic” SNPs are contained within the GENCODE Release 19 gene boundaries plus 30 kilo base pairs at both ends.

References

    1. Vattikuti S, Lee JJ, Chang CC, Hsu SD, Chow CC. Applying compressed sensing to genome-wide association studies. GigaScience. 2014;3:10. - PMC - PubMed
    1. Ho CM, Hsu SD. Determination of nonlinear genetic architecture using compressed sensing. GigaScience. 2015;4:44. - PMC - PubMed
    1. Yang J, Lee SH, Goddard ME, Visscher PM. GCTA: a tool for genome-wide complex trait analysis. Am. J. Hum. Genet. 2011;88:76–82. - PMC - PubMed
    1. Vilhjálmsson BJ, et al. Modeling linkage disequilibrium increases accuracy of polygenic risk scores. Am. J. Hum. Genet. 2015;97:576–592. - PMC - PubMed
    1. Lello L, Raben TG, Yong SY, Tellier LC, Hsu SDH. Genomic prediction of 16 complex disease risks including heart attack, diabetes, breast and prostate cancer. Sci. Rep. 2019;9:2019. - PMC - PubMed

Publication types