. 2020 Jul 21;10(1):12096.
doi: 10.1038/s41598-020-68994-0.

Gold nanoparticle mediated radiation response among key cell components of the tumour microenvironment for the advancement of cancer nanotechnology

Affiliations

Gold nanoparticle mediated radiation response among key cell components of the tumour microenvironment for the advancement of cancer nanotechnology

Kyle Bromma et al. Sci Rep. .

Abstract

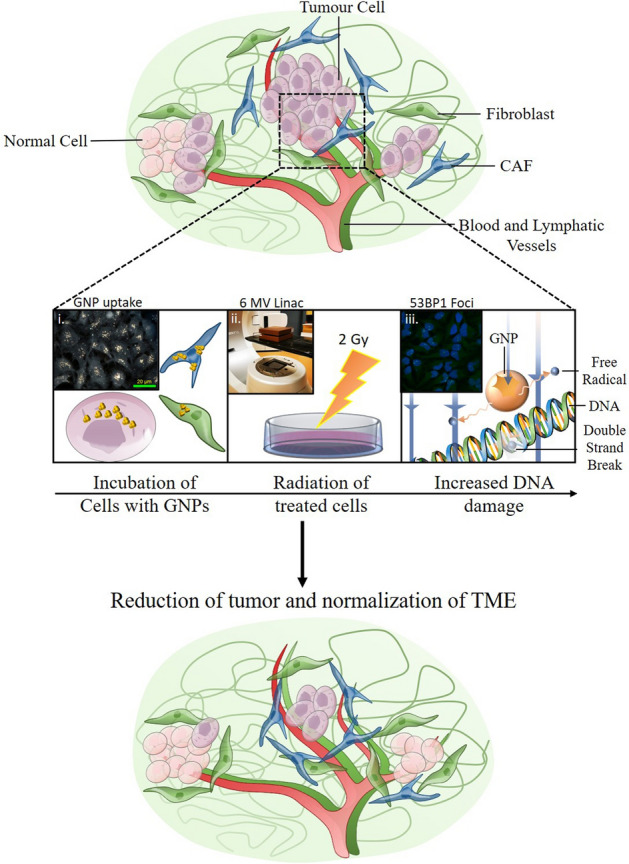
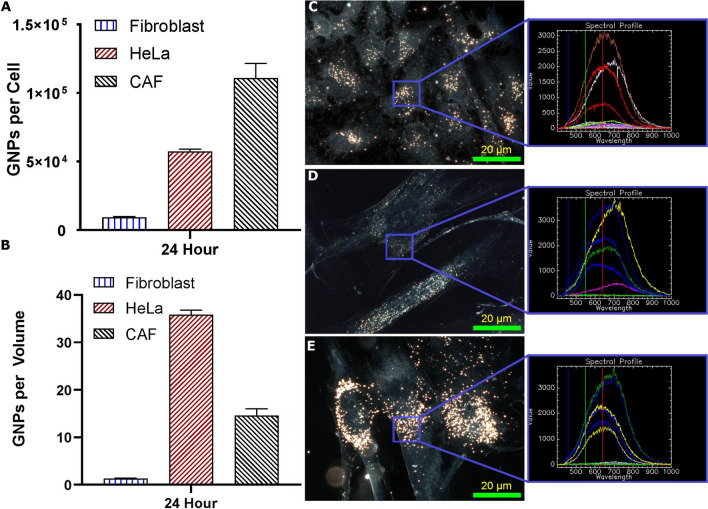
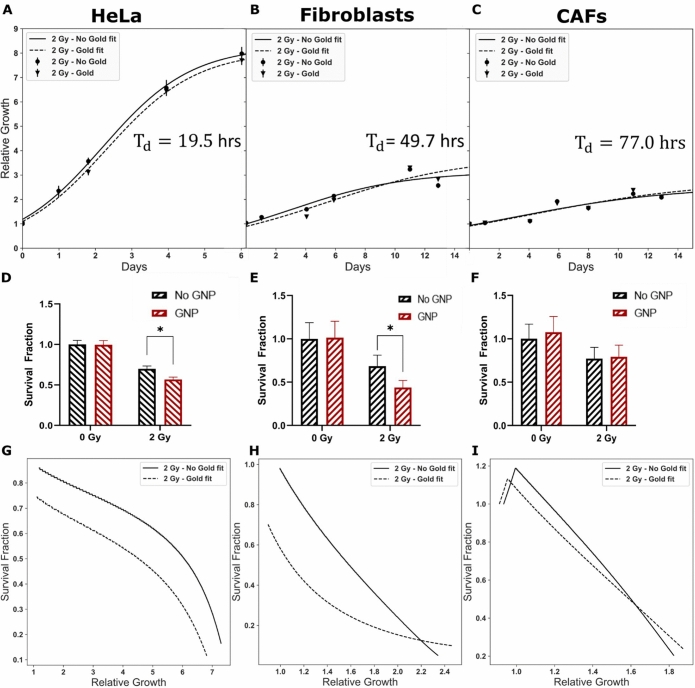
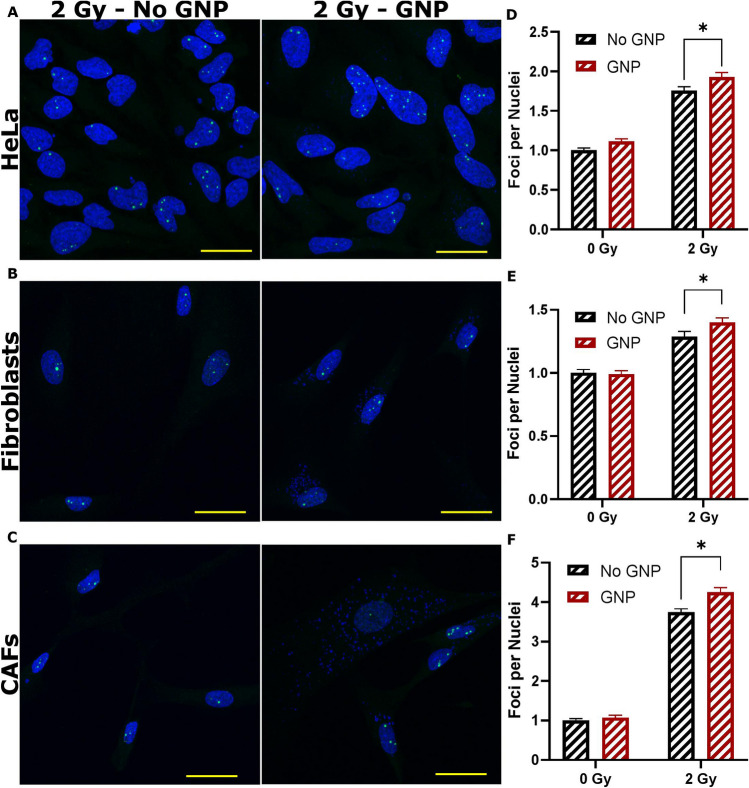
One of the major issues in cancer radiotherapy (RT) is normal tissue toxicity. Introduction of radiosensitizers like gold nanoparticles (GNPs) into cancer cells to enhance the local RT dose has been tested successfully. However, it is not known how GNPs interact with other stromal cells such as normal fibroblasts (FBs) and cancer associated fibroblasts (CAFs) within the tumour microenvironment. It is known that FBs turn into CAFs to promote tumour growth. Hence, we used FBs and CAFs along with HeLa (our cancer cell line) to evaluate the differences in GNP uptake and resulting radiation induced damage to elucidate the GNP-mediated therapeutic effect in RT. The CAFs had the largest uptake of the GNPs per cell, with on average 265% relative to HeLa while FBs had only 7.55% the uptake of HeLa and 2.87% the uptake of CAFs. This translated to increases in 53BP1-related DNA damage foci in CAFs (13.5%) and HeLa (9.8%) compared to FBs (8.8%) with RT treatment. This difference in DNA damage due to selective targeting of cancer associated cells over normal cells may allow GNPs to be an effective tool in future cancer RT to battle normal tissue toxicity while improving local RT dose to the tumour.


Conflict of interest statement

The authors declare no competing interests.

Figures

Figure 1
Figure 1
Normal and cancer associated fibroblasts in cancer therapeutics. (A) In normal tissue, FBs have anti-tumourigenic properties that supress proliferation of the tumour. However, when CAFs are introduced, a largely pro-tumourigenic influence is now exerted on the tumour microenvironment, leading to growth and eventual metastasis. (B) (i) Cells uptake GNPs at differing rates, which is directly related to the efficacy of the treatment. (ii) Cells are irradiated with a 2 Gy dose using a 6 MV linac. (iii) GNPs have been shown to have a radiosensitization effect on cancer cells, through improved formation of free radicals. (C) Upon treatment with the dual combination of GNPs and radiation, the TME is more normalized and there is a reduction in tumour growth as well as invasive and migratory behaviour.
Figure 2
Figure 2
Characterization of gold nanoparticles (A) Schematic diagram of the GNP and all the ligands used to form the GNPPEG-RGD complex. (B) Secondary electron TEM images of GNPPEG-RGD complex. (C) Darkfield image of GNPs overlayed with spectrum measured using hyper spectral imaging. The GNPs have a clear spectrum relative to background. (D) Hydrodynamic diameter from DLS and (E) ζ-potential of the GNPs before and after conjugation with PEG and RGD.
Figure 3
Figure 3
Uptake and retention of gold nanoparticles. (A, B) Quantification of uptake of 0.2 nM GNPs into all three cell lines as measured using ICP-MS. Error bars are standard deviations from triplicate measurements. (A) is GNP per cell, while (B) is normalized to the average volume of each cell line. (CE) Darkfield images of the GNPs encapsulated in the three cell lines with HeLa on top, FBs in the middle, and CAFs on the bottom. Overlay: the spectrum from HSI is matched in each sample to that of GNPs previously measured. Images taken after 24 h of GNP exposure. Experiments were repeated three times and the data presented is the average. The error bars represent standard deviation. Scale bar = 20 µm.
Figure 4
Figure 4
Z-stack using confocal imaging of three cell lines. (AC) Confocal images of distribution of GNPs (marked in red) and microtubules (marked in green) in Hela, FBs, and CAFs throughout a z-stack of the cells 24 h after treatment. (A) HeLa cells proliferate quickly, thus many of the cells do not have the microtubule viral stain. GNPs tend to be bundled close to the nuclei. (B) FBs are much larger cells compared to HeLa and have relatively low GNP content. (C) CAFs are comparatively similar in size to FBs, but qualitatively have much larger uptake, gathered around the nuclei and throughout the cell. Scale bar = 20 µm. Top left corner is depth in cell for each slice.
Figure 5
Figure 5
Proliferation assay. (AC) Reparametrized logistic curve fit (line) using non-linear least square to collected data (points). (DF) Survival fraction estimated from delay in growth curve after one doubling time. * represents a significant difference as explained in “Materials and methods” section. (GI) The change in calculated survival fraction as a function of relative growth. A crossover indicates return to control growth. (A, D) HeLa doubling time is estimated from the control curve (Td=19.5 h), where the SF was calculated from a delay time estimated at a relative growth of 2.25. (B, E) FBs (Td=49.7h) had a delay time estimated from a relative growth of 1.65, from which the SF was calculated. (D, F) CAFs (Td=77.0h) SF was calculated from a delay time estimated from a relative growth of 1.36. Experiments were repeated three times and the data presented is the average. The error bars represent standard deviation.
Figure 6
Figure 6
Immunofluorescence assay using 53BP1 foci. (A-C) Image panels of the three cell lines with 0 Gy and 2 Gy doses, and with or without GNPs. The nuclei are marked in blue while 53BP1 are marked in green. The green dots present in the nuclei are the foci, while the excess staining seen outside the nuclei is a non-specific fluorescence signal. (D-F) Quantitative data of the number of foci per nuclei, gathered from a minimum 50 cells. * represents a significant difference as described in “Materials and methods” section. Further images are available in Supplement S6A–C. Experiments were repeated three times and the data presented is the average. The error bars represent standard error. Scale bar = 20 µm.

References

    1. Ruddon RW. Cancer Biology. Oxford: Oxford University; 2007.
    1. Bray F, et al. Global cancer statistics 2018: GLOBOCAN estimates of incidence and mortality worldwide for 36 cancers in 185 countries. CA Cancer J. Clin. 2018;68:394–424. doi: 10.3322/caac.21492. - DOI - PubMed
    1. Joiner MK, Van der A. Basic Clinical Radiobiology. Boca Raton: CRC Press; 2018.
    1. Kim JH, Jenrow KA, Brown SL. Mechanisms of radiation-induced normal tissue toxicity and implications for future clinical trials. Radiat. Oncol. J. 2014;32:103–115. doi: 10.3857/roj.2014.32.3.103. - DOI - PMC - PubMed
    1. Liauw SL, Connell PP, Weichselbaum RR. New paradigms and future challenges in radiation oncology: An update of biological targets and technology. Sci. Transl. Med. 2013;5:173sr172. doi: 10.1126/scitranslmed.3005148. - DOI - PMC - PubMed

Publication types

MeSH terms