. 2020 Jul 21;10(1):12049.
doi: 10.1038/s41598-020-67956-w.

Identification of a unique temporal signature in blood and BAL associated with IPF progression

Affiliations

Identification of a unique temporal signature in blood and BAL associated with IPF progression

Katy C Norman et al. Sci Rep. .

Abstract

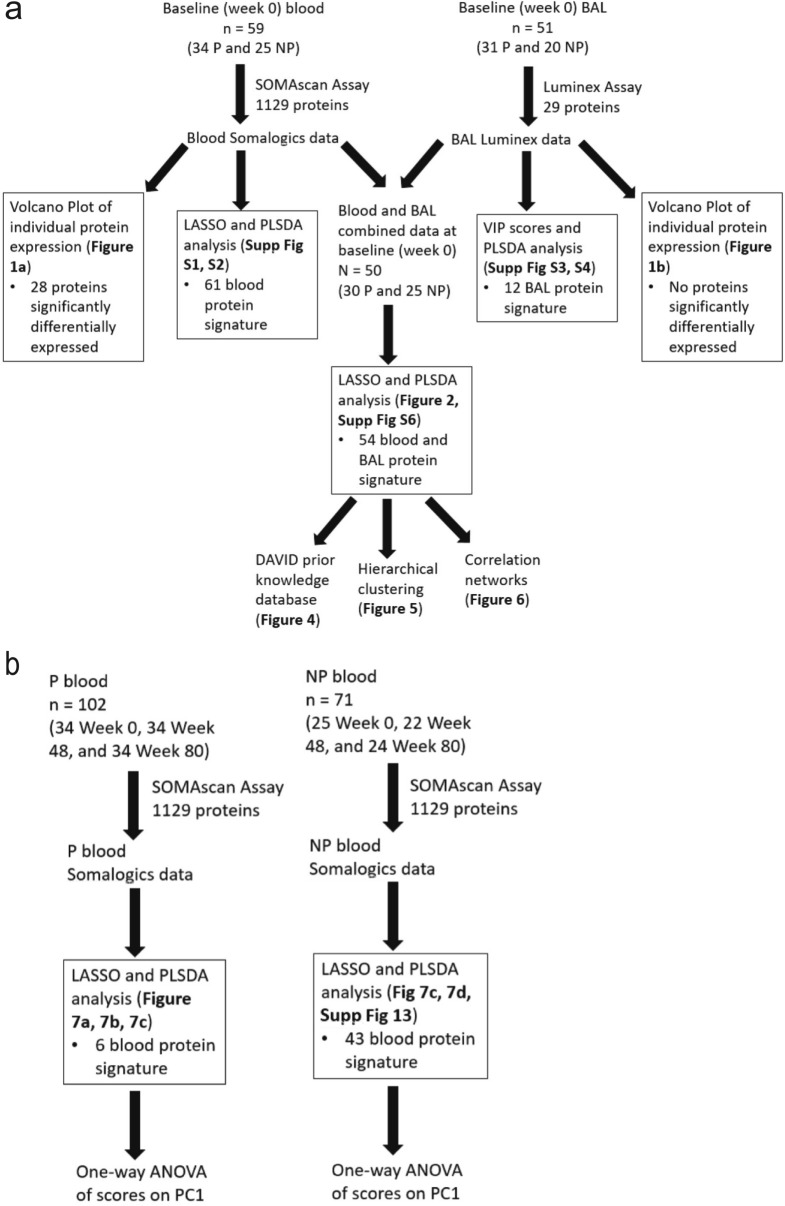
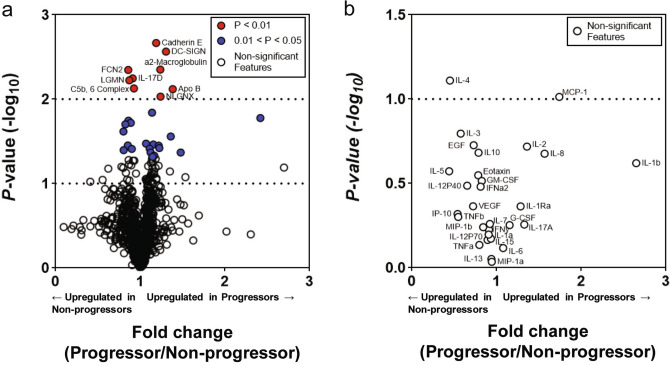
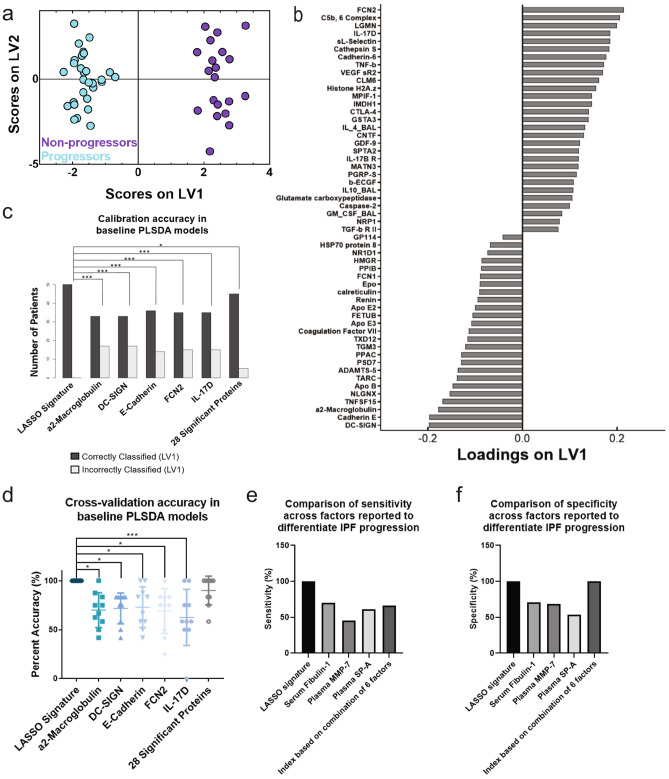
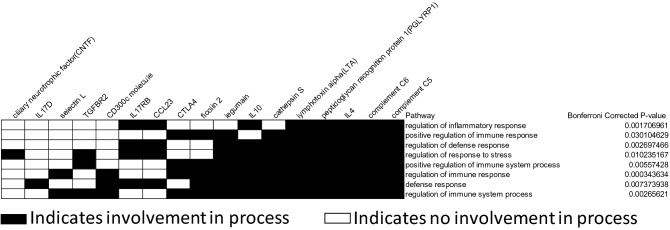
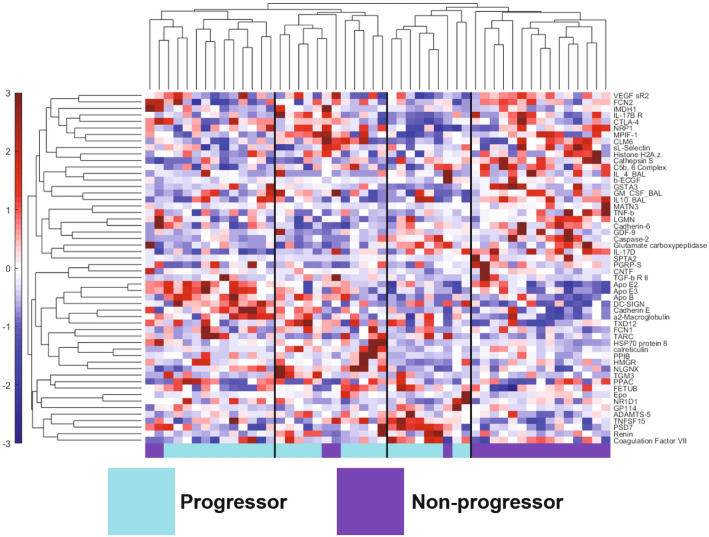
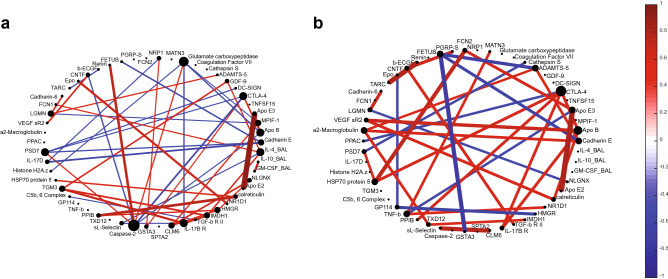
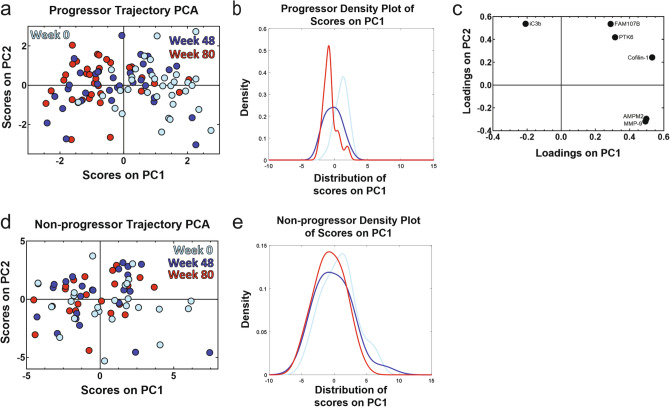
Idiopathic pulmonary fibrosis (IPF) is a progressive and heterogeneous interstitial lung disease of unknown origin with a low survival rate. There are few treatment options available due to the fact that mechanisms underlying disease progression are not well understood, likely because they arise from dysregulation of complex signaling networks spanning multiple tissue compartments. To better characterize these networks, we used systems-focused data-driven modeling approaches to identify cross-tissue compartment (blood and bronchoalveolar lavage) and temporal proteomic signatures that differentiated IPF progressors and non-progressors. Partial least squares discriminant analysis identified a signature of 54 baseline (week 0) blood and lung proteins that differentiated IPF progression status by the end of 80 weeks of follow-up with 100% cross-validation accuracy. Overall we observed heterogeneous protein expression patterns in progressors compared to more homogenous signatures in non-progressors, and found that non-progressors were enriched for proteomic processes involving regulation of the immune/defense response. We also identified a temporal signature of blood proteins that was significantly different at early and late progressor time points (p < 0.0001), but not present in non-progressors. Overall, this approach can be used to generate new hypothesis for mechanisms associated with IPF progression and could readily be translated to other complex and heterogeneous diseases.


Conflict of interest statement

K.C.N., D.N.O., K.M.D., V.N.L., M.X., S.J.G, E.S.W., S.M., B.B.M., and K.B.A. report no competing interests. M.L.S. reports compensation for participation on a scientific advisory board, speaking, and consultancy for Boehringer Ingelheim Pharmaceuticals, Inc, unrelated to this manuscript. K.R.F. reports grants and consulting fees from Boehringer Ingelheim, grants and consulting fees from Roche/Genentech, and consulting fees from Veracyte, Fibrogen, Sanofi-Genzyme, and Celgene, outside of this project. F.J.M. has received personal fees from Forest, Janssen, GlaxoSmithKline, Nycomed/Takeda, Amgen, AstraZeneca, Boehringer Ingelheim, Ikaria/Bellerophon, Genentech, Novartis, Pearl, Pfizer, Roche, Sunovion, Theravance, Axon, CME Incite, California Society for Allergy and Immunology, Annenberg, Integritas, InThough, Miller Medical, National Association for Continuing Education, Paradigm, Peer Voice, UpToDate, Haymarket Communications, Western Society of Allergy and Immunology, Informa, Bioscale, Unity Biotechnology, ConCert, Lucid, Methodist Hospital, Prime, WebMD, Bayer, Ikaria, Kadmon, Vercyte, American Thoracic Society, Academic CME, Falco, Axon Communication, Johnson & Johnson, Clarion, Continuing Education, Potomac, Afferent, and Adept; and has collected nonfinancial support from Boehringer Ingelheim, Centocor, Gilead, and Biogen/Stromedix; and declares other interests with Mereo, Boehringering Ingelheim, and Centocor. All are outside of this project.

Figures

Figure 1
Figure 1
Schematic illustrating the number of samples and the computational tools used in analyses focusing on (a) comparing the inclusion of data from across multiple tissue compartments into data-driven models, and (b) comparing expression of proteins in the same patients over time. P, progressor; NP, non-progressor; BAL, bronchoalveolar lavage; LASSO, least absolute shrinkage and selection operator; PLSDA, partial least squares discriminant analysis; VIP, variable importance in projection; DAVID, database for annotation, visualization, and integrated discovery; PC1, principal component 1; Supp, supplemental.
Figure 2
Figure 2
Volcano plot of blood (a) and BAL (b) proteins measured in COMET progressors and non-progressors. Proteins with a fold change greater than one are increased in progressors; fold changes less than one indicates elevation in non-progressors. Blue protein markers have a p value < 0.05 after a two-tailed, two-sample t test; red markers indicate p value < 0.01 after the same test. No blood or BAL proteins were significantly different between progressors and non-progressors after adjusting for multiple comparisons using the Bonferroni correction.
Figure 3
Figure 3
The LASSO-identified signature based on blood and BAL proteins separated progressors and non-progressors with high accuracy and significantly outperformed analyses based on individual factors. (a) PLSDA scores plot based on blood and BAL proteins highlights strong differentiation between progressors (cyan) and non-progressors (purple); the model separated the two groups with 100% cross-validation and calibration accuracy. (b) The loadings on latent variable 1 (LV1) captured 8.75% of the total variance in the data, with negatively loaded proteins being comparatively increased in progressors and positively loaded proteins being comparatively reduced. (c) Comparison of the calibration accuracies between analyses based on data-driven signatures and univariate factors. The LASSO-selected PLSDA model based on blood and BAL proteins had significantly higher calibration accuracy than all analyses based on single proteins and a model based on the collection of all 28 significantly different proteins identified in Fig. 1 (Cochran’s Q test with McNemar’s post hoc test; *p < 0.05; ***p < 0.001). (d) Comparison of cross-validation accuracies between analyses based on data-driven signatures and univariate factors. The LASSO-selected PLSDA model based on blood and BAL proteins had significantly higher cross-validation accuracy than all analyses based on single proteins and trended towards better cross-validation accuracy than a model based on the 28 proteins identified in Fig. 1 (one-way ANOVA with Tukey’s post hoc test; *p < 0.05; ***p < 0.001). (e) Comparison of sensitivity between the LASSO-selected PLSDA model based on blood and BAL proteins and previously published models of IPF progression (serum fibulin-1, plasma MMP-7, plasma SP-A, and an additive combination of blood factors). (f) Comparison of specificity between the LASSO-selected PLSDA model based on blood and BAL proteins and previously published models of IPF progression.
Figure 4
Figure 4
DAVID enrichment analysis of the blood and BAL LASSO-identified proteins that were comparatively elevated in the non-progressor group in the PLSDA loadings plot showed enrichment for pathways involved in the regulation of the inflammatory, defense, and immune responses after application of the Bonferroni correction (enrichment score 4.83). Black squares indicate protein involvement in a particular pathway, while white squares indicate non-involvement.
Figure 5
Figure 5
Hierarchical clustering of the COMET IPF patients by the LASSO-identified blood and BAL protein signature highlights a single group of non-progressors (purple) and three groups of progressors (cyan) with distinct expression levels of various proteins in the signature. Only 5 out of the 50 patients were misclassified. Protein expression level is shown in the color scale on the left of the figure, with red indicating higher concentration compared to the mean, and blue lower concentration compared to the mean.
Figure 6
Figure 6
Protein correlation networks of the LASSO-identified blood and BAL protein signature present in progressors (a) and non-progressors (b) suggest that non-progressors have a higher degree of control over their proteomic networks than progressors. A lineconnecting two proteins indicates the presence of a significant (p < 0.05) correlation, as calculated by Pearson’s correlation coefficient. Brighter and thicker lines indicate stronger, more significant correlations, respectively. The value of the correlation coefficient for both networks is displayed in the color bar scale on the right, with red indicating a positive relationship and blue a negative relationship.
Figure 7
Figure 7
Trajectory PCA highlights changes in blood protein expression over time in progressors that is not seen in non-progressors. (a) A trajectory PCA model based on three time points of progressor blood protein measurements highlights the change in protein expression patterns over time in IPF progressors. The week 0 scores on principal component 1 (PC1) were found to be significantly different from both the week 48 scores (p < 0.001) and the week 80 scores (p < 0.001) by one-way ANOVA with Tukey’s post hoc test. The week 48 and week 80 scores were not found to be significantly different from one another by the same test (p = 0.16). (b) The kernel density plot of the scores on PC1 provides another way of viewing the differences in the scores distribution of across all three time points of progressors. (c) The LASSO-identified signature separates the three time points of progressor measurements while capturing 49.95% of the natural variance in the data across the first two principal components. (d) A trajectory PCA model based on three time points of non-progressor protein measurements does not show clear separation across the three time points. None of the scores on PC1 of the three time points were significantly different from each other after one-way ANOVA with Tukey’s post hoc test (all p > 0.05). (e) The kernel density plot of the scores on PC1 highlights the overlapping of the scores on PC1 from the three time points of non-progressors.

References

    1. Lederer DJ, Martinez FJ. Idiopathic pulmonary fibrosis. N. Engl. J. Med. 2018;378:1811–1823. doi: 10.1056/NEJMra1705751. - DOI - PubMed
    1. Richeldi L, et al. Efficacy and safety of nintedanib in idiopathic pulmonary fibrosis. N. Engl. J. Med. 2014;370:2071–2082. doi: 10.1056/NEJMoa1402584. - DOI - PubMed
    1. King TE, et al. A phase 3 trial of pirfenidone in patients with idiopathic pulmonary fibrosis. N. Engl. J. Med. 2014;370:2083–2092. doi: 10.1056/NEJMoa1402582. - DOI - PubMed
    1. Lin C, Borensztajn K, Spek CA. Targeting coagulation factor receptors—protease-activated receptors in idiopathic pulmonary fibrosis. J. Thromb. Haemost. 2017;15:597–607. doi: 10.1111/jth.13623. - DOI - PubMed
    1. Raghu G, et al. An official ATS/ERS/JRS/ALAT statement: idiopathic pulmonary fibrosis: evidence-based guidelines for diagnosis and management. Am. J. Respir. Crit. Care Med. 2011;183:788–824. doi: 10.1164/rccm.2009-040GL. - DOI - PMC - PubMed

Publication types