. 2020 Apr;2(4):335-350.
doi: 10.1038/s42255-020-0195-8. Epub 2020 Apr 21.

Identifying strategies to target the metabolic flexibility of tumours

Affiliations

Identifying strategies to target the metabolic flexibility of tumours

Andrés Méndez-Lucas et al. Nat Metab. 2020 Apr.

Abstract

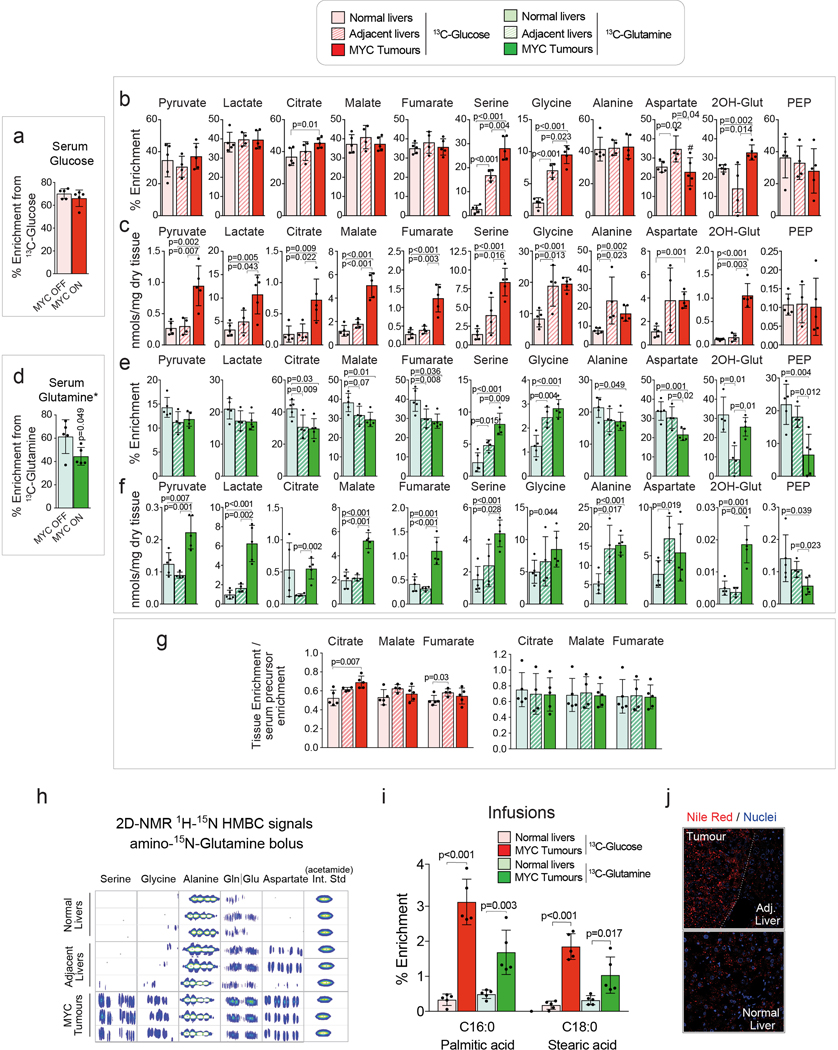
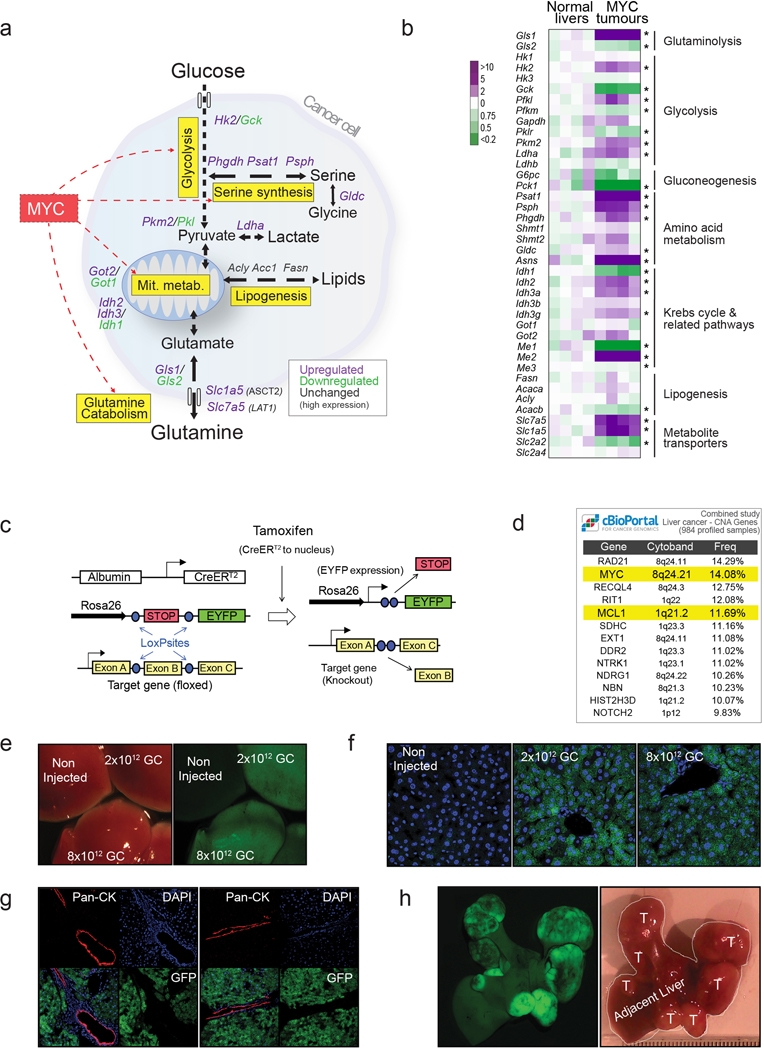
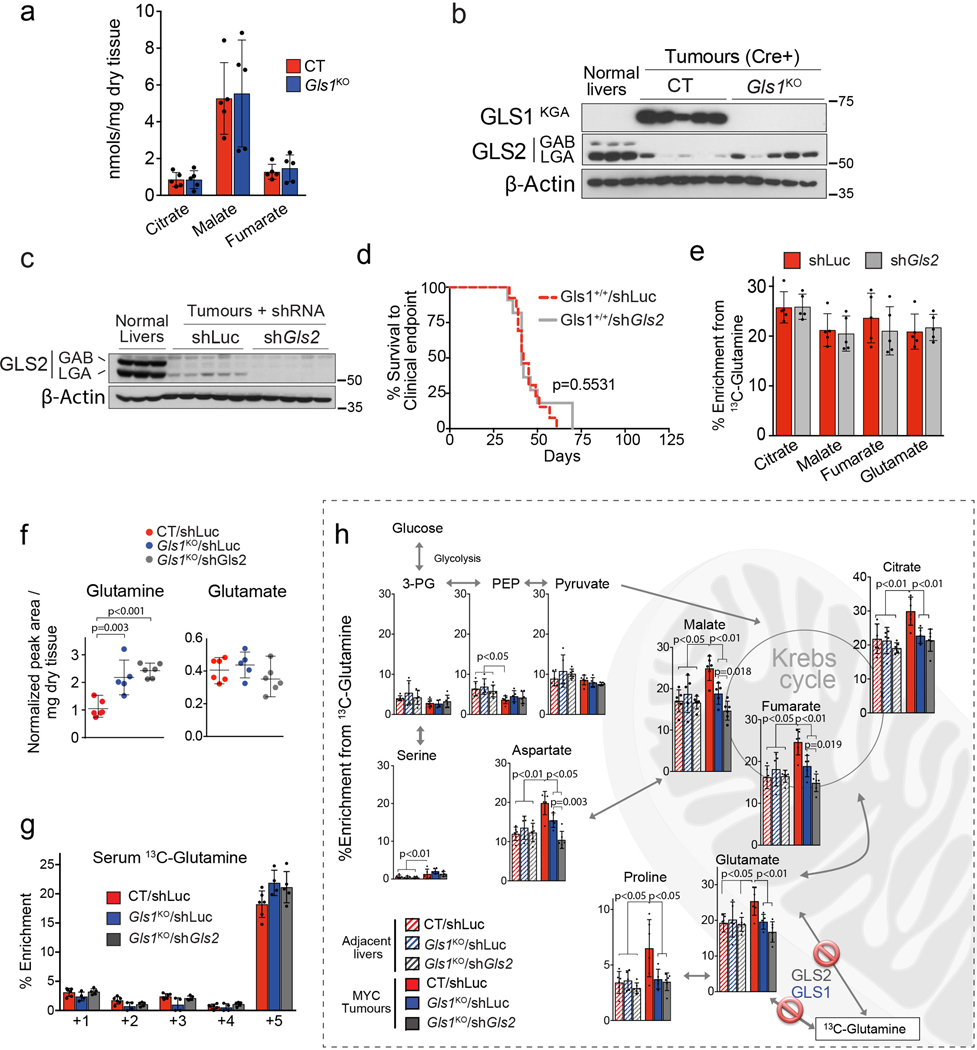
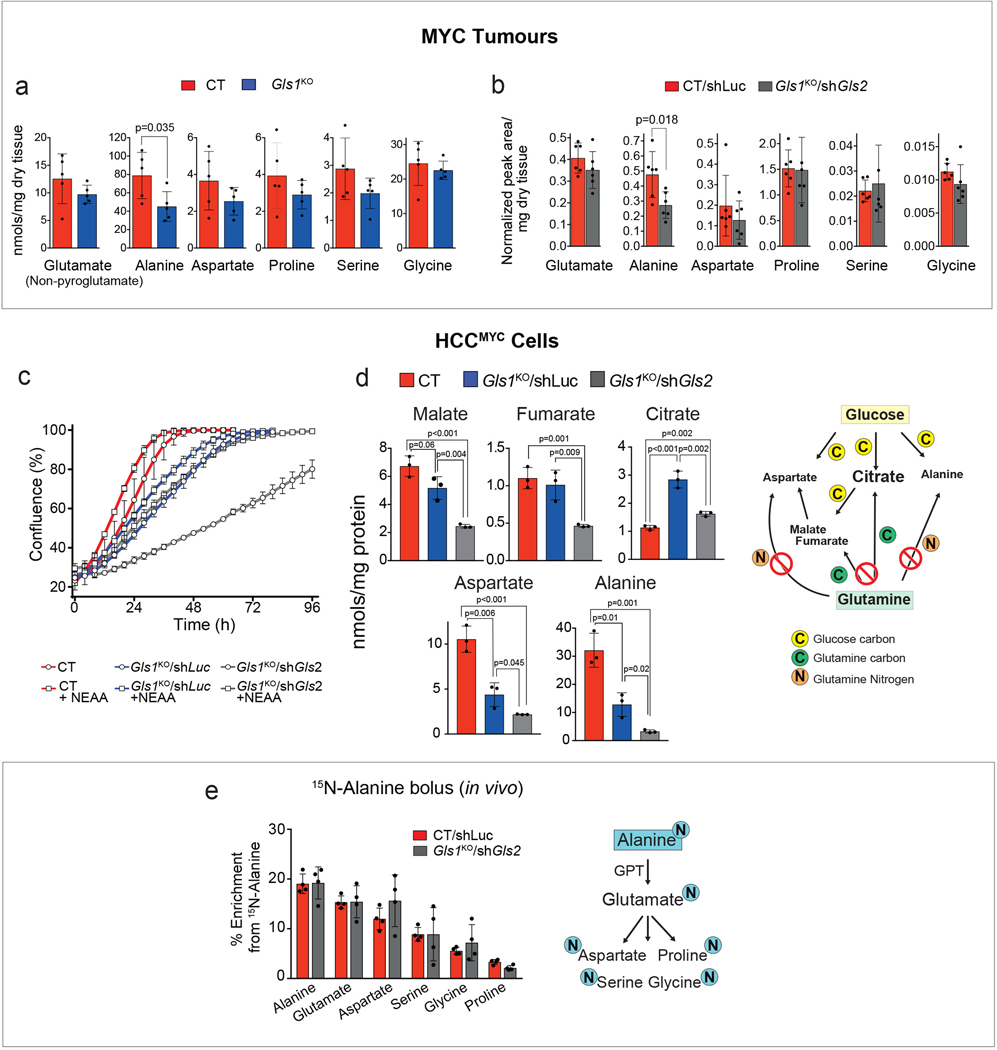
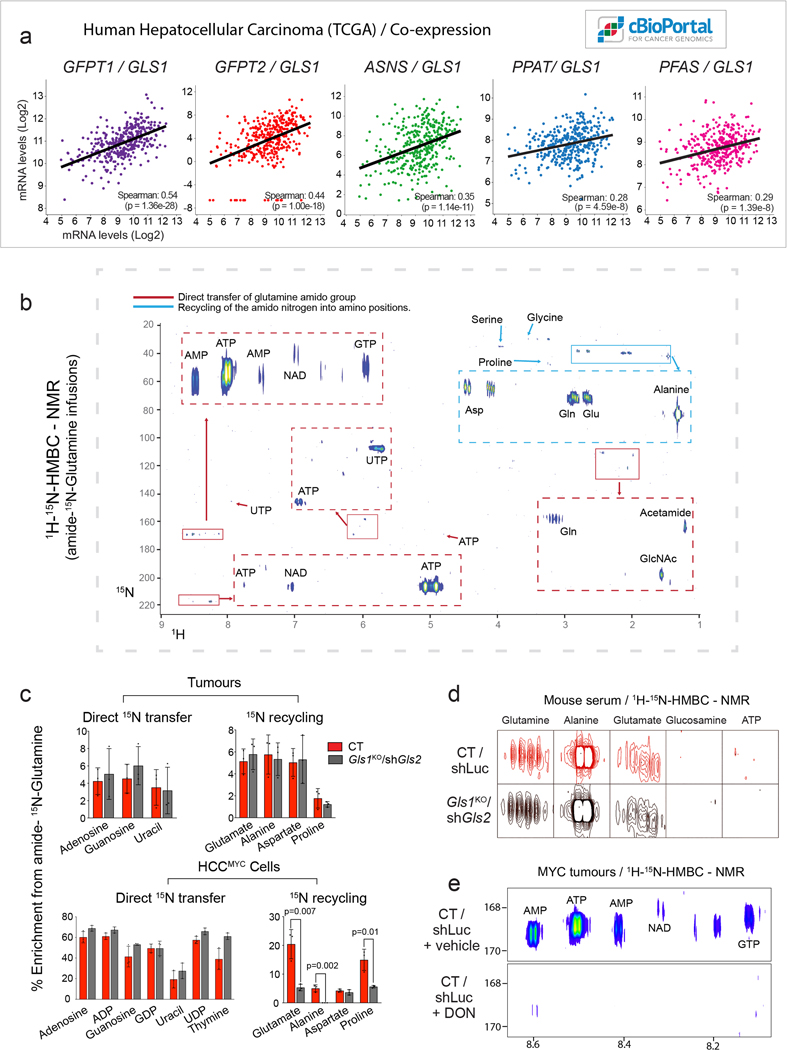
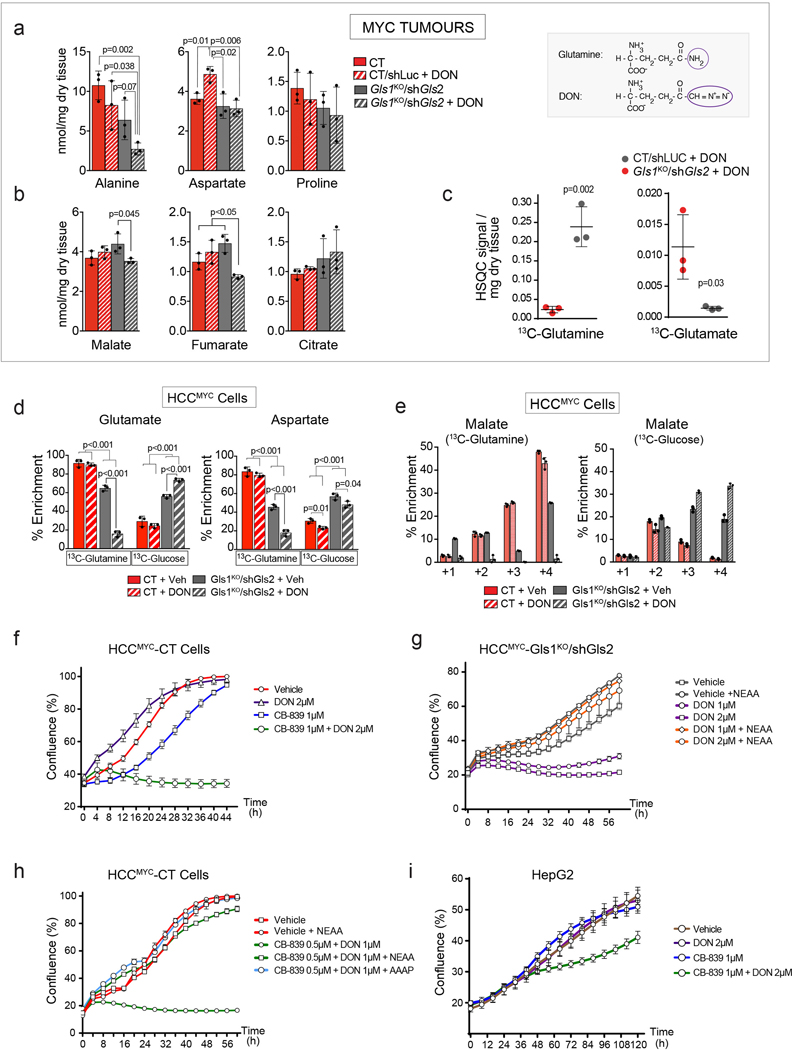
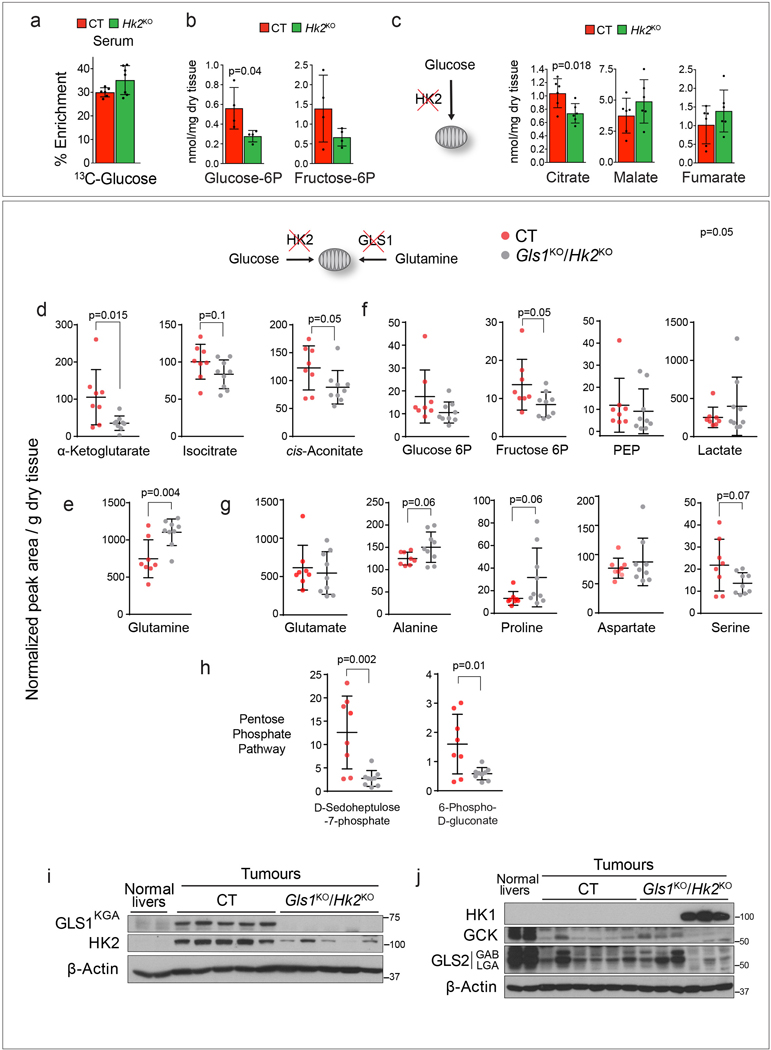
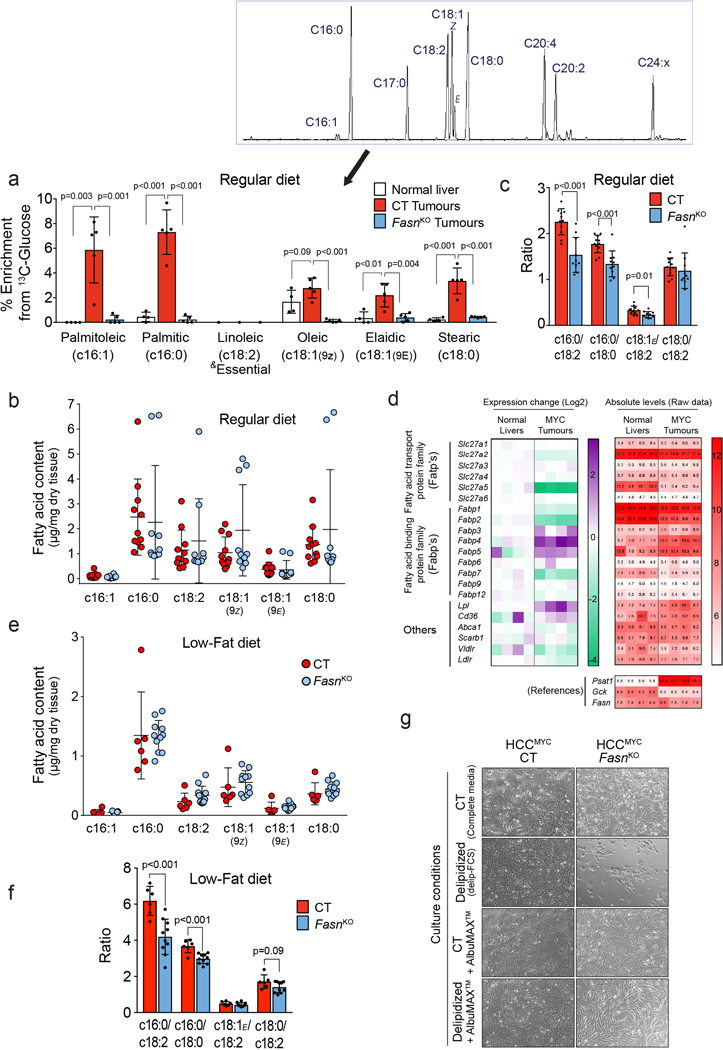
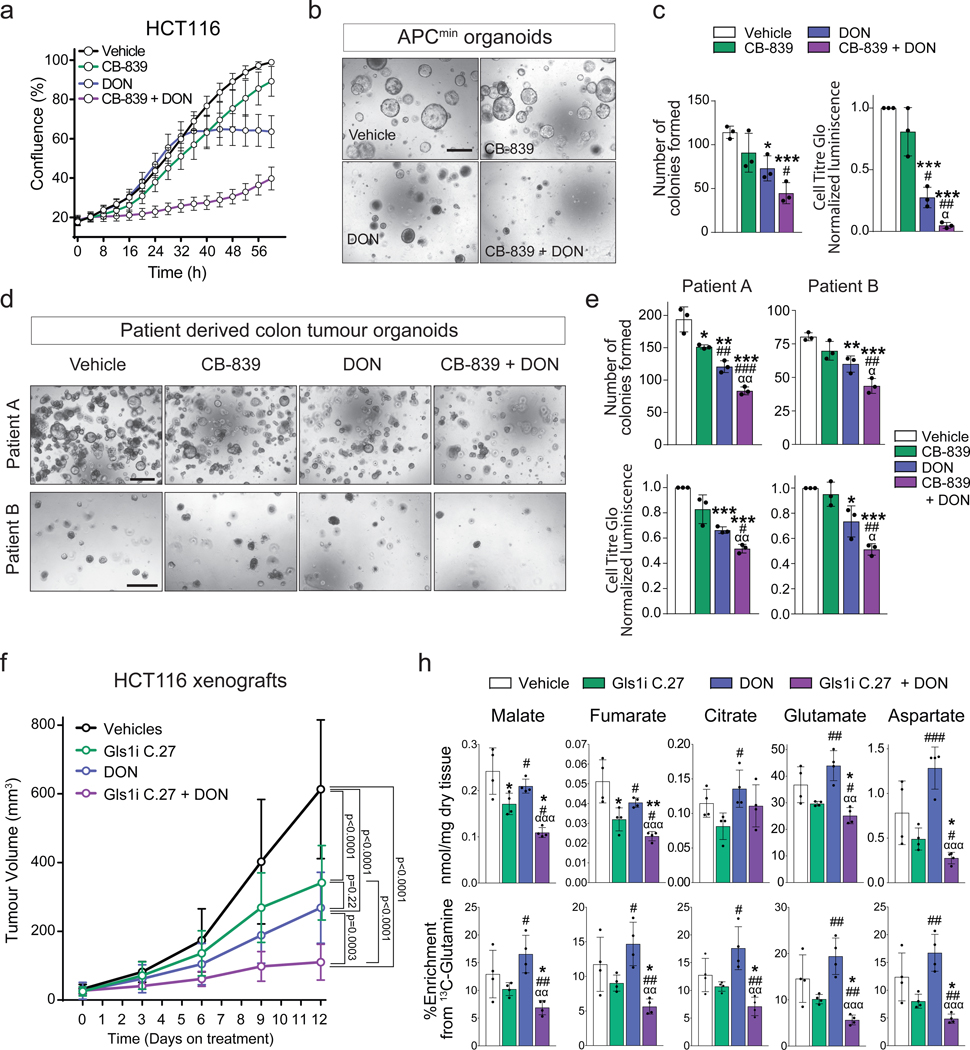
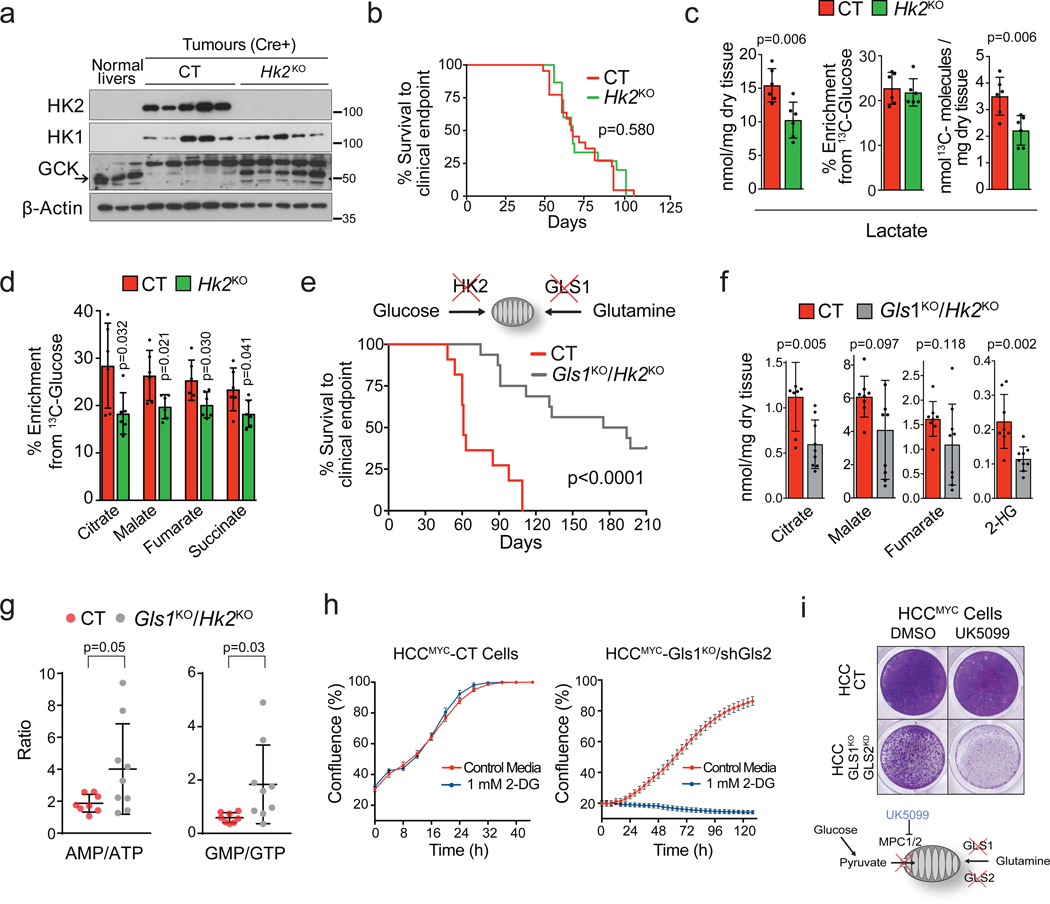
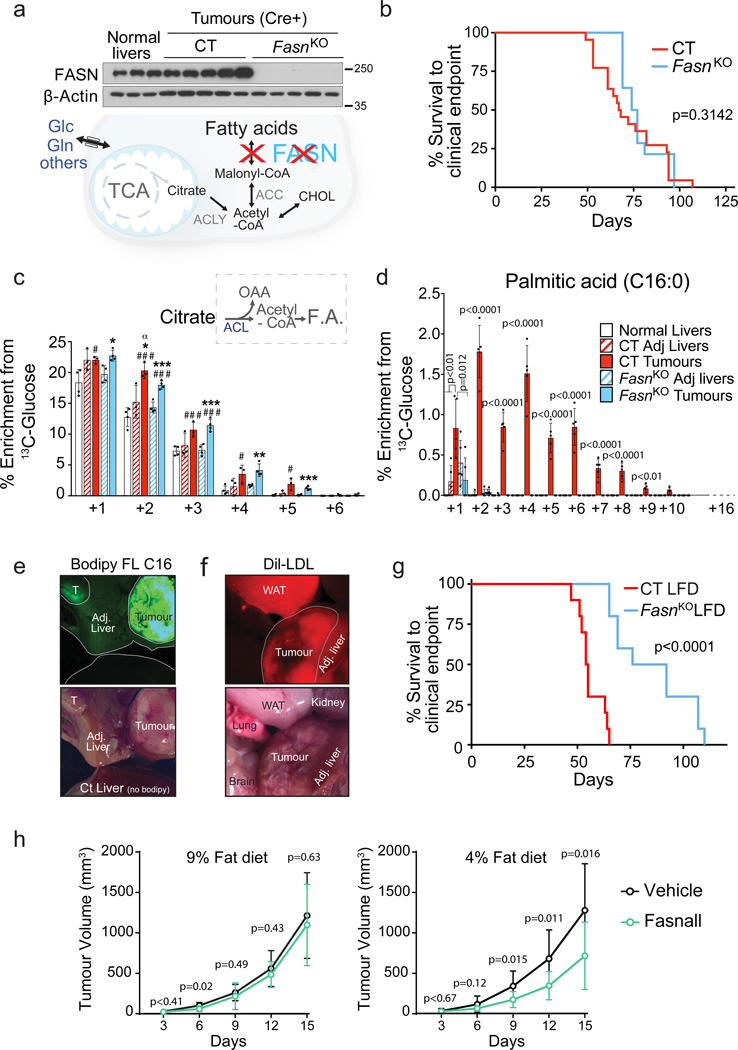
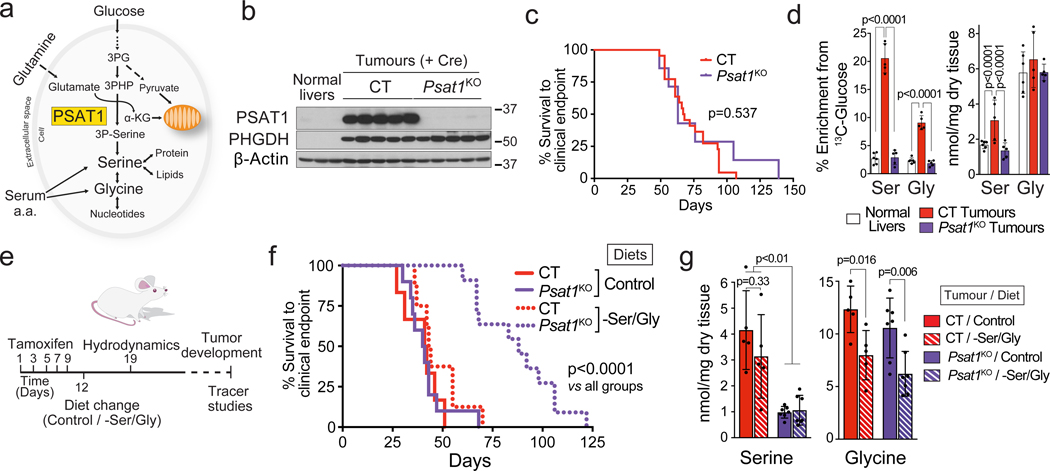
Plasticity of cancer metabolism can be a major obstacle to efficient targeting of tumour-specific metabolic vulnerabilities. Here, we identify the compensatory mechanisms following the inhibition of major pathways of central carbon metabolism in c-MYC-induced liver tumours. We find that, while inhibition of both glutaminase isoforms (Gls1 and Gls2) in tumours considerably delays tumourigenesis, glutamine catabolism continues, owing to the action of amidotransferases. Synergistic inhibition of both glutaminases and compensatory amidotransferases is required to block glutamine catabolism and proliferation of mouse and human tumour cells in vitro and in vivo. Gls1 deletion is also compensated for by glycolysis. Thus, co-inhibition of Gls1 and hexokinase 2 significantly affects Krebs cycle activity and tumour formation. Finally, the inhibition of biosynthesis of either serine (Psat1-KO) or fatty acid (Fasn-KO) is compensated for by uptake of circulating nutrients, and dietary restriction of both serine and glycine or fatty acids synergistically suppresses tumourigenesis. These results highlight the high flexibility of tumour metabolism and demonstrate that either pharmacological or dietary targeting of metabolic compensatory mechanisms can improve therapeutic outcomes.


Figures

Extended Data Fig. 1
Extended Data Fig. 1. Glucose and glutamine metabolism in MYC liver tumours.
(a-g) Mice bearing MYC-driven liver tumours and control mice (n=5 per group) were infused with [U-13C]-glucose (a-c), or [U-13C]-glutamine (d-f) and the label incorporation into tissue metabolites was analysed by GC-MS: percent enrichment in either serum glucose (a) or glutamine (d) in mice administered either [U-13C]-glucose or [U-13C]-glutamine bolus, respectively (*glutamine enrichment is estimated from quantification of its spontaneous product pyroglutamate); (b and e) percent enrichment; (c and g) total content of metabolites. Note that lower glutamine enrichment in Krebs cycle intermediates in tumours in comparison with normal livers is proportional to the difference in serum enrichment between control and tumour-bearing mice; normalized values for Krebs cycle metabolites from (b and e) are shown in (g). Data are presented as mean ± S.D. Statistical analysis was performed using a two-tailed Student’s t-test. Complete list of exact p-values is provided as a source data file. (h) 15N-HMBC 2D NMR signals of the indicated metabolites in the indicated mouse tissues after amino- 15N-glutamine bolus. Spectra of three representative mice per group are shown (n=5 mice per group). (i) Percent enrichment of tissue total fatty acids (both free and esterified) after either [U-13C]-glucose or [U-13C]-glutamine infusions (n=5 mice per group; GC-MS). Data are presented as mean ± S.D. Statistical analysis was performed using a two-tailed Student’s t-test. Complete list of exact p-values is provided as a source data file. (j) Nile red fluorescence visualised by confocal microscopy showing neutral lipid accumulation (in red) in MYC-driven tumours. Nuclei are shown in blue.
Extended Data Fig. 2
Extended Data Fig. 2. Expression of key metabolic enzymes in MYC liver tumours and the method of genetically manipulating their expression in vivo.
(a) A diagram depicting some of the most relevant transcriptomic changes in central carbon metabolism in MYC-driven liver tumours when compared with normal livers based on microarray data shown in (b). (b) A heat map of gene expression of relevant metabolic enzymes and metabolite transporters in normal livers and MYC-driven liver tumours (n=4 mice per group). Statistical analysis was performed using a two-tailed Student’s t-test. *, p < 0.05. (c) Generation of liver specific conditional knockouts of the genes of interest in hepatocytes. Cre-ERT2 is expressed under the hepatocyte-specific albumin gene promoter. Cre is activated upon administration of tamoxifen. Simultaneously, the Enhanced Yellow Fluorescent Protein (eYFP) reporter gene is activated, following Cremediated excision of a loxP-flanked transcriptional “stop” sequence, after the Rosa26 locus. (d-g) To confirm a cell of origin of MYC-driven liver tumours, the dose of AAV8-Cre (adenoassociated virusserotype 8 expressing Cre recombinase) required to activate the eYFP reporter expression in all the hepatocytes was titrated. Dose is expressed in genome copies (GC): (d) Macroscopic fluorescence image of the livers of the mice treated with different doses of AAV8- Cre; (e) Confocal fluorescence image of the mouse livers shown in (d) demonstrating that the dose of 8 × 10¹² GC induces eYFP expression in all the hepatocytes; (f) Immunostaining with the cholangiocyte marker Pan- cytokeratin (PanCK) demonstrates that cholangiocytes are not targeted by AAV8-Cre; (g) Rosa26-eYFP mice treated with 8 × 10¹² GC AAV8-Cre, were hydrodynamically transfected with MYC and MCL1, and the resulting tumours expressed eYFP, demonstrating that hepatocytes are the cell of origin of the tumours (n=3 mice per dose). (h) MYC and MCL1 are among genes frequently upregulated in human liver cancers. Analysis performed in cBioPortal,, combining all available liver cancer databases, expressed as percentage of positive tumour samples.
Extended Data Fig. 3
Extended Data Fig. 3. Metabolic consequences of the deletion of either Gls1 or Gls2 in MYC liver tumours.
(a) Total concentration of 13C-labeled Krebs cycle metabolites in CT and Gls1KO tumours after a [U-13C]- glutamine bolus (n=5 mice per group; GC-MS). (b) Western blot of the samples presented in Fig. 2a showing the expression of GLS2 in Gls1KO tumours (n=3,5,5). (c-e) shRNA mediated Gls2 knock-down in MYC-driven liver tumours with intact Gls1 expression does not affect tumour burden or glutamine catabolism. Liver tumours were induced by hydrodynamics-driven co-transfection of plasmids encoding MYC that included a miR30 based shRNA targeting for Gls2 or Renilla Luciferase (pT3- EF1α-c-MYC/shGls2 and pT3-EF1α-c-MYC/shLuc, respectively), and a plasmid encoding MCL1 (pT3-EF1α- MCL1) (c) Western blot demonstrating efficient Gls2 knock-down (n=3,5,5). (d) Kaplan-Meier survival curve (shLuc n=13; shGls2 n=11). P-value was calculated by Mantel–Cox test. (e) 13C-enrichment in the indicated metabolites extracted from either shLuc or shGls2 tumours (Gls1 wild type) after a [U-13C]-glutamine bolus (n=5 mice per group). (f) Total level of glutamine and glutamate in CT/shLuc, Gls1KO/shLuc, and Gls1KO/shGls2 tumours (n=6,5,6; LC-MS). (g) Isotopologue distribution of the 13C-enrichment of glutamine in the serum of mice shown in Fig. 2h–j, Extended Data Fig. 3f, h and 4b (n=6,4,5; GC-MS). Glutamine enrichment was estimated from quantification of its spontaneous product pyroglutamate. (h) 13C-enrichment of the indicated metabolites after a [U- 13C]-glutamine bolus, related to Fig. 2h,i, shows the enrichment of glycolytic intermediates from [U-13C]- glutamine through gluconeogenesis in tumours and the respective adjacent livers (n=6,5,6,6,5,6). All data are presented as mean ± S.D. Statistical analysis was performed using a two-tailed Student’s t-test. Complete list of exact p-values is provided as a source data file.
Extended Data Fig. 4
Extended Data Fig. 4. Non-essential amino acids support proliferation of tumour cells in the absence of glutaminases.
(a-b) Total levels of NEAA measured in extracts from either CT and Gls1KO tumours (a; n=5 mice per group; GC-MS), or CT/shLuc and Gls1KO/shGls2 tumours (b; n=6 mice per group; GC-MS). (c) Proliferation of cells derived from either CT, Gls1KO/shLuc or Gls1KO/shGls2 HCCMYC tumours in the indicated conditions. Representative curves from one of three independent experiments (with three biological replicates) are shown. (d) Quantification of Krebs cycle metabolites and amino acids in extracts from the CT, Gls1KO/shLuc or Gls1KO/shGls2 HCCMYC cells grown in control conditions (Data represents the average of three different experiments). (e) 15N-enrichment in the indicated amino acids from CT and Gls1KO/shGls2 tumours after a 15N-alanine bolus (n=4 mice per group; GC-MS). Data are presented as mean ± S.D. Statistical analysis was performed using a two-tailed Student’s t-test. Complete list of exact p-values is provided as a source data file.
Extended Data Fig. 5
Extended Data Fig. 5. The role of transamidasedependent glutamine catabolism.
(a) A correlation between the gene expression level of Gls1 and different amidotransferases analyzed from the TCGA human Hepatocellular Carcinoma Provisional mRNA dataset (https://www.cancer.gov/tcga, RNA Seq V2, 371 patients / 373 samples). Modified from cBioPortal67,68. (b) A representative full 1H-15N 2D-HMBC NMR spectra of the polar fraction of a CT tumour from a mouse infused for three hours with amido-15N-glutamine. Shows the regions of interest (R.O.I) of the signals from the indicated metabolites as the results of the 15Nincorporation from the amide group of glutamine during in vivo infusions. (c) Quantification of the amido-15N-glutamine-derived enrichment of different metabolites, including nucleosides, in tumours from mice infused with amido- 15N-glutamine (n=3 mice per group; LC-MS; top panel) and cells isolated from the tumours and incubated with 2 mM amido-15N-glutamine for 48 h (n=3 independent experiments; LC-MS; bottom panel). Data are presented as mean ± S.D. Statistical analysis was performed using a two-tailed Student’s t-test. Complete list of exact p-values is provided as a source data file. (d) 1H-15N 2D-HMBC NMR spectra of the serum of mice infused with amido-15N-glutamine, demonstrating the presence of labelled amino acids. (e) Representative region of the 1H-15N 2D-HMBC NMR spectra of CT MYC liver tumours from mice treated with the vehicle or 25 mg/kg of the pan-amidotransferase inhibitor DON, infused with amido-15N-glutamine. Note the DON-dependent suppression of the 15N incorporation.
Extended Data Fig. 6
Extended Data Fig. 6. The effect of coinhibiting glutaminases and amidotransferases on metabolism and tumour cell proliferation.
(a-c) The effect of DON (50 mg/kg, 4 h) on either CT or Gls1KO/shGls2 tumours from animals treated prior to [U- 13C]-glutamine bolus (n=3 mice per group): (a) 2D 1H- 13C-HSQC NMR signals of glutamine and glutamate; (b) Total concentration of glutamine-derived amino acids (n=3 mice per group); (c) Total concentration of Krebs cycle intermediates (n=3 mice per group). (d) Enrichment from either [U-13C]-glutamine or [U-13C]- glucose in HCCMYC-CT and HCCMYC-Gls1KO/shGls2 tumour cells treated with DON (3 h; n=3 independent experiments; GC-MS). (e) Isotopologue distribution of the 13C incorporation into malate in the experiment shown in (d) (n=3 independent experiments). Data are presented as mean ± S.D. Statistical analysis was performed using a two-tailed Student’s t-test. Complete list of exact p-values is provided as a source data file. (f) Combination of glutaminase inhibition and DON on cell proliferation of HCCMYC cells: HCCMYC-CT cells were treated with 1 μM CB-839 and/or 2 μM of DON. (g and h) HCCMYC-Gls1KO/shGls2 (g) and HCCMYC-CT (h) cells treated with a combination of DON and CB-839 with or without the addition of the indicated amino acids. AAAP - a mix of alanine, aspartate, asparagine and proline. (i, j) HepG2 cells treated with DON and/or CB-839 at the indicated concentrations. In (f-i) growth was monitored in an IncuCyte Live-Cell analysis system. In (f-i), representative curves from one of three independent experiments with 3 replicates are shown. Data are presented as mean ± S.D.
Extended Data Fig. 7
Extended Data Fig. 7. Effects of the simultaneous reduction of glycolysis and glutaminolysis on metabolism of tumours.
(a) 13C-enrichment of glucose in the serum of mice bearing either CT and Hk2KO tumours administered [U- 13C]-glucose bolus (n=6 mice per group). (b,c) Total level of glucose 6P and fructose 6P (b) and Krebs cycle intermediates (c) in CT and Hk2KO tumours (n=6 mice per group; GC-MS). (d-f) Total metabolite levels in CT and Gls1KO/Hk2KO tumours (CT n=8; Gls1KO/Hk2KO n=9; LC-MS): (d) Additional Krebs cycle intermediates to those shown in Fig. 5f; (e) glutamine; (f) glycolytic intermediates; (g) NEAAs; (h) pentose phosphate pathway intermediates. (i,j) Western blot of glutaminase and hexokinase isoform expression in CT and Gls1KO/Hk2KO tumours. β-actin was used as a loading control: (i) Demonstration of the deletion of Gls1 and Hk2 (n=2,5,5); (j) Protein levels of other glutaminase and hexokinase isoforms in CT and Gls1KO/Hk2KO tumours (n=2,6,6). Data are presented as mean ± S.D. Statistical analysis was performed using a two-tailed Student’s t-test. Complete list of exact p-values is provided as a source data file.
Extended Data Fig. 8
Extended Data Fig. 8. Inhibition of lipid metabolism in MYC liver tumours.
(a) 13C-enrichment of fatty acids (total fraction) from the indicated tissues of mice infused with [U-13C]-glucose demonstrating a total blockade in fatty acid biosynthesis in FasnKO tumours (n=4,5,5). A representative chromatogram of the fatty acid composition of a FasnKO tumour is shown. For unsaturated fatty acids, a residual enrichment that remained in the authentic standards after substraction of the natural abundance of 13C, was also substracted from the samples. (b) Total fatty acid content in CT and FasnKO tumours (n=11,10). (c) Fatty acid ratios in CT and FasnKO tumours (n=11,10). (d) Left panel, a heat map demonstrating the expression of genes involved in lipid transport in MYC-driven liver tumours compared to normal livers (gene microarray, Log2-transformed; n=4 mice per group). Right panel, absolute values are shown to identify those genes with higher total expression level, and to discriminate the genes with low levels of expression, which could be insufficient to produce relevant protein levels. Based on the expression of the relevant control genes (examples are shown in the lower panel) we considered 6 as a baseline level, while higher than 8 as a high level of expression. (e) Total fatty acid content in CT and FasnKO tumours kept on the Low-Fat diet (n=6,11). (f) The ratios of different fatty acids in CT and FasnKO tumours kept on the low-fat diet (n=6,11). Data are presented as mean ± S.D. Statistical analysis was performed using a two-tailed Student’s t-test. Complete list of exact p-values is provided as a source data file. (g) Light microscopy images of living cells isolated from CT and FasnKO tumours, after being maintained in the indicated media conditions with modulation of the lipid availability for 72 h. Representative images from three independent experiments are shown.
Extended Data Fig. 9
Extended Data Fig. 9. Inhibition of serine and glycine metabolism in MYC liver tumours.
(a) Representative 15N-HMBC 2D NMR signals of the indicated metabolites in mouse livers and tumours after an amino-15N-glutamine bolus (NMR spectra acquired: n=4 mice per group). (b) 15N-enrichment of glutamine (m+1) in the serum of mice shown in Fig. 7g and Extended Data Fig. 9a,d,e (n=5,5,7,7; GC-MS). Glutamine enrichment is estimated from quantification of its spontaneous product pyroglutamate. (c) Psat1fl/fl cells were transduced with either MSCVCreER or Empty vector, and both lines were treated with 4OH-Tamoxifen to induce Cre activity. The resulting Psat1WT and Psat1KO cells were cultured in DMEM with dialysed FCS and indicated metabolites. Ser: 0.5 mM serine; Gly: 0.5 mM glycine; 0.5 mM formate. Representative curves from one of three independent experiments with three replicates are shown. Data represent mean ± S.D. (d) Total concentration of metabolites in livers and tumours of mice from the experiment shown in Fig. 7f,g and Extended Data Fig. 9a, b, e (n=4,4,5,5,7,7; LC-MS). (e) Total concentration and 15N-enrichment from an amino-15N-glutamine bolus in serine and glycine from the serums of the indicated mice from the experiment shown in (a) (n=5,5,7,7). In (b and e) data are presented as mean ± S.D. Statistical analysis was performed using a two-tailed Student’s ttest. Complete list of exact p-values is provided as a source data file. In (d) data are presented as mean ± S.D. Statistical analysis was performed using one-way ANOVA followed by Tukey’s post hoc test. *, p < 0.05; **, p< 0.01; ***, p < 0.001, with respect to CT tumours on control diet; #, p < 0.05; ##, p< 0.01; ###, p < 0.001, with respect to CT tumours on –SG diet.
Fig. 1.
Fig. 1.. In vivo metabolic tracing using 13C-labeled glucose and glutamine reveals upregulated pathways in MYC-driven liver tumours.
(a and b) 13C-enrichment of the indicated metabolites extracted from either normal livers or MYC-driven liver tumours after either a bolus of [U-13C]-glucose (a, n=5,6) or [U-13C]-glutamine (b, n=4,5) measured by GC-MS. Tumours were initiated in LAP-tTA/TRE-MYC mice by weaning them into regular chow. Mice maintained on a doxycycline-containing diet were used as controls. Data are presented as mean ± S.D. Statistical analysis was performed using a two-tailed Student’s t-test. (c) Quantification of the [U-13C]-glucose and [U-13C]-glutamine carbon incorporation into some of the key intermediates of the central carbon metabolism in MYC-driven liver tumours and control normal livers after 3 h of infusion (n=5 mice per group). The content of 13C-labeled palmitic acid from a triglyceride pool is compared for tumours and corresponding adjacent livers (n=3 mice per group). Glutamine labelling is estimated from quantification of its spontaneous product pyroglutamate, and glutamate from the non-pyroglutamate fraction. The decrease of tumoural 13C-glutamate and 13C-glutamine pools suggests their fast catabolism and increased anaplerosis. Labelling in all carbon positions of pyruvate, lactate and alanine from both 13C-glucose and 13C-glutamine in tumours suggests malic enzyme-driven pyruvate cycling. The main serine isotopologues observed during [U-13C]-glucose are +1 and +2 and not +3, which can be produced due to carbon exchange during glycine synthesis and one carbon metabolism. Data are presented as mean ± S.D. Statistical analysis was performed using a two-tailed Student’s t-test. Corresponding isotopologues in tumours and normal livers infused with the same label are compared. (d) Diagram depicting the relative contribution of glucose (red) and glutamine (green) to the different pathways studied. (e) Western blot comparing MYC-driven tumours and normal livers for the expression levels of key enzymes involved in the metabolic pathways depicted in (d) (n=3 mice per group). See also Extended Data Fig. 1 and 2.
Fig. 2.
Fig. 2.. Ablation of glutaminases impairs MYC-induced tumourigenesis and reveals a contribution of a glutaminase-independent glutamine catabolism.
(a-d) Inhibiting Gls1 expression in MYC-driven tumours decreases glutamine catabolism and tumour burden: Tumours were induced by hydrodynamics-based transfection of MYC/MCL1 two weeks after tamoxifen-induced liver-specific CRE activation in Gls1fl/fl/Alb-CreERT2/Rosa26eYFP (Gls1KO) and Alb-CreERT2/Rosa26eYFP (CT) mice. (a) Top, western blot demonstrating the absence of GLS1 in Gls1KO tumours (n=3,5,5). Bottom, glutaminases catalyse the conversion of glutamine to glutamate, a key point of amino acid metabolism. (b) Kaplan-Meier survival curve (CT n=22; Gls1KO n=15). P-value was calculated by Mantel–Cox test. (c) Glutamine levels in CT and Gls1KO tumours (n=5 mice per group, NMR). (d) 13C-enrichment from [U-13C]-glutamine in the indicated metabolites of CT and Gls1KO tumours after [U-13C]-glutamine boluses (n= 5 mice per group, GC-MS). (e-j) Gls2 knock-down in Gls1KO tumours increases the repressive effect on tumour glutaminolysis and tumour burden. Gls1KO/shGls2 tumours are compared to CT/shLuc and Gls1KO/shLuc tumours expressing shRNA against luciferase: (e) Western blot demonstrating shRNA-mediated reduction of GLS2 protein levels in tumours (n=3,3,3,3). (f) Kaplan-Meier survival curve (CT/shLuc n=10, Gls1KO/shLuc n=6, Gls1KO/shGls2 n=7). P-value was calculated by Mantel–Cox test. (g) Western blot showing the protein levels of cleaved PARP, cleaved Caspase 3 and PCNA in the indicated tissues (n=2,6,6). β-Actin was used as a loading control. (h) 13C-enrichment of the indicated metabolites after a [U-13C]-glutamine bolus (n=6,5,6, group labels as above). (i) Total levels of Krebs cycle intermediates (n=6,5,6, group labels as above; GC-MS). (j) 13C-enrichment of malate isotopologues in the experiment shown in Fig. 2 h (n=6,6,6,6). All data are presented as mean ± S.D. Statistical analysis was performed using a two-tailed Student’s t-test. See also Extended Data Fig. 2, 3 and 4.
Fig. 3.
Fig. 3.. Enzymes that use glutamine as an amide donor sustain glutamine catabolism when glutaminase activity is inhibited.
(a) The fate of the amide group of glutamine. (b) A diagram depicting the enzymes that can utilize glutamine as an amide donor, representing the pathways involved in the glutaminase-independent glutamine catabolism. (c) Heat map of transcriptome data showing the gene expression of enzymes that use glutamine as an amide donor (n=4 mice per group) in tumours initiated in LAP-tTA/TRE-MYC mice by weaning them into regular chow. Mice kept on a doxycycline-containing diet are used as controls. (d) Representative images of 1H-15N 2D-HMBC NMR spectra of tumours from mice infused with amido-15N-glutamine, or cells derived from CT and Gls1KO/shGls2 tumours incubated with amido-15N-glutamine for 48 h, showing nitrogen incorporation into the indicated metabolites. (e) Effect of the glutamine antagonist and transamidase inhibitor DON (50 mg/kg, 4 h) on the 13C-incorporation into metabolites in CT/shLuc and Gls1KO/shGls2 tumours from mice administered with a [U-13C]-glutamine bolus (n=3 mice per group; GC-MS). (f) The effect of DON on the incorporation of either [U-13C]-glutamine or [U-13C]-glucose-derived carbons into malate in CT and Gls1KO/shGls2 tumour cells (3 h; n=3 independent experiments; GC-MS). All data are presented as mean ± S.D. Statistical analysis was performed using a two-tailed Student’s t-test. (g and h) Combination of glutaminase inhibition and DON on proliferation of HCCMYC cells: either HCCMYC- Gls1KO/shGls2 (g) or HCCMYC-CT cells (h) were treated with the indicated concentrations of CB-839 and DON, or their indicated combinations. Growth was monitored in an IncuCyte Live-Cell analysis system. Representative curves from three independent experiments are shown. Data are presented as mean ± S.D. See also Extended Data Fig. 2, 5 and 6.
Fig. 4.
Fig. 4.. Inhibiting glutaminase and amidotransferases has a synergistic effect on mouse and human cell proliferation in vitro and in vivo.
(a) HCT116 cells treated with DON and/or CB-839 at the indicated concentrations. Representative curves from one of three independent experiments with 3 replicates are shown. Data are mean ± S.D. (b) Representative images of colony formation assay of organoids derived from APCmin tumours after seven days in culture with the indicated treatments. Scale bar is 500 μm. (c) Left panel: Quantitation of the organoid formation assay in Fig. 4b. Data are mean ± S.D. from three independent experiments. Right panel: Cell Titer Glo luciferase assay of APCmin organoids treated with the indicated treatments. Data represents three independent experiments with three replicates each. (d) Representative images of colony formation assay of two patient derived organoids after 19 days in culture (Patient A) and 10 days in culture (Patient B) with the indicated treatments. Scale bar is 500 μm. (e) Top panel: Quantitation of the organoid formation assay in Fig. 4d. Bottom panel: Cell Titer Glo luciferase assay of patient derived organoids in Fig. 4d treated with the indicated treatments. In both panels, the data represents three independent experiments with three replicates each. (f) The effect of combining a glutaminase inhibitor and DON on the progression of HCT116 xenografts. Mice were injected with 5 million cells and treated with 100 mg/Kg of the glutaminase inhibitor Compound 27, p.o. daily, and/or 25 mg/kg of DON every 72 h i.p. (Vehicle n=13; Compound 27 n=10; DON n=11; Compound 27+DON n=10). (g) Total levels (top) and 13C-enrichment of the indicated metabolites after a [U-13C]-glutamine bolus in the HCT116 xenograft tumours from mice of the experiment shown in (f ) (n= 4 mice per group; GC-MS). All data are presented as mean ± S.D. Statistical analysis was performed using a two-tailed Student’s t-test. *, p < 0.05; **, p< 0.01; ***, p < 0.001; #, p < 0.05; ##, p< 0.01; ***, p < 0.001; α, p < 0.05; αα, p< 0.01; two-tailed t-test (c, e, f, h), and two-way ANOVA (g). In (h) statistical significance of an indicated column is represented by * with respect to the vehicle group, by # in respect to Gls1i C.27 group, and by α in respect to DON group. Complete list of exact p-values is provided as a source data file.
Fig. 5.
Fig. 5.. A cross-compensatory metabolism of glucose and glutamine sustains mitochondrial metabolic pools and MYC-induced tumourigenesis.
(a-d) Hk2 deletion in MYC-driven tumours decreases glycolysis but does not affect tumour burden. Tumours were induced by hydrodynamics-based transfection of MYC/MCL1 2 weeks after tamoxifen-induced liver-specific CRE activation in Hk2fl/fl/Alb-CreERT2/Rosa26eYFP and Alb-CreERT2/Rosa26eYFP mice. (a) Western blot demonstrating the absence of HK2 in Hk2KO tumours (n=3,5,5). (b) Kaplan-Meier survival curve (CT n=22; Hk2KO n=15). P-value was calculated by Mantel–Cox test. (c) Total content, 13C-enrichment, and total 13C content of lactate and (d) 13C-enrichment of Krebs cycle intermediates in CT and Hk2KO tumours after a [U-13C]-glucose bolus (n=6 mice per group; GC-MS). (e-g) Deletion of both Gls1 and Hk2 affects MYC-induced tumourigenesis. Simultaneous Gls1 and Hk2 gene deletion and cell transformation by MYC were achieved by co-injection of pT3-CMV-Cre with c-MYC and MCL1-expressing plasmids. (e) Kaplan-Meier survival curve (CT n=11; Gls1KO/Hk2KO n=16). P-value was calculated by Mantel–Cox test. (f) Total content of Krebs cycle intermediates and 2-hydroxybutyrate (n=8,9, group labels as above; GC-MS). (g) AMP/ATP and GMP/GTP ratios (n=8,9, group labels as above; LC-MS). All data are presented as mean ± S.D. Statistical analysis was performed using a two-tailed Student’s t-test. (h) HCCMYC-CT and HCCMYC-Gls1KO/shGls2 tumour cells were treated with either 0.5 or 1 mM 2-DG and growth was monitored in an IncuCyte Live-Cell analysis system. Representative curves from one of three independent experiments with three replicates are shown. Data represents means ± S.D. (i) HCCMYC-CT and HCCMYC-Gls1KO/shGls2 tumour cells were treated with 100 μM UK5099 for 48 h. Crystal violet staining from a representative of three independent experiments is shown. See also Extended Data Fig. 2 and 7.
Fig. 6.
Fig. 6.. Lipid demands of tumours are fulfilled by a joint effort of de novo synthesis and uptake.
(a-d) Fasn deletion in MYC-driven tumours ablates lipogenesis but does not significantly affect tumour burden. Tumours were induced by hydrodynamics-based transfection of MYC/MCL1 2 weeks after tamoxifen-induced liver-specific CRE activation in Fasnfl/fl/Alb-CreERT2/Rosa26eYFP and Alb-CreERT2/Rosa26eYFP mice. (a) Western blot demonstrating the absence of FASN in FasnKO tumours (n=3,5,5). (b) Kaplan-Meier survival curve (CT n=22; FasnKO n=14). P-value was calculated by Mantel–Cox test. (c and d), 13C-enrichment of citrate (n= 4,3,3,4,4; GC-MS) (c) and palmitic acid (n=5,4,4,5,5; GC-MS) (d) in the indicated tissues after a [U-13C]-glucose infusion. (e and f) Direct fluorescence images of tissues of interest showing tumoural lipid uptake after FasnKO mice where intraperitoneally injected with fluorescently-labelled fatty acids, Bodipy™ FL C16 (e) or fluorescently-labelled lipoproteins, Dil-LDL (f). Representative images of three mice per condition are shown. (g) Kaplan-Meier Survival Curve of tumour bearing CT and FasnKO fed with the LFD (CT on the LFD n=10; FasnKO on the LFD n=10). P-value was calculated by Mantel–Cox test. Gene deletion was achieved during tumour induction by co-injection of pT3-CMV-Cre with c-MYC and MCL1-expressing plasmids in Fasnfl/fl and WT mice. Animals were moved onto an indicated diet one week later. (h) The effect of combining the LFD and Fasn inhibitor, Fasnall, on the progression of MYC tumour cell-derived allografts (Veh/9% fat diet n= 9; Fasnall/9% fat diet n= 9; Veh/4% fat diet n= 11; Fasnall/4% fat diet n= 11). All data are presented as mean ± S.D. Statistical analysis was performed using a two-tailed Student’s t-test. In (c) *, p < 0.05; **, p< 0.01; ***, p < 0.001, with respect to its corresponding adjacent liver; # with respect to the normal liver; α with respect to FasnKO tumours. See also Extended Data Fig. 2 and 8.
Fig. 7.
Fig. 7.. Depleting serine and glycine in tumours requires simultaneous intervention against endogenous production and a circulating supply.
Psat1 KO was induced in hepatocytes of Psat1fl/fl/Alb-CreERT2/Rosa26eYFP mice by tamoxifen administration followed by hydrodynamics-based transfection of MYC/MCL1. (a) PSAT1 links glycolysis, glutaminolysis and TCA cycle. PSAT1 transfers the amino group from glutamate to the glucose derived phosphopyruvate, and generates Krebs cycle intermediate, α-ketoglutarate, and phosphoserine. (b) Western blot demonstrating the absence of PSAT1 in Psat1KO tumours (n=3,5,5). (c) Kaplan-Meier survival curve (CT n=22; Psat1KO n=7). P-value was calculated by Mantel–Cox test. (d) Total content, and 13C-enrichment of serine and glycine in the indicated tissues after a [U-13C]-glucose infusion (Normal livers n=6; CT tumours n=5; Psat1KO tumours n=5; GC-MS). (e) Schedule for the experiment combining Psat1 knockout and -SG diet. (f) Kaplan-Meier survival curve (CT on the Control diet n=6; Psat1KO on the Control diet n=10; CT on the –SG diet n=8; Psat1KO on the –SG diet n=11). P-value was calculated by Mantel–Cox test. (g) Total content, and 15N-enrichment of serine and glycine in the indicated tumours after amino-15N-glutamine bolus in mice fed with either the control or the -SG diets (n=5,5,7,7). All data are presented as mean ± S.D. Statistical analysis was performed using a two-tailed Student’s t-test. Complete list of exact p-values is provided as a source data file. See also Extended Data Fig. 2 and 9.

References

    1. Vander Heiden MG & DeBerardinis RJ Understanding the Intersections between Metabolism and Cancer Biology. Cell 168, 657–669, doi:10.1016/j.cell.2016.12.039 (2017). - DOI - PMC - PubMed
    1. Hsu PP & Sabatini DM Cancer cell metabolism: Warburg and beyond. Cell 134, 703–707, doi:10.1016/j.cell.2008.08.021 (2008). - DOI - PubMed
    1. Luengo A, Gui DY & Vander Heiden MG Targeting Metabolism for Cancer Therapy. Cell Chem Biol 24, 1161–1180, doi:10.1016/j.chembiol.2017.08.028 (2017). - DOI - PMC - PubMed
    1. Davidson SM et al. Environment Impacts the Metabolic Dependencies of Ras-Driven Non-Small Cell Lung Cancer. Cell Metab 23, 517–528, doi:10.1016/j.cmet.2016.01.007 (2016). - DOI - PMC - PubMed
    1. Lyssiotis CA & Kimmelman AC Metabolic Interactions in the Tumor Microenvironment. Trends Cell Biol 27, 863–875, doi:10.1016/j.tcb.2017.06.003 (2017). - DOI - PMC - PubMed

Methods-only References

    1. Mingote S. et al. Genetic Pharmacotherapy as an Early CNS Drug Development Strategy: Testing Glutaminase Inhibition for Schizophrenia Treatment in Adult Mice. Front Syst Neurosci 9, 165, doi:10.3389/fnsys.2015.00165 (2015). - DOI - PMC - PubMed
    1. Schuler M, Dierich A, Chambon P & Metzger D. Efficient temporally controlled targeted somatic mutagenesis in hepatocytes of the mouse. Genesis 39, 167–172, doi:10.1002/gene.20039 (2004). - DOI - PubMed
    1. Srinivas S. et al. Cre reporter strains produced by targeted insertion of EYFP and ECFP into the ROSA26 locus. BMC Dev Biol 1, 4, doi:10.1186/1471-213x-1-4 (2001). - DOI - PMC - PubMed
    1. Chow EK, Fan LL, Chen X & Bishop JM Oncogene-specific formation of chemoresistant murine hepatic cancer stem cells. Hepatology 56, 1331–1341, doi:10.1002/hep.25776 (2012). - DOI - PMC - PubMed
    1. Tao J. et al. Distinct anti-oncogenic effect of various microRNAs in different mouse models of liver cancer. Oncotarget 6, 6977–6988, doi:10.18632/oncotarget.3166 (2015). - DOI - PMC - PubMed

Publication types