. 2020 Jul 21;10(1):12033.
doi: 10.1038/s41598-020-68750-4.

Vertical distribution of brittle star larvae in two contrasting coastal embayments: implications for larval transport

Affiliations

Vertical distribution of brittle star larvae in two contrasting coastal embayments: implications for larval transport

Morgane Guillam et al. Sci Rep. .

Abstract

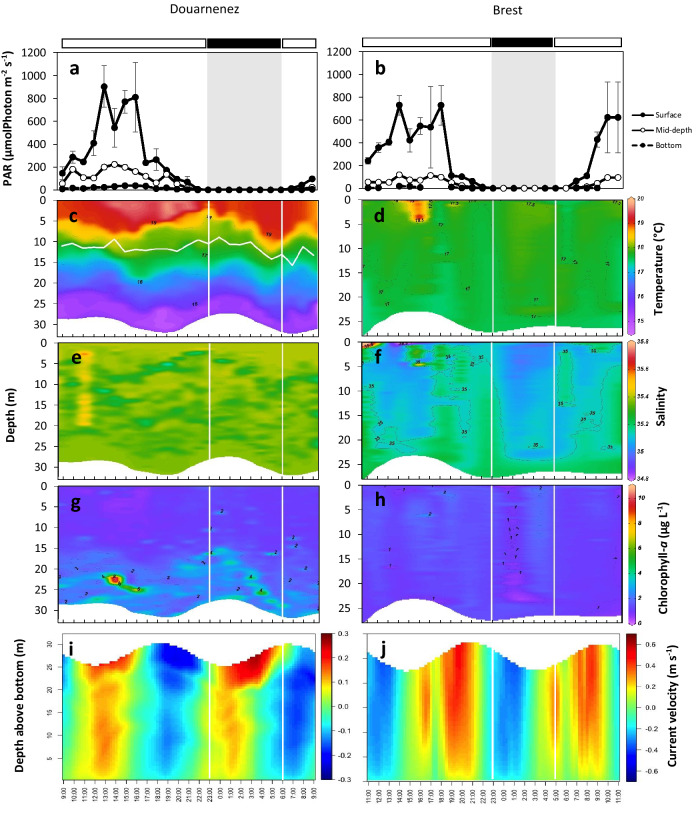
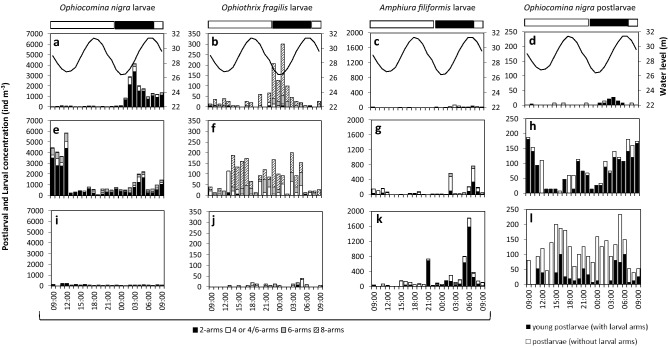
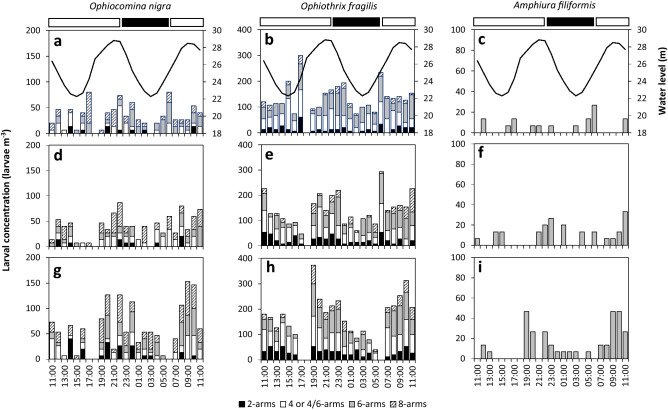
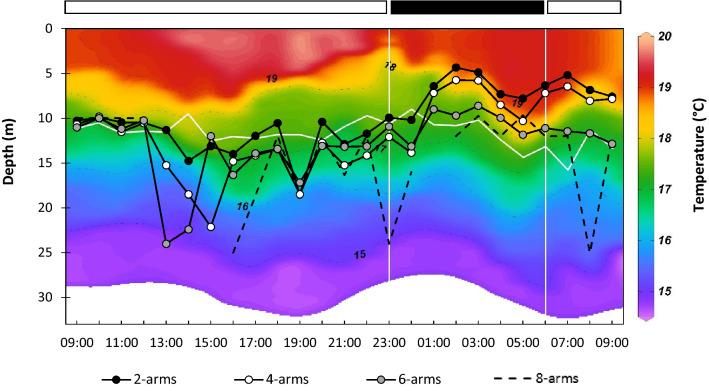
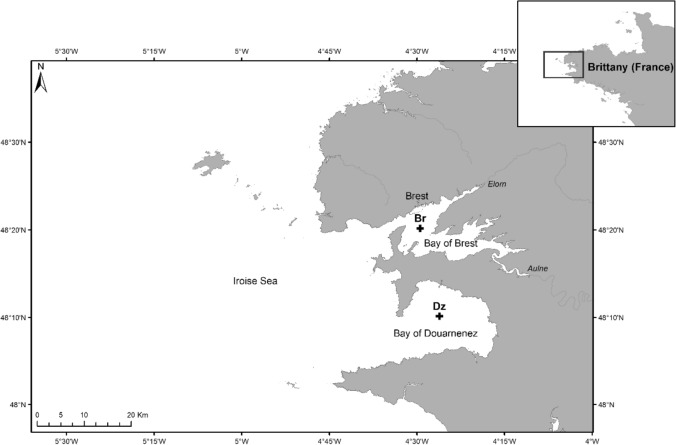
The ability of marine invertebrate larvae to control their vertical position shapes their dispersal pattern. In species characterized by large variations in population density, like many echinoderm species, larval dispersal may contribute to outbreak and die-off phenomena. A proliferation of the ophiuroid Ophiocomina nigra was observed for several years in western Brittany (France), inducing drastic changes on the benthic communities. We here studied the larval vertical distribution in this species and two co-occurring ophiuroid species, Ophiothrix fragilis and Amphiura filiformis, in two contrasting hydrodynamic environments: stratified in the bay of Douarnenez and well-mixed in the bay of Brest. Larvae were collected at 3 depths during 25 h within each bay. In the bay of Brest, all larvae were evenly distributed in the water column due to the intense vertical mixing. Conversely, in the bay of Douarnenez, a diel vertical migration was observed for O. nigra, with a night ascent of young larvae, and ontogenetic differences. These different patterns in the two bays mediate the effects of tidal currents on larval fluxes. O. fragilis larvae were mainly distributed above the thermocline which may favour larval retention within the bay, while A. filiformis larvae, mostly concentrated near the bottom, were preferentially exported. This study highlighted the complex interactions between coastal hydrodynamics and specific larval traits, e.g. larval morphology, in the control of larval vertical distribution and larval dispersal.


Conflict of interest statement

The authors declare no competing interests.

Figures

Figure 1
Figure 1
Vertical profiles of environmental parameters in the bay of Douarnenez (left column) and the bay of Brest (right column). (a, b) Light intensity: each point corresponds to the mean of PAR values at a given hour and layer, and the vertical bars are the standard deviation. Grey shaded area indicates nighttime. (c, d) Temperature, (e, f) salinity, (g, h) chlorophyll-a concentration, and (i, j) current velocity and direction; positive values indicate eastward currents. Horizontal black and white bars indicate nighttime and daytime, respectively. Horizontal white line in c is the thermocline depth. Vertical white lines correspond to times of sunset and sunrise (see “Methods” section).
Figure 2
Figure 2
Larval and postlarval concentrations of Ophiocomina nigra, and larval concentrations of Ophiothrix fragilis and Amphiura filiformis at three depths in the bay of Douarnenez in relation to diel and tidal cycles. (ad) Surface (3 m), (eh) mid-depth (10–12 m), and (il) bottom (24–26 m). The black line represents the water level (m). Horizontal black and white bars indicate nighttime and daytime, respectively. The proportion of the different developmental stages is indicated.
Figure 3
Figure 3
Larval concentrations of Ophiocomina nigra, Ophiothrix fragilis and Amphiura filiformis at three depths in the bay of Brest in relation to diel and tidal cycles. (ac) Surface (1.5 m), (df) mid-depth (10 m) and (gi) bottom (17–26 m). The black line represents the water level (m). Horizontal black and white bars indicate nighttime and daytime, respectively. The proportion of the different developmental stages is indicated.
Figure 4
Figure 4
Vertical distribution of the larvae of Ophiocomina nigra in the bay of Douarnenez. Mean depth distribution (MDD) of the different larval stages, superimposed on temperature profiles. The horizontal white line corresponds to the location of the thermocline. The horizontal black and white bars indicate nighttime and daytime, respectively.
Figure 5
Figure 5
Mean percentage of larval concentration at the three depths (S, surface; M, mid-depth; B, bottom) for Ophiocomina nigra (a) and Ophiothrix fragilis (b), during daytime (white bars) and nighttime (black bars), in the bay of Brest and the bay of Douarnenez. Fractions of total counts were computed separately for each larval stage, and averaged for each depth interval across daytime and nighttime samples. Error bars are standard errors.
Figure 6
Figure 6
Larval fluxes of Ophiocomina nigra (a, d, g, j), Ophiothrix fragilis (b, e, h, k), and Amphiura filiformis (c, f, i, l), in the bay of Douarnenez (af) and the bay of Brest (gl) with the associated water level. Left column (ac, gi): larval flux at three depths (blue, surface; red, middle; green, bottom). Right column (df, jl): mean larval flux throughout the water column. A positive flux corresponds to an eastward flux of larvae into the bay. LT corresponds to low tide and HT corresponds to high tide.
Figure 7
Figure 7
Location of the sampling sites in the bay of Brest (Br) and the bay of Douarnenez (Dz), Brittany (France). The extent of the map represents that of the local high resolution model (Arcgis 10.3.1.).

References

    1. Uthicke S, Schaffelke B, Byrne M. A boom-bust phylum? Ecological and evolutionary consequences of density variations in echinoderms. Ecol. Monogr. 2009;79:3–24.
    1. Sala E, Knowlton N. Global marine biodiversity trends. Annu. Rev. Environ. Resour. 2006;31:93–122.
    1. Fabricius KE, Okaji K, De’ath G. Three lines of evidence to link outbreaks of the crown-of-thorns seastar Acanthaster planci to the release of larval food limitation. Coral Reefs. 2010;29:593–605.
    1. Hock K, Wolff NH, Condie SA, Anthony KRN, Mumby PJ. Connectivity networks reveal the risks of crown-of-thorns starfish outbreaks on the Great Barrier Reef. J. Appl. Ecol. 2014;51:1188–1196.
    1. Wolfe K, Graba-Landry A, Dworjanyn SA, Byrne M. Larval phenotypic plasticity in the boom-and-bust crown-of-thorns seastar, Acanthaster planci. Mar. Ecol. Prog. Ser. 2015;539:179–189.

Publication types

LinkOut - more resources