. 2020 Jan;2(1):62-80.
doi: 10.1038/s42255-019-0159-z. Epub 2020 Jan 20.

The creatine-phosphagen system is mechanoresponsive in pancreatic adenocarcinoma and fuels invasion and metastasis

Affiliations

The creatine-phosphagen system is mechanoresponsive in pancreatic adenocarcinoma and fuels invasion and metastasis

Vassilis Papalazarou et al. Nat Metab. 2020 Jan.

Abstract

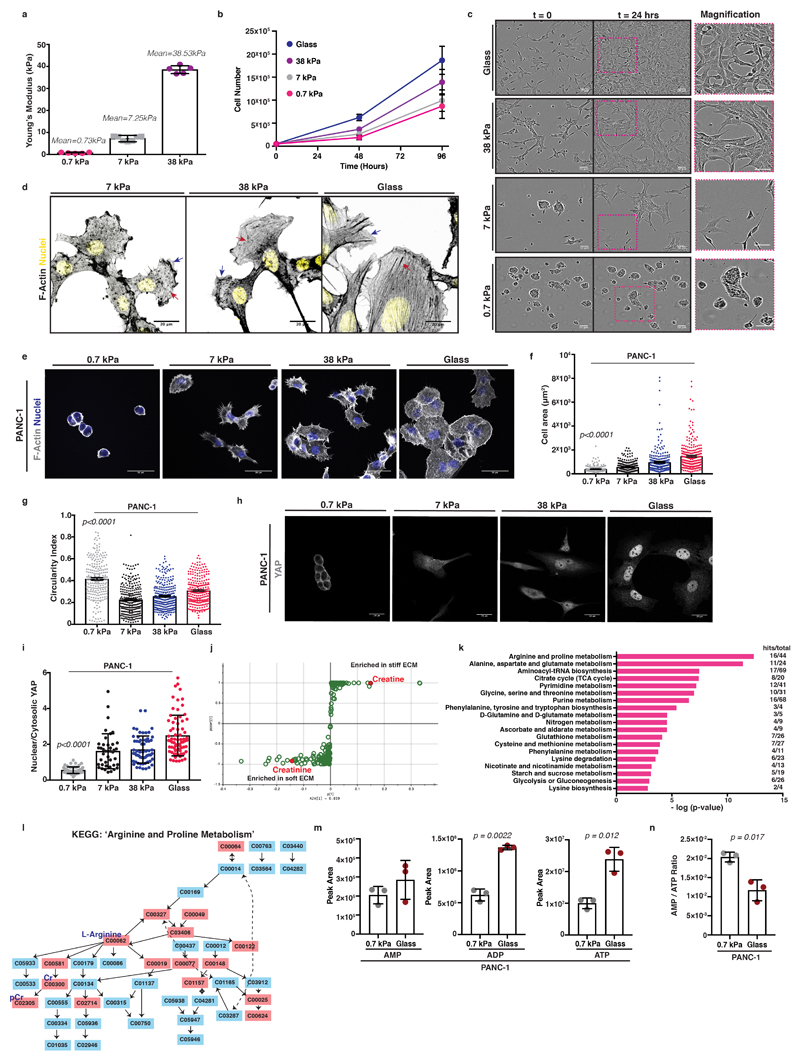
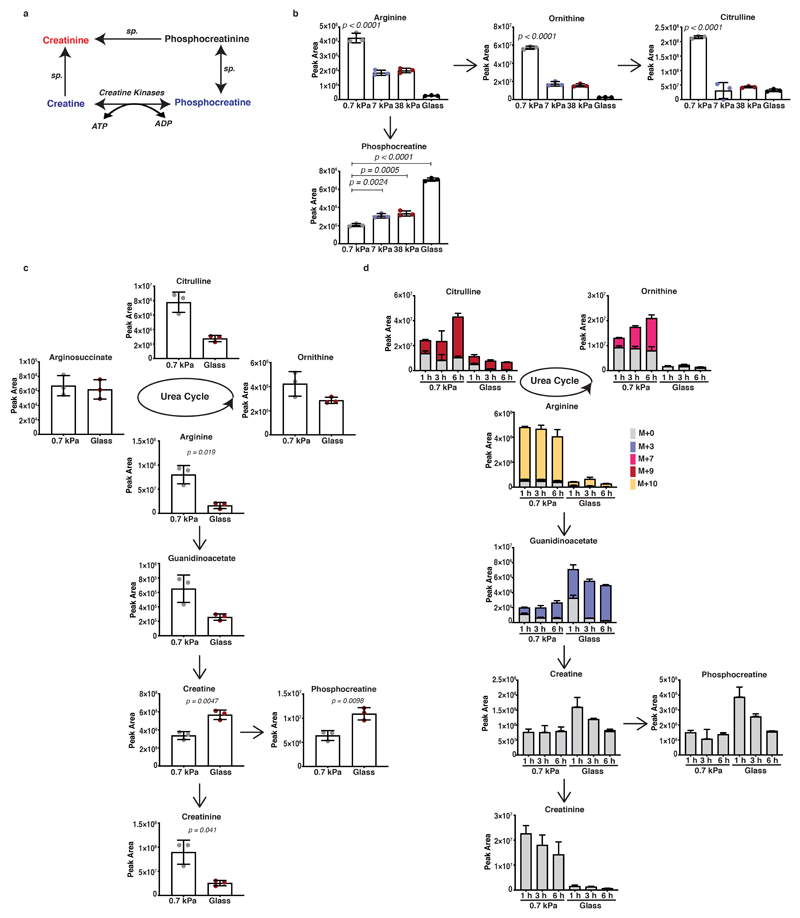
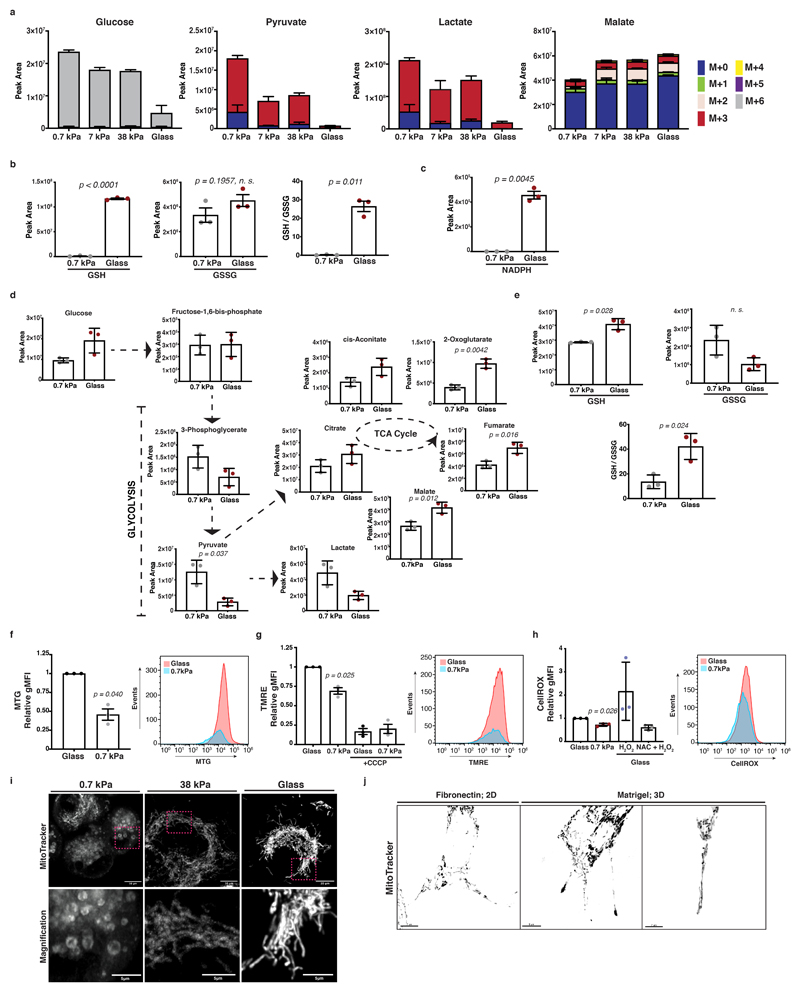
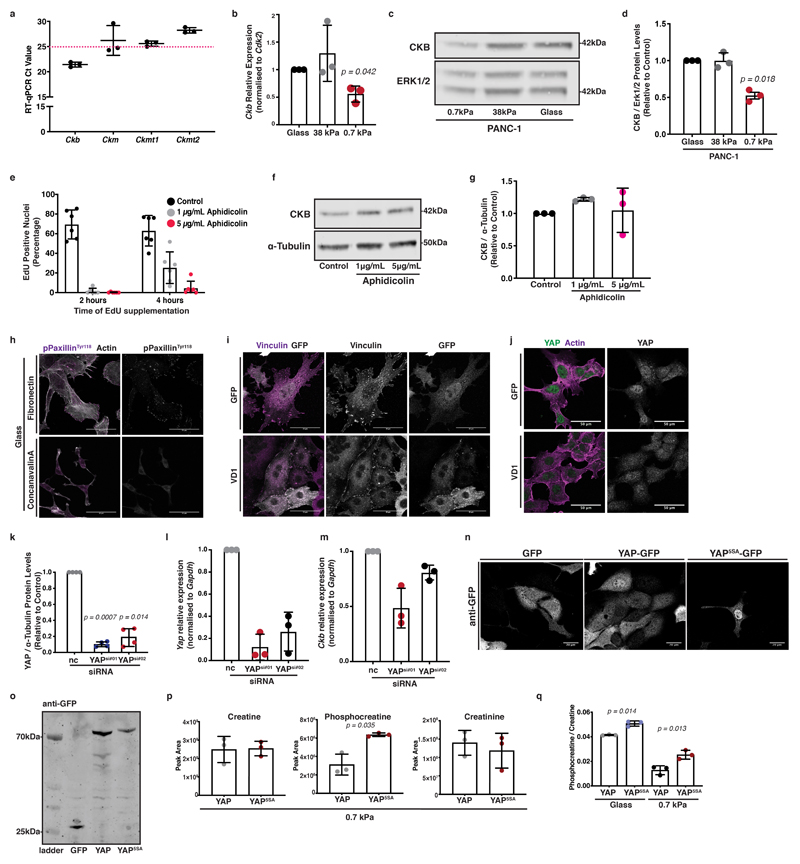
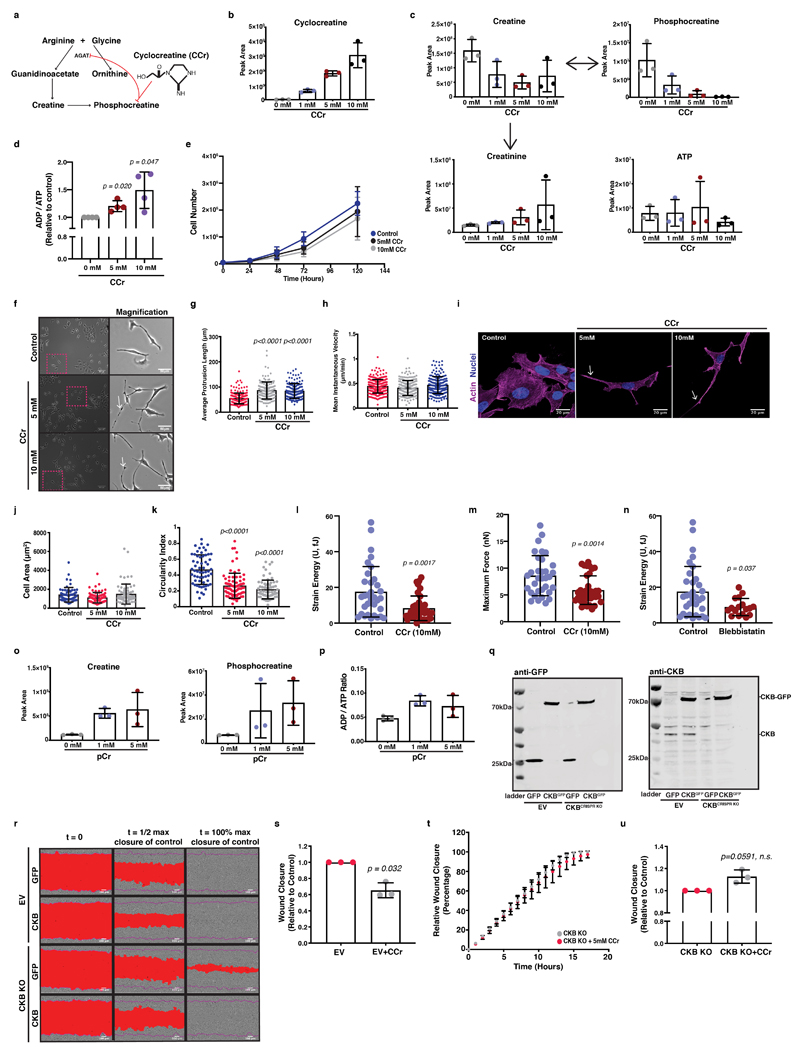
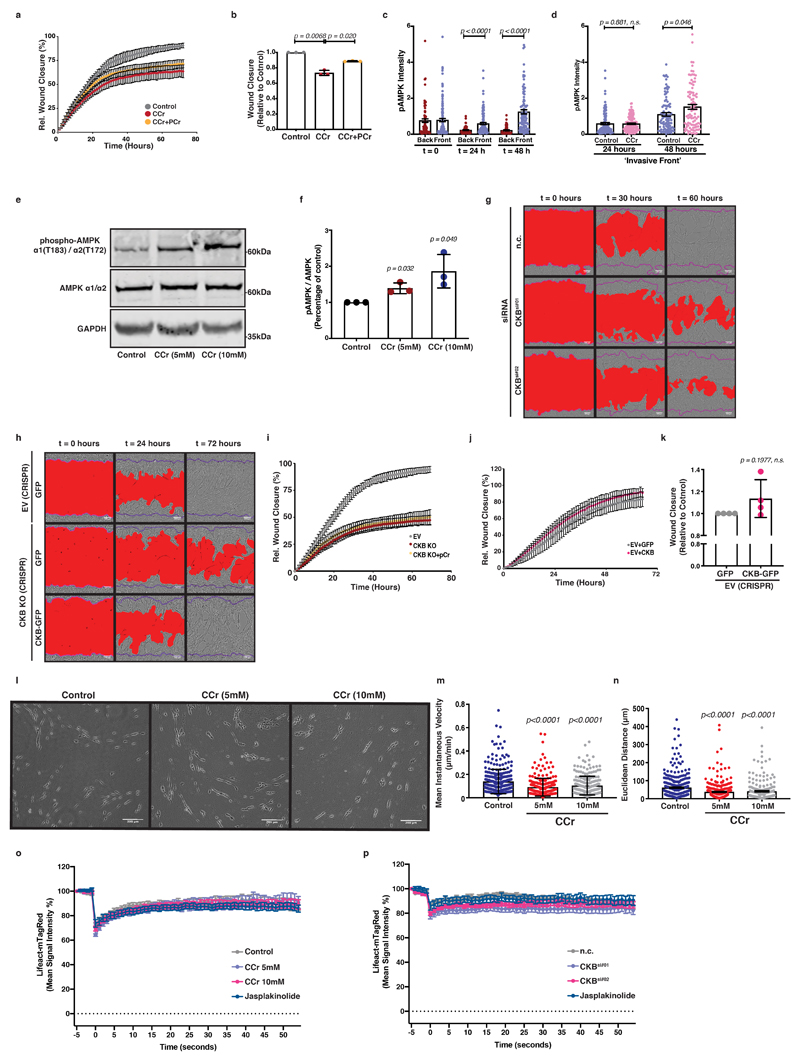
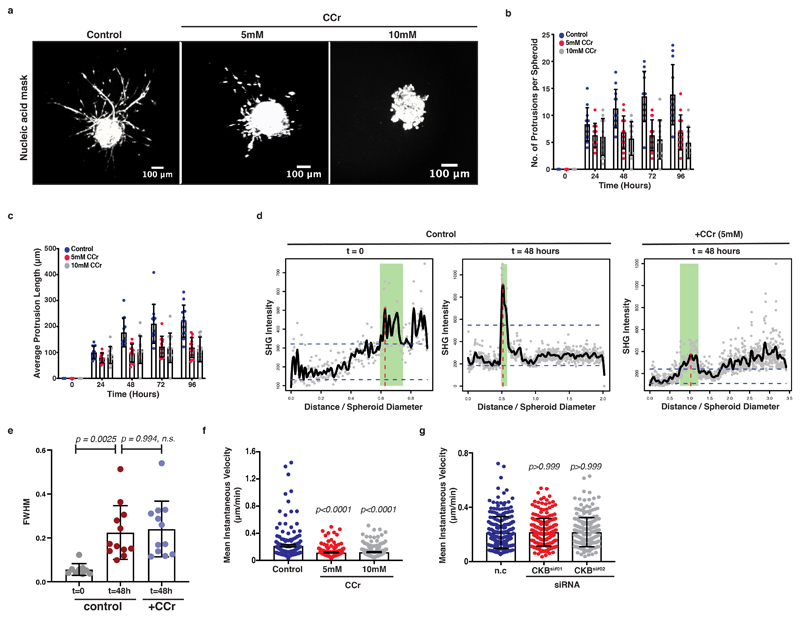
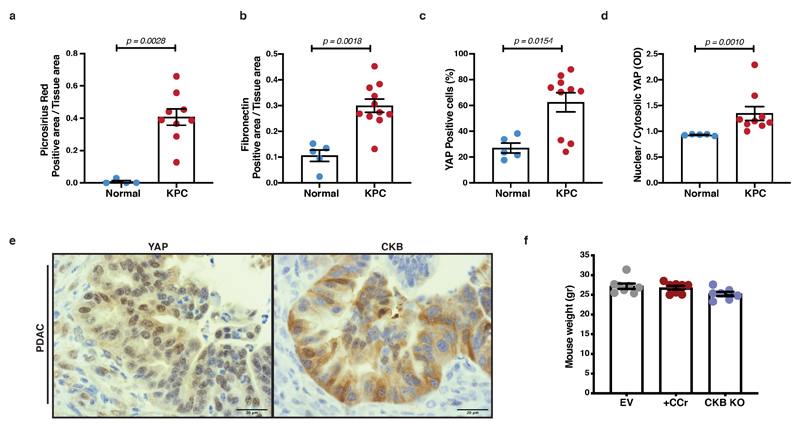
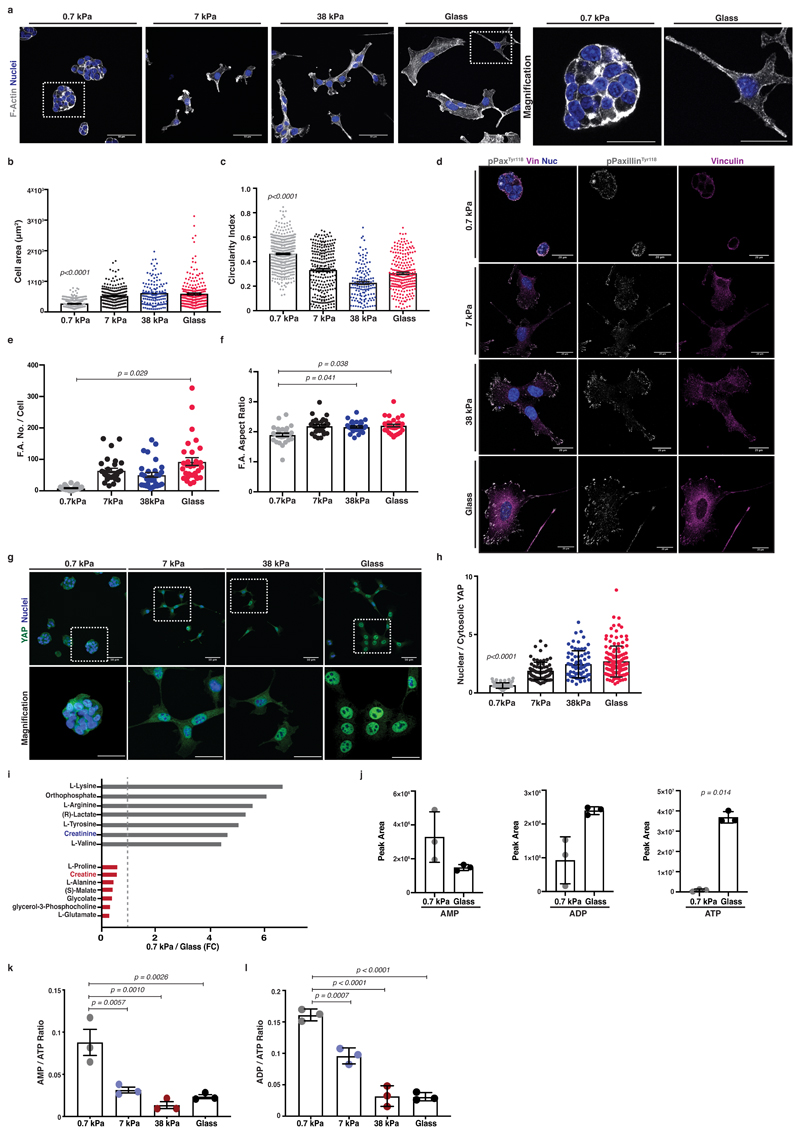
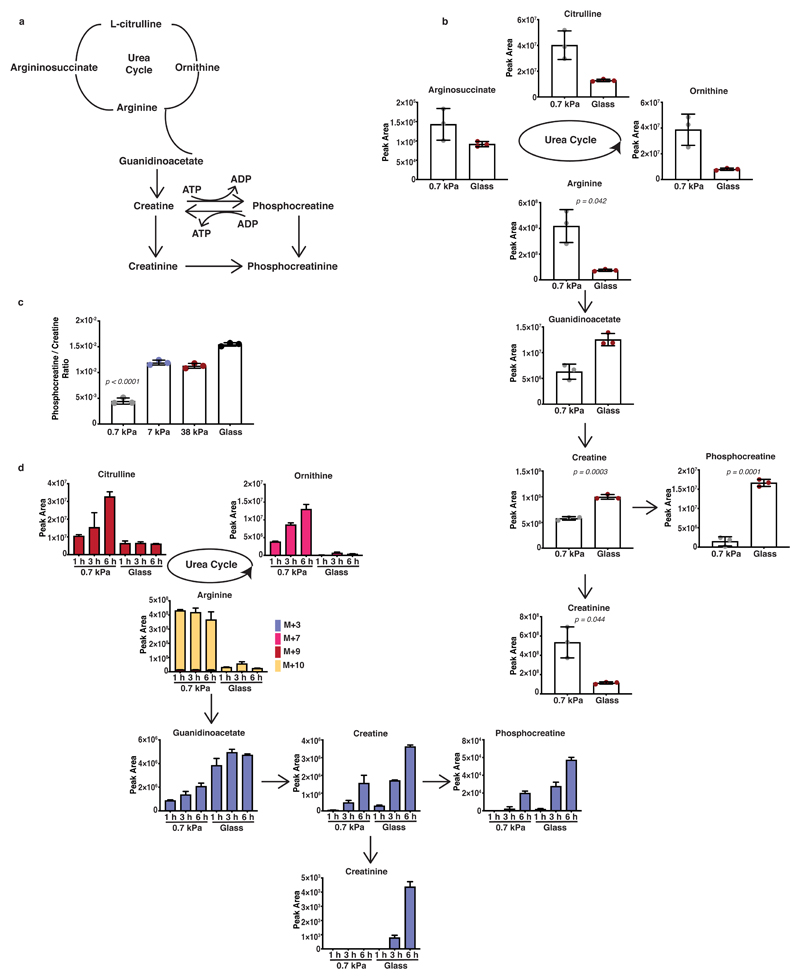
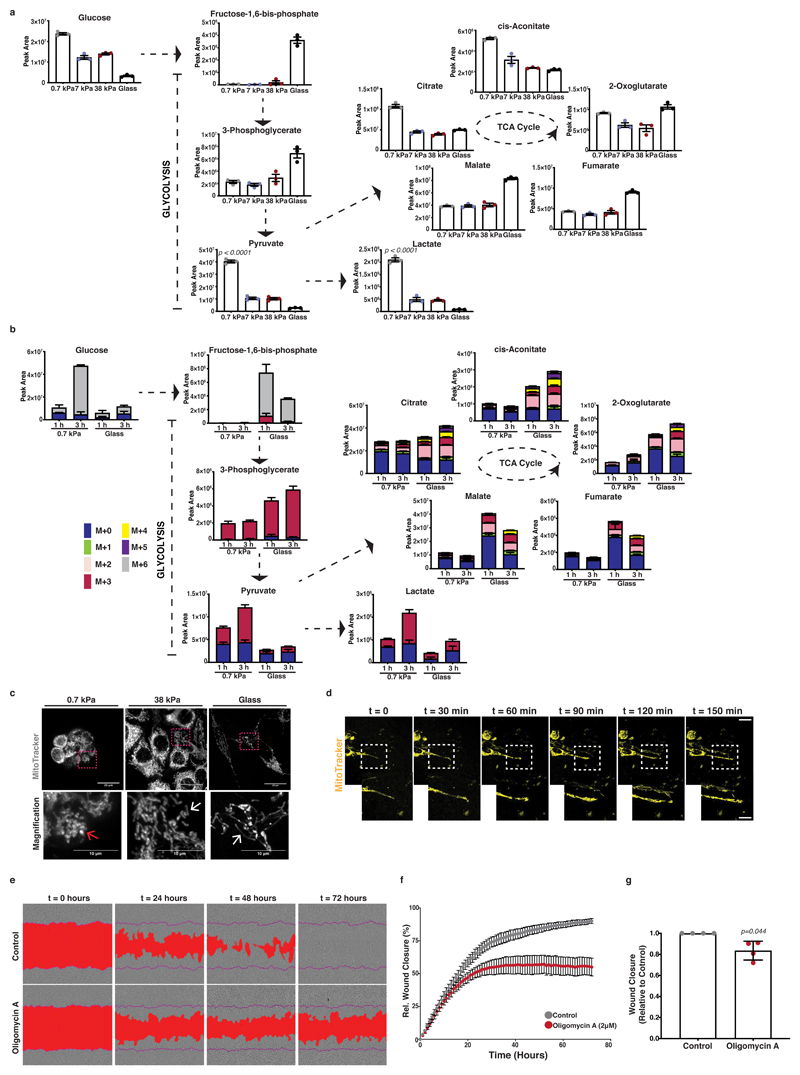
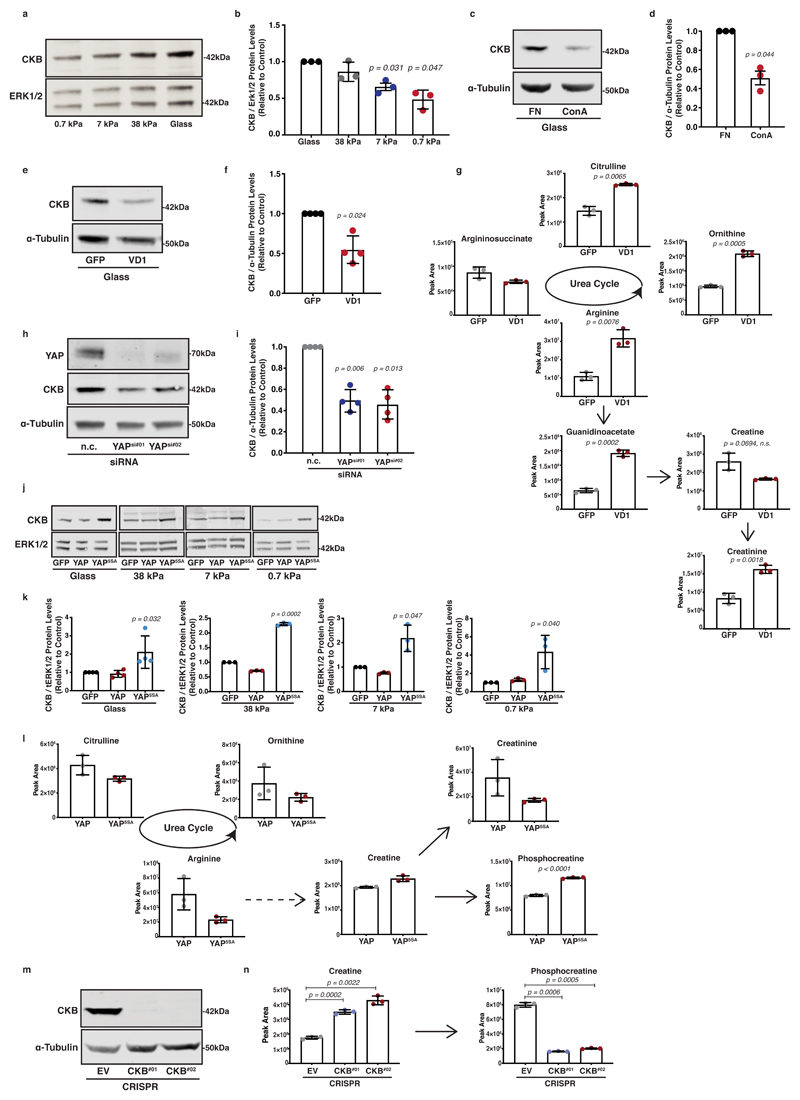
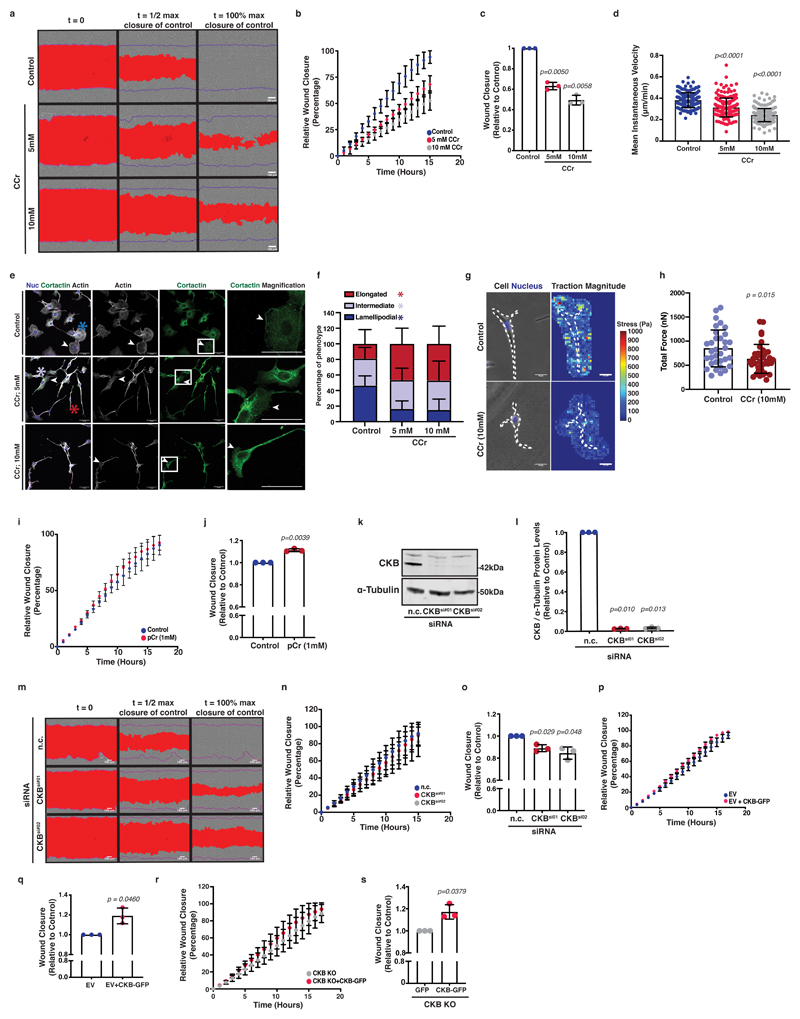
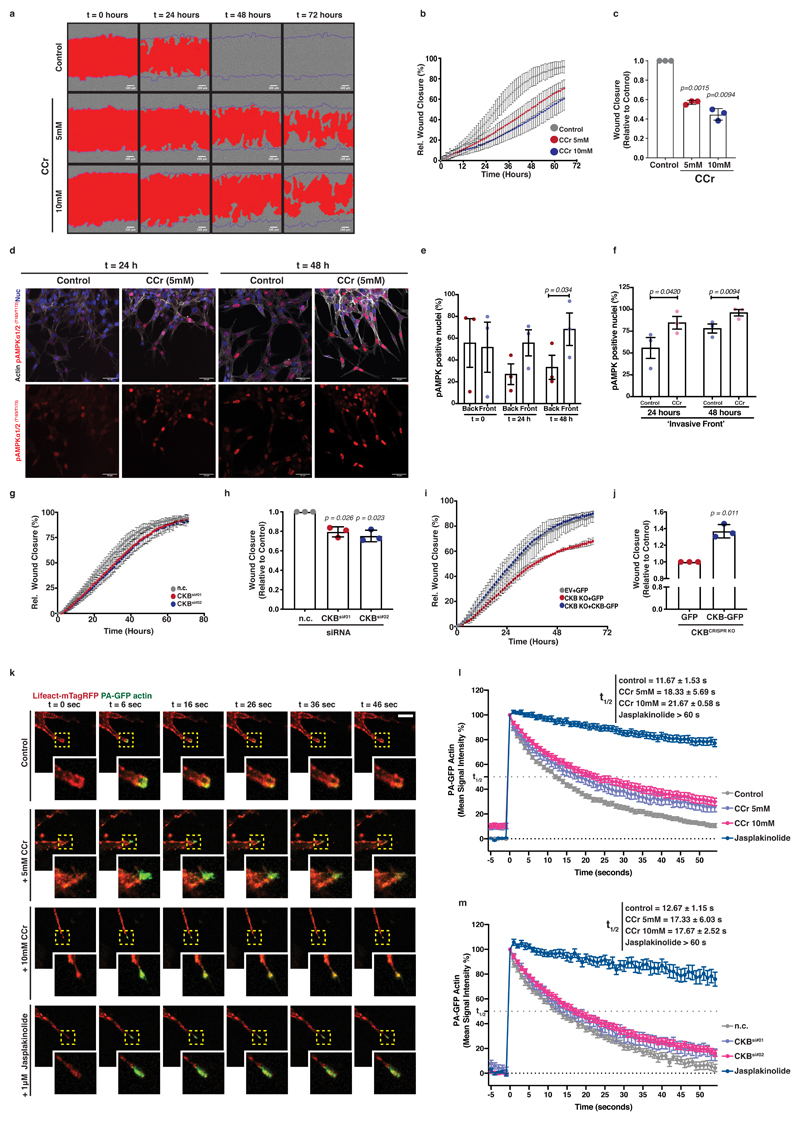
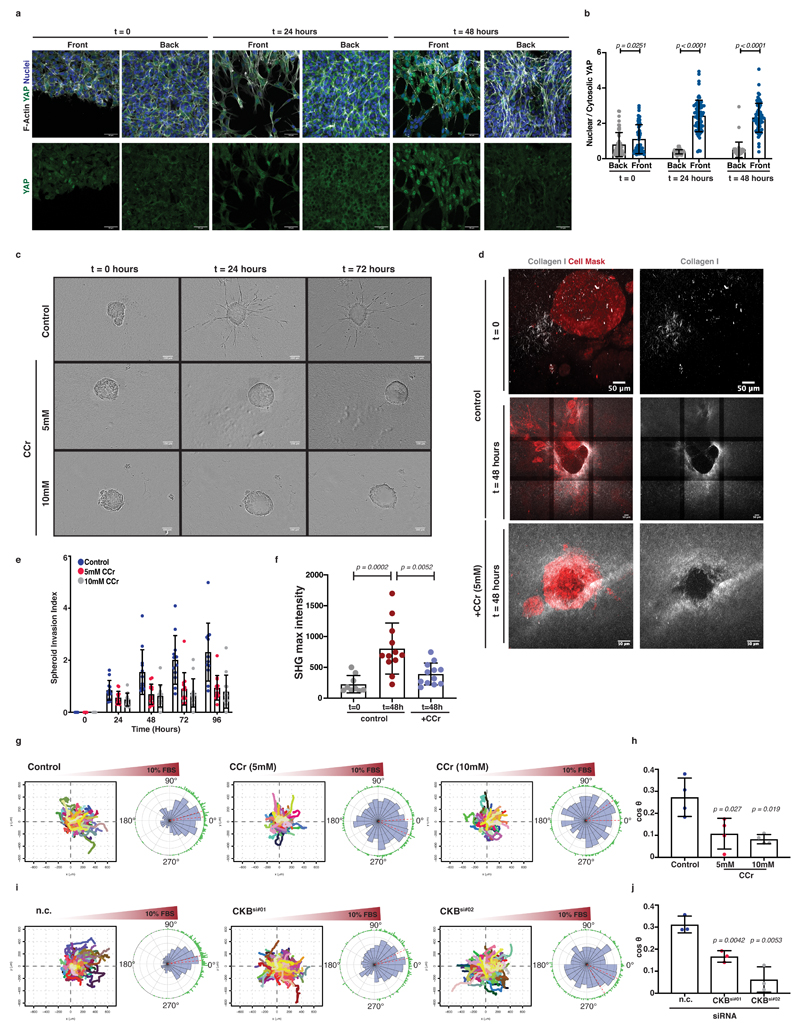
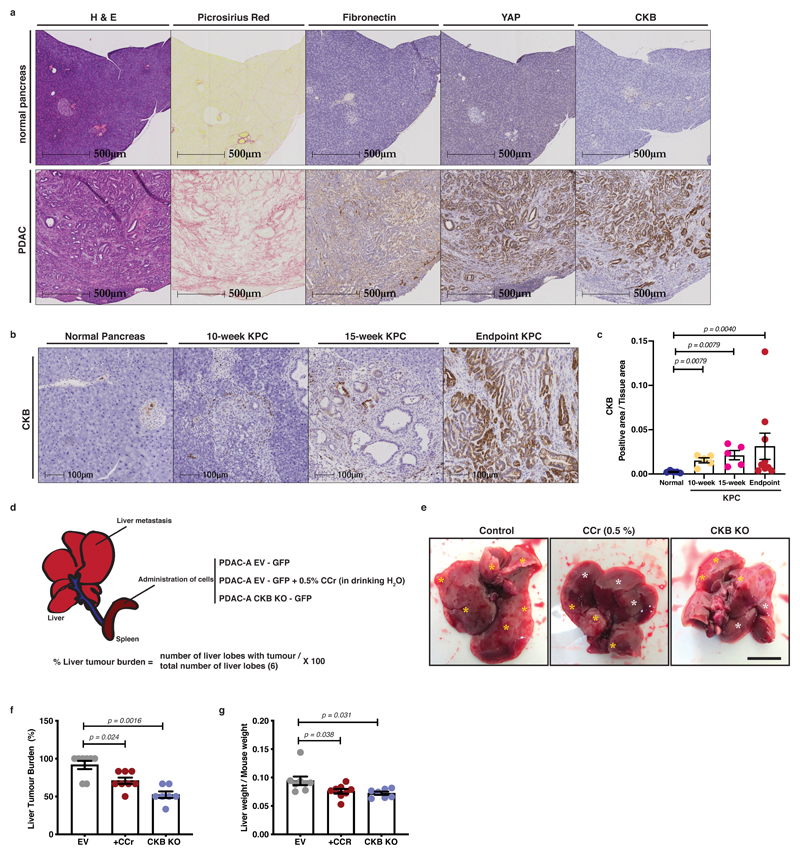
Pancreatic ductal adenocarcinoma is particularly metastatic, with dismal survival rates and few treatment options. Stiff fibrotic stroma is a hallmark of pancreatic tumours, but how stromal mechanosensing affects metastasis is still unclear. Here, we show that mechanical changes in the pancreatic cancer cell environment affect not only adhesion and migration, but also ATP/ADP and ATP/AMP ratios. Unbiased metabolomic analysis reveals that the creatine-phosphagen ATP-recycling system is a major mechanosensitive target. This system depends on arginine flux through the urea cycle, which is reflected by the increased incorporation of carbon and nitrogen from L-arginine into creatine and phosphocreatine on stiff matrix. We identify that CKB is a mechanosensitive transcriptional target of YAP, and thus it increases phosphocreatine production. We further demonstrate that the creatine-phosphagen system has a role in invasive migration, chemotaxis and liver metastasis of cancer cells.


Conflict of interest statement

Competing Interests:

The authors declare no competing interests.

Figures

Extended Data Fig. 1
Extended Data Fig. 1. Pancreatic cancer cells are mechanosensitive and untargeted metabolomic profiling reveals metabolic reprogramming via ECM mechanics
Panels b-n, cells atop 0.7-38 kPa fibronectin-coated hydrogels or glass. (a) Polyacrylamide hydrogel elasticity (kPa). Values area mean ±SD from n=5, 0.7kPa, n=7, 7kPa and n=5, 38kPa hydrogels from 3 independent preparations. (b) Growth curves of KPC cells. Values are mean ±SEM from 3 independent experiments. Statistical significance assessed by two-tailed Mann-Whitney U test, on ‘glass vs 0.7kPa’ p=0.005 at 48h and p=0.014 at 96h, on ’38kPa vs 0.7kPa’ p=0.0086 at 48h and p=0.094 at 96h. (c) Representative images of KPC cells. Scale bars, 50μm. Right panel; Magnification of areas indicated by a dashed box. Scale bars, 25μm. (d) Immunofluorescence of KPC cells showing F-actin (black) and nuclei (gold). Scale bars, 20μm. Blue arrows lamellipodia and red arrows stress fibres. (e) Immunofluorescence of PANC-1 cells showing F-actin (grey) and nuclei (blue). Scale bars, 50 μm. (f-g) Quantification of (e) showing cell area (μm2) (f) and circularity index (g). Values are mean ±SEM from n=240, 0.7kPa, n=268, 7 kPa, n=276, 38kPa and n=256 glass cells from 3 independent experiments. Kruskal-Wallis with Dunn’s multiple comparisons test. (h) Immunofluorescence of PANC-1 cells from (e) showing YAP (grey). Scale bars, 50μm. (i) Quantification of (h) showing nuclear to cytosolic YAP ratio. Values are mean ±SD from n=66, 0.7kPa, n=41, 7kPa, n=61, 38kPa and n=72 on glass. Cells from 3 independent experiments. Kruskal-Wallis test with Dunn’s multiple comparisons test. (j) σ-plot demonstrating metabolite enrichment on soft (0.7kPa, left) and stiff (glass, right) KPC cells. (k) Bar graph pathway enrichment analysis of (j) clustered by -log(p-value). Untargetted analysis on n=3 ‘0.7kPa’ and n=3 ‘glass’ independent cultures on same day. Statistics: Fisher’s exact Test. (l) ‘Arginine and Proline’ KEGG pathway from (k). Individual metabolites labelled by KEGG number (https://www.genome.jp/kegg/kegg3.html) and enriched metabolites highlighted (red). Cr: Creatine; pCr: Phosphocreatine. (m-n) AMP, ADP and ATP levels (m) and AMP to ATP ratio (n) of PANC-1 cells. Values are mean ±SD from 3 biological replicates on same day. Two-tailed unpaired t-test with Welch’s correction.
Extended Data Fig. 2
Extended Data Fig. 2. ECM stiffness directs creatine metabolism in PDAC cells
(a) Schematic representation of the phosphocreatine circuit. Red indicates metabolite enrichment on soft (0.7kPa) ECM, while blue indicates enrichment on stiff (glass) ECM. (b) Urea cycle and creatine biosynthesis metabolic intermediates of KPC cells cultured on fibronectin-coated 0.7-38 kPa hydrogels and glass coverslips as indicated. Values are mean ± SD from 3 biological replicates within the same day. Statistical significance assessed by one-way ANOVA. (c) Urea cycle and creatine biosynthesis metabolic intermediates of PANC-1 cells cultured as indicated. Values are mean ±SD from 3 biological replicates within the same day. Statistical significance assessed by two-tailed unpaired t-test with Welch’s correction. (d) Arginine-derived labelled carbon and nitrogen incorporation in urea cycle and creatine biosynthesis metabolites of KPC cells cultured as indicated and supplemented with L-arginine-13C615N4 for 1, 3 and 6 hours. Values are mean ±SD from 3 biological replicates within the same day.
Extended Data Fig. 3
Extended Data Fig. 3. Mitochondrial dynamics and respiratory activity are induced by ECM mechanics in pancreatic cancer cells and support invasive behaviour
In a-i, cells were cultured atop of 0.7-38kPa fibronectin-coated hydrogels and glass coverslips. (a) Glucose-derived labelled carbon incorporation in glucose and TCA cycle intermediates of KPC cells as indicated and treated with U-13C6-glucose for 3 hours. (b) GSH, GSSG levels and GSH/GSSG ratio of KPC cells cultured as indicated. (c) NADPH levels of cells from (b). (d) Glycolysis and TCA cycle metabolite levels of PANC-1 cells cultured as indicated. (e) GSH, GSSG levels and GSH/GSSG ratio of PANC-1 cells from (d). (f) Left; Mitochondrial mass (Mitotracker, MTG) of KPC cells as indicated. Values (gMFI) are mean ±SD relative to control (glass) from 3 independent experiments. Right; Representative histogram from left panel. (g) Left; Mitochondrial membrane potential (TMRE) of KPC cells cultured as indicated. CCCP; negative control. Values (gMFI) are mean ±SD relative to control (glass) from 3 independent experiments. Right; Representative histogram from left panel. (h) Left; Cellular ROS (CellROX) of KPC cells cultured as indicated. H2O2; positive, NAC+ H2O2; negative control. Values (gMFI) are mean ±SD relative to control (glass) from 3 independent experiments. Right; Representative histogram from left panel. (i) Top; Maximum intensity projections of z-stack acquisitions of PANC-1 cells cultured as indicated showing labelled mitochondria. Scale bars, 10μm. Bottom; Magnification of areas indicated by a dashed box. Pictures representative of 2 independent experiments. Scale bars, 5μm. (j) Maximum intensity projections of z-stack acquisitions of KPC cells cultured on fibronectin-coated dishes (left) or invading 3D ECM (middle, right) showing labelled mitochondria. Pictures representative of 3 independent experiments. Scale bars, 7μm (left, right) and 8μm (middle). Values in a-e represent mean ±SD from 3 biological replicates performed on the same day. In b,d,e: statistical significance assessed by two-tailed unpaired t-test with Welch’s correction. In f,g,h: statistical significance assessed by two-tailed one-sample t-test on LN transformed values.
Extended Data Fig. 4
Extended Data Fig. 4. The phosphocreatine circuit depends on CKB in pancreatic cancer cells, which is regulated by mechanosensing and YAP activity
(a) qRT-PCR of creatine kinases mRNA in KPC cells. Mean ±SD from 3 independent experiments. (b) Ckb expression in KPC cells. Cdk2: normalisation control. Values mean ±SD and relative to control from 3 independent experiments. Two-tailed one-sample t-test on LN transformed values. (c) PANC-1 cells immunoblotted for CKB and ERK1/2 (loading control). (d) Densitometric quantification of (c). Mean ± SD and relative to control from 3 independent experiments. Two-tailed one-sample t-test on LN transformed values. (e) % of EdU positive nuclei in KPC cells treated with aphidicolin. Mean ±SD from n=6 biological replicates and 2 independent experiments. (f) KPC cells from (e) immunoblotted for CKB and α-Tubulin (loading control). (g) Densitometric quantification of (f). Mean ±SD relative to control from 3 independent experiments. (h) Immunofluorescence of KPC cells on fibronectin or concanavalin A, F-actin (grey) and pPaxillinTyr118 (magenta). Scale bars, 50μm. (i) Immunofluorescence of KPC cells expressing GFP or VD1-GFP, Vinculin (magenta) and GFP (grey). Scale bars, 50μm. (j) Immunofluorescence of cells from (i) showing YAP (Green) and F-actin (magenta). Scale bars, 50μm. In h-j: pictures representative of 3 independent experiments. (k) Densitometric quantification of YAP in YAP-silenced KPC cells. Mean ± SD and relative to control from 4 independent experiments. Two-tailed one-sample t-test on LN transformed values. (l-m) Yap (l) and Ckb (m) expression from (k). Values are mean ± SD and relative to control from 3 independent experiments. Gapdh: normalisation control. (n) Immunofluorescence of KPC cells expressing GFP, GFP-YAP or GFP-YAP5SA showing GFP (grey). Scale bars, 20μm. (o) Cells from (n) were immunoblotted for GFP. Pictures in n-o representative of 3 independent experiments. (p-q) Creatine pathway metabolites (p) and phosphocreatine/creatine ratio (q) of cells from (n) cultured on 0.7 kPa hydrogels. Values are mean ± SD from 3 biological replicates within the same day. Two-tailed unpaired t-test with Welch’s correction.
Extended Data Fig. 5
Extended Data Fig. 5. Creatine homeostasis facilitates collective migration of pancreatic cancer cells
(a) CCr activity schematic. (b) Ccr uptake by KPC cells. Values in b and c are mean ±SD from 3 biological replicates within the same day and representative of 2 independent experiments. (c) Phosphocreatine circuit and ATP levels of (b). (d) ADP to ATP ratio of (b). Mean ±SD from 4 independent experiments. (e) Growth curves of (b). Mean ±SD from 3 independent experiments. (f) Left; CCr-treated cells. Scale bars, 100μm. Right; Magnification of dashed boxes. White arrows; protrusions. Scale bars, 50μm. (g) Average protrusion length from (f). Values are mean ±SD from n=206 control, n=145 5mM and n=142 10mM CCr-treated cells. (h) Cell speed from (f). Mean ±SD from n=263 control, n=185 5mM and n=192 10mM CCr-treated cells from 3 independent experiments. (i) Immunofluorescence of CCr-treated cells showing F-actin (magenta) and nuclei (blue). Scale bars, 20μm. (j-k) Cell area (μm2) (j) and circularity index (k) from (i). Mean ±SD from n=60 control, n=78 5mM and n=69 10mM CCr-treated cells from 3 independent experiments. (l-n) Total force (l), maximum force (m) of CCr-treated cells and strain energy of blebbistatin treated cells (n). Mean ±SD of n=33 control, n=36 CCr-treated and n=17 blebbistatin-treated cells from 3 independent experiments. Mann-Whitney U test. (o) Creatine and phosphocreatine levels of control or pCr supplemented cells. Values in o and p are mean ±SD from 3 biological replicates within the same day. (p) ADP/ATP ratio of (o). (q) Control (EV) or CKBCRISPR KO cells expressing GFP or CKB-GFP were immunoblotted for GFP and CKB. Pictures representative of 3 independent experiments. (r) Pictures of cells from (q) populating a wounded monolayer. Scale bars, 100μm. (s) Relative wound closure of control or CCr-treated wild-type (EV) cells. Values in s, t, u are mean ±SD from 3 independent experiments. (t-u) Relative wound closure (t) and relative closure at t1/2 of control (u) of control or CCr-treated CKBCRISPR KO cells. In d,s,u: two-tailed one-sample t-test on LN transformed values. In g,j,k: Kruskal-Wallis with Dunn’s multiple comparisons test.
Extended Data Fig. 6
Extended Data Fig. 6. Creatine homeostasis supports actin dynamics and ECM invasion of pancreatic cancer cells
(a-b) Wound closure migration (a) and relative closure at t1/2 of control (b) from KPC cells invading 3D ECM as indicated. Mean ±SD from 3 independent experiments. (c-d) pAMPK signal intensity at the ‘back’ and ‘front’ of control (c) and the ‘front’ of control or CCr-treated KPC monolayers (d) invading 3D ECM. Mean ±SEM from 3 independent experiments with n=84 ‘t=0,back’; n=113 ‘t=0,front’; n=63 ‘t=24h,back’; n=117 ‘t=24,front’; n=62 ‘t=48,back’; n=97 ‘t=48,front’; n=122 ‘t=24,CCr’; n=91 ‘t=48,CCr’ cells. Two-tailed paired t-test. (e) Control or CCr-treated KPC cells immunoblotted for pAMPKα1T183/ α2T172, AMPKα1/α2 and GAPDH (loading control). (f) Densitometric quantification of pAMPK/AMPK levels from (e). Mean ±SD and relative to control from 3 independent experiments. (g) Pictures of control (nc) or CKB silenced (CKBsi#01, CKBsi#02) cells invading 3D ECM. Scale bars, 100μm. (h) Control (EV) or CKB-depleted (CKB-KO) cells expressing GFP or CKB-GFP, invading 3D ECM. Scale bars, 100μm. (i) Wound closure migration of control (EV), CKB-KO and CKB-KO P-Cr-treated cells invading 3D ECM. Mean ±SD from 2 independent experiments with 5 technical replicates. (j-k) Wound closure over time (j) and relative closure at t1/2 of control (k) from control (EV) cells from (h). Values are mean ±SD from 4 independent experiments. (l) Control or CCr-treated cells invading fibroblast-derived ECM. Scale bars, 200μm. (m-n) Cell speed (m) and Euclidean distance (n) from (l). Values are mean ±SD from n=317 control, n=290 5mM and n=239 10mM CCr from 4 independent experiments. Kruskal-Wallis with Dunn’s multiple comparisons test. (o-p) LifeAct-mTagRed signal intensity from actin photoactivation experiments; (o) control or CCr-treated cells. Mean ±SEM derived from n=31 control, n=23 5mM CCr, n=35 10mM CCr and n=28 jasplakinolide-treated cells from 3 independent experiments. (p) control (nc) or CKB-silenced (CKBsi#01, CKBsi#02) cells. Values are mean ±SEM derived from n=36 n.c., n=31 CKBsi#01, n=38 CKBsi#02 and n=21 jasplakinolide-treated cells from 3 independent experiments. In b,f,k: two-tailed one-sample t-test on LN transformed values.
Extended Data Fig. 7
Extended Data Fig. 7. Creatine homeostasis supports collagen remodelling, invasion and the chemotactic response of pancreatic cancer cells
(a) Representative 3D reconstructions of z-stack acquisitions showing nucleic acid labelling (grey) of control or CCr-treated spheroids after 96 hours of invasion within 3D ECM. (b) Protrusion number per spheroid of control or CCr-treated KPC spheroids as indicated. Values are from n=12 control, n=13 5mM and n=13 10mM CCr-treated spheroids from 3 independent experiments. (c) Average protrusion length (μm) of control or CCr-treated KPC spheroids as indicated. Values are from n=12 control, n=13 5mM and n=13 10mM CCr-treated spheroids from 3 independent experiments. (d) Representative plot profiles of SHG intensity of control or CCr-treated KPC spheroids. Green-shaded area shows Full width half maximum (FWHM) of Collagen I (SHG) intensity. (e) Full width half maximum (FWHM) of Collagen I (SHG) intensity from (d). Each dot represents average value (from 6 plot profiles) per spheroid. Values are mean ±SD of n=9 t=0, n=12 t=48h and n=12 CCr-treated spheroids from 3 independent experiments. Statistical significance assessed by one-way ANOVA. (f) Cell speed of cells treated as indicated chemotaxing towards a 10% FBS gradient. Values are mean ± SEM from n=262 control, n=278 5mM and n=275 10mM CCr-treated cells from 4 independent experiments. Statistical significance assessed by Kruskal-Wallis with Dunn’s multiple comparisons test. (g) Cell speed of control (n.c.) or CKB-silenced (CKBsi#01, CKBsi#02) cells chemotaxing towards a 10% FBS gradient. Values are mean ± SEM from n=241 control, n=252 CKBsi#01and n=232 CKBsi#02 cells from 3 independent experiments. Statistical significance assessed by Kruskal-Wallis with Dunn’s multiple comparisons test.
Extended Data Fig. 8
Extended Data Fig. 8. CKB is expressed during PDAC progression and supports metastatic dissemination
(a) Quantification of PicroSirius Red positive area per tissue area from normal mice (Pdx1-Cre+;Kraswt/wt;p53wt/wt) and PDAC from KPC (Pdx1-Cre;LSLKrasG12D;LSLp53R172H) mice. Values are mean ±SEM from n=4 normal and n=9 PDAC pancreata. Statistical significance assessed by two-tailed Mann-Whitney U test. (b) Quantification of Fibronectin positive area per tissue area from (a). Values are mean ±SEM from n=5 for normal and n=11 for PDAC pancreata. Statistical significance assessed by two-tailed Mann-Whitney U test. (c-d) YAP positive cells (%) (c) and nuclear to cytosolic YAP ratio (d) from normal mice (Pdx1-Cre+;Kraswt/wt;p53wt/wt) and PDAC from KPC (Pdx1-Cre;LSLKrasG12D;LSLp53R172H) mice. Values are mean ±SEM from n=5 normal and n=10 (c),n=9 (d) PDAC pancreata. Statistical significance assessed by two-tailed Mann-Whitney U test. (e) High magnification pictures of PDAC tissue sections from KPC mice showing YAP and CKB. Scale bars, 20μm. Representative of n=9 PDAC pancreata. (f) Weight (gr) of animals at time of sacrifice treated as indicated from intrasplenic transplantation experiment. Values are mean ±SEM from n=8 control (EV), n=8 CCr-treated and n=7 CKB-KO mice.
Figure 1
Figure 1. Pancreatic cancer cells are mechanosensitive and untargeted metabolome profiling revealed major metabolic reprogramming with ECM mechanics.
Mouse KPC cells were cultured atop of 0.7-38kPa fibronectin-coated hydrogels and glass coverslips. (a) Left; immunofluorescence of KPC cells cultured as indicated showing F-actin (grey) and nuclei (blue). Scale bars, 50μm. Right; Magnification of areas indicated by a dashed box. Scale bars, 25μm. (b-c) Quantification of cell shape from (a) showing cell area (μm2) (b) and circularity index (c). Values are mean ± SEM from n=500 0.7kPa, n=257 7kPa, n=139 38kPa and n=225 glass, cells from 3 independent experiments. Statistical significance assessed by Kruskal-Wallis with Dunn’s multiple comparisons test. (d) Immunofluorescence of KPC cells from (a) showing pPaxillinTyr118 (grey), Vinculin (magenta) and nuclei (blue). Scale bars, 20μm. (e-f) Quantification of pPaxillinTyr118 positive particles from (d) showing number of focal adhesions per cell (e) and average aspect ratio of focal adhesions per cell (f). Values are mean ± SEM from n=27 0.7kPa, n=30 7kPa, n=30 38kPa and n=31 glass, cells from 3 independent experiments. Statistical significance assessed by two-tailed paired t-test on median values per experiment. (g) Top; Immunofluorescence of KPC cells from (a) showing YAP (green) and nuclei (blue). Scale bars, 20μm. Bottom; Magnification of the areas indicated by a dashed box. Scale bars, 10μm. (h) Quantification of (g) showing nuclear to cytosolic YAP ratio. Values are mean ± SD from n=84 0.7kPa, n=76 7kPa, n=74 38kPa and n=136 glass cells from 3 independent experiments. Statistical significance assessed by Kruskal-Wallis test with Dunn’s multiple comparisons test. (i) Bar graph showing top hits of significantly altered (p<0.05) metabolites derived from untargeted global metabolome analysis plotted by their 0.7kPa/glass expression ratio (grey; enriched on 0.7 kPa, red; enriched on glass). Dotted line at x=1 indicates no difference. (j) AMP, ADP and ATP nucleotide levels of KPC cells cultured as indicated. Values are mean ± SD from 3 biological replicates within the same day and representative of 3 independent experiments. Statistical significance assessed by two-tailed unpaired t-test with Welch’s correction. (k-l) AMP to ATP (k) and ADP to ATP (l) ratios of KPC cells cultured as indicated. Values are mean ± SD from 3 biological replicates within the same day and representative from 3 independent experiments. Statistical significance assessed by one-way ANOVA.
Figure 2
Figure 2. ECM stiffness directs creatine metabolism in PDAC cells.
(a) Schematic representation of the urea cycle, creatine biosynthesis and phosphocreatine-dependent ATP shuttle pathways. (b) Urea cycle and creatine biosynthesis metabolic intermediates of KPC cells cultured on fibronectin-coated 0.7 kPa hydrogels and glass coverslips as indicated. Values are mean ± SD from 3 biological replicates within the same day and representative from 3 independent experiments. Statistical significance assessed by two-tailed unpaired t-test with Welch’s correction. (c) Phosphocreatine to creatine ratio of KPC cells cultured on fibronectin-coated 0.7-38 kPa hydrogels and glass coverslips cultured as indicated. Values are mean ± SD from 3 biological replicates within the same day. Statistical significance assessed by one-way ANOVA. (d) Bar plots showing labelled fraction of arginine-derived labelled carbon and nitrogen incorporation in urea cycle and creatine biosynthesis metabolites of KPC cells cultured as indicated and supplemented with L-arginine-13C615N4 for 1, 3 and 6 hours. Values are mean ±SD from 3 biological replicates within the same day.
Figure 3
Figure 3. Mitochondrial dynamics and respiratory activity are induced by ECM mechanics in pancreatic cancer cells and support invasive behaviour.
In panels a-c, mouse KPC cells were cultured atop of 0.7-38kPa fibronectin-coated hydrogels and glass coverslips. (a) Steady-state levels of glycolysis and TCA cycle intermediates of KPC cells cultured as indicated. Values are mean ± SD from 3 biological replicates within the same day. Statistical significance assessed by one-way ANOVA. (b) Glucose-derived labelled carbon incorporation in glycolysis and TCA cycle intermediates of KPC cells cultured as indicated and supplemented with U-13C6-glucose for 1 and 3 hours. Values are mean ± SD from 3 biological replicates within the same day and representative from 3 independent experiments. (c) Top; Maximum intensity projections of z-stack acquisitions of live KPC cells cultured as indicated showing labelled mitochondria (grey; MitoTracker). Scale bars, 20μm. Bottom; Magnification of the areas indicated by a dashed box. Scale bars, 10μm. White arrows highlight elongated and red arrows rounded mitochondria. Pictures representative of 3 independent experiments. (d) Top; Representative pictures of KPC Matrigel-invading cells showing mitochondria labelling (yellow; Mitotracker) over 150 min. Scale bar, 20μm. Bottom right; Magnification of the areas indicated by a dashed box. Pictures representative of 3 independent experiments. (e) Representative pictures of control or treated with oligomycin-A (2μM) PDAC-A cells invading 3D ECM. A mask over the wound area is annotated with red and a purple line indicates the initial wound area. Scale bars, 100μm. Pictures representative of 4 independent experiments. (f) Wound closure over time from (e). Values are mean ± SD from 4 independent experiments. (g) Relative wound closure of (e) normalised at t1/2 wound closure of control. Values are mean ± SD from 4 independent experiments. Statistical significance assessed by two-tailed one-sample t-test on LN transformed values.
Figure 4
Figure 4. The phosphocreatine circuit depends on CKB in pancreatic cancer cells which is regulated by mechanosensing and YAP activity.
(a) KPC cells were cultured on 0.7-38kPa hydrogels and ECM-coated glass coverslips and immunoblotted for CKB and ERK1/2 (loading control). Pictures representative from 3 independent experiments. (b) Densitometric quantification of (a). Values are mean ± SD and relative to control from 3 independent experiments. (c) KPC cells were cultured on fibronectin (control) or concanavalin A (ConA) coated plates and immunoblotted for CKB and α-Tubulin (loading control). Pictures representative from 3 independent experiments. (d) Densitometric quantification of (c). Values are mean ± SD and relative to control from 3 independent experiments. (e) KPC cells expressing either GFP or VD1-GFP were immunoblotted for CKB and α-Tubulin (loading control). Pictures representative from 4 independent experiments. (f) Densitometric quantification of (e). Values are mean ± SD from 4 independent experiments. (g) Steady state levels of creatine biosynthesis intermediates of KPC cells from (e). Values are mean ± SD from 3 biological replicates within the same day. Statistical significance assessed by two-tailed Welch’s t-test. (h) Control (nc) or YAP silenced (YAPsi#01, YAPsi#02) KPC cells were immunoblotted for YAP, CKB and α-Tubulin (loading control). Pictures representative from 4 independent experiments. (i) Densitometric quantification of CKB expression from (h). Values are mean ± SD and relative to control from 4 independent experiments. (j) KPC cells expressing GFP, GFP-YAP or GFP-YAP5SA were cultured as indicated and immunoblotted for CKB and ERK1/2 (loading control). Pictures representative from 3 independent experiments. (k) Densitometric quantification of (j). Values are mean ± SD and relative to control from 4 (glass) and 3 independent experiments (0.7-38kPa). (l) Steady state levels of creatine biosynthesis intermediates of KPC cells expressing either GFP-YAP or GFP-YAP5SA. Values are mean ± SD from 3 biological replicates within the same day. (m) Control (EV) or CKB-depleted KPC cells (CKB #01, #02) were immunoblotted for CKB and α-Tubulin (loading control). Pictures representative of 3 independent experiments with similar results. (n) Creatine and phosphocreatine levels of cells from (m). Values are mean ± SD from 3 biological replicates within the same day. Statistical significance assessed by two-tailed Welch’s t-test. In b,d,f,i,k: statistical significance assessed by two-tailed one-sample t-test on LN transformed values.
Figure 5
Figure 5. Creatine homeostasis facilitates collective migration of pancreatic cancer cells.
(a) Pictures of control or CCr treated cells populating a wounded monolayer. Scale bars, 100μm. (b-c) Wound closure over time (b) and relative closure at t1/2 of control from (a). Values are mean ± SD from 3 independent experiments. (d) Cell velocity from (a). Values are mean ± SD from n=185 control, n=194 5mM and n=207 10mM CCr treated cells. Statistical significance assessed by Kruskal-Wallis with Dunn’s multiple comparisons test. (e) Immunofluorescence of control or CCr treated cells, showing nuclei (blue), actin (grey) and cortactin (green). Arrows: lamellipodia. Asterisks: phenotype class; elongated (red), intermediate (grey) and lamellipodial (blue). Scale bars, 50μm. (f) Percentage of phenotype from (e). Values are mean ± SD from 3 independent experiments. Statistical significance assessed by 2-way ANOVA; lamellipodial: control vs 5mM, p=0.0003; control vs 10mM, p<0.0001; elongated: control vs 5mM p=0.0011; control vs 10mM p=0.0006. (g) Left; pictures of control or CCr treated cells showing cell body (grey) and nuclei (blue). Right; Traction fields of left panel. Scale bars, 20μm. (h) Strain energy of (g). Values are mean ±SD from n=33 control and n=36 CCr treated cells from 3 independent experiments. Statistical significance assessed by two-tailed Mann-Whitney U test. (i-j) Wound closure over time (i) and relative closure at t1/2 of control (j) from control or P-Cr treated cells populating a wounded monolayer. Values are mean ± SD from 3 independent experiments. (k) Control (n.c.) or CKB silenced (CKBsi#01, CKBsi#02) cells were immunoblotted for CKB and α-Tubulin (loading control). (l) Densitometric quantification of (k). Values are mean ± SD and relative to control from 3 independent experiments. (m) Pictures of cells from (k) populating a wounded monolayer. Scale bars, 100μm. (n-o) Wound closure over time (n) and relative closure at t1/2 of control (o) from (m). Values are mean ± SD from 3 independent experiments. (p-s) Wound closure over time (p, r) and relative closure at t1/2 of control (q, s) from control (EV) or CKB-KO cells expressing GFP or CKB-GFP, populating a wounded monolayer. Values are mean ± SD from 3 independent experiments. In c,j,l,o,q,s: statistical significance assessed by two-tailed one-sample t-test on LN transformed values.
Figure 6
Figure 6. Creatine homeostasis supports actin dynamics in invasive pseudopods of pancreatic cancer cells facilitating ECM invasion.
(a) Pictures of control or CCr treated cells invading 3D ECM. Scale bars, 100μm. (b-c) Wound closure over time (b) and relative closure at t1/2 of control (c) from (a). Values are mean ± SD from 3 independent experiments. (d) Immunofluorescence of cells from (a) showing actin (grey), nuclei (blue) and pAMPKα1T183/α2T172 (red) at the invasive front. Bottom; pAMPK channel (red) from top. Scale bars, 50 μm. (e-f) Percentage of pAMPK positive nuclei over total nuclei at the ‘back’ and ‘front’ of control (e) and the ‘front’ of control or CCr treated cells (f) from (d). Values are mean ± SEM from 3 independent experiments. Statistical significance assessed by two-tailed paired t-test. (g-h) Wound closure over time (g) and relative closure at t1/2 of control (h) from control (n.c.) or CKB silenced (CKBsi#01, CKBsi#02) cells invading 3D ECM. Values are mean ± SD from 3 independent experiments. (i-j) Wound closure over time (i) and relative closure at t1/2 of control (j) from control (EV) or CKB-KO cells expressing GFP or CKB-GFP, invading 3D ECM. Values are mean ± SD from 3 independent experiments. (k) Representative pictures showing PA-GFP-Actin (green) and LifeAct-mTagRed (red) in control, CCr or jasplakinolide treated cells photoactivated (t=6s) at the tips (yellow box, magnified) of pseudopods invading fibroblast-derived ECM. Scale bar, 10μm. (l) Quantification of PA-GFP-Actin signal intensity from (k). Values are mean ±SEM from n=31 control, n=23 5mM CCr, n=35 10mM CCr and n=28 jasplakinolide treated cells from 3 independent experiments. Actin lifetime expressed as the t1/2 of intensity decay. t1/2 values are mean ± SD on average values per experiment. (m) Quantification of PA-GFP-Actin signal intensity of control (nc) or CKB silenced (CKBsi#01, CKBsi#02) cells photoactivated at the tips of pseudopods invading fibroblast-derived ECM (as on (k)). Values are mean ±SEM from n=36 control (n.c.), n=31 CKBsi#01, n=38 CKBsi#02 and n=21 jasplakinolide treated cells from 3 independent experiments. Actin lifetime expressed as the t1/2 of intensity decay. t1/2 values are mean ± SD on average values per experiment. In c,h,j: statistical significance assessed by two-tailed one-sample t-test on LN transformed values.
Figure 7
Figure 7. Creatine homeostasis supports collagen remodelling and invasion of 3D PDAC spheroids and the chemotactic response of pancreatic cancer cells.
(a) Top; Immunofluorescence showing YAP (green), F-actin (grey) and nuclei (blue) at the ‘front’ and ‘back’ of ECM invading cells. Bottom; YAP channel (grey) from top. Scale bars, 50μm. (b) Quantification of nuclear to cytosolic YAP ratio from (a). Values are mean ±SD from n=55 ‘back’, n=63 ‘front’ at t=0; n=51 ‘back’, n=73 ‘front’ at t=24h; n=44 ‘back’, n=69 ‘front’ at t=48h from 3 independent experiments. Statistical significance assessed by two-tailed Mann-Whitney test. (c) Pictures of control or CCr-treated KPC spheroids invading Collagen I/Matrigel 3D ECM. Scale bars, 100μm. (d) Left; Images showing cell mask (CellTracker; red) and Collagen I (SHG; grey) from (c). Right; Collagen-I channel (grey) from left. Scale bars 50 μm. (e) Invasion index over time from (c). Values are mean ±SD from n=12 control, n=13 5mM and n=13 10mM CCr-treated spheroids from 3 independent experiments. Statistical significance assessed by two-tailed paired t-test on mean values per experiment; p-value on control vs 5mM at 48h is 0.0423, at 72h is 0.0066 and at 96h 0.0027. p-value on control vs 10mM at 72h is 0.0254 and at 96h is 0.0390. (f) Max peak intensity of Collagen I (SHG) from (d). Each dot represents average value (from 6 plot profiles) per spheroid. Values are mean ±SD of n=9 t=0, n=12 t=48h and n=12 CCr-treated spheroids from 3 independent experiments. Statistical significance assessed by one-way ANOVA. (g) Tracks of cells (spider plots) and circular rose plots of control or CCr-treated cells migrating towards a 10% FBS gradient. (h) Chemotactic index (cosθ) of cells from (g). Values are mean ±SD from 4 independent experiments. Statistical significance assessed by two-tailed unpaired t-test with Welch’s correction on mean values per experiment. (i) Tracks of cells (spider plots) and circular rose plots of control (n.c.) or CKB-silenced (CKBsi#01, CKBsi#02) cells migrating towards a 10% FBS gradient. (j) Chemotactic index (cosθ) of cells from (i). Values are mean ±SD from 3 independent experiments. Statistical significance assessed by two-tailed unpaired t-test with Welch’s correction on mean values per experiment.
Figure 8
Figure 8. CKB is expressed during PDAC progression and supports metastatic dissemination.
(a) Immunohistochemistry of pancreas from normal mice (Pdx1-Cre+;Kraswt/wt;p53wt/wt) and PDAC from KPC (Pdx1-Cre;LSLKrasG12D;LSLp53R172H) mice, showing H&E, Picrosirius Red, Fibronectin, YAP and CKB staining on serial sections. Representative pictures from 5 normal pancreata and 9 KPC mice. Scale bars, 500μm. (b) Immunohistochemistry of normal pancreas and pancreas sections from 10-week, 15-week and endpoint PDAC from KPC mice showing CKB staining. Scale bars, 500μm. (c) Quantification of CKB positive area per tissue area from (b). Values are mean ±SEM from n=5 normal pancreata, n=5 10-week, n=5 15-week and n=9 PDAC pancreata from KPC mice. Statistical significance assessed by two-tailed Mann-Whitney U-test comparing each KPC stage to normal pancreas. (d) Graphical description of intrasplenic model and quantification strategy. Animals were injected with control (EV) or CKB-depleted (CKB-KO) cells. Control mice 1 week after surgery were randomly assigned to either normal diet or diet containing 0.5% CCr in drinking water. Liver tumour burden is defined as the percentage of liver lobes with tumour over the total number of liver lobes. (e) Representative pictures of liver at time of dissection. Yellow asterisks indicate tumours, while white asterisks indicate tumour-free areas. Scale bar, 500μm. (f) Liver tumour burden (%) of animals treated as indicated. Values are mean ±SEM from n=8 control (EV), n=8 EV+CCr and n=7 CKB-KO mice. Statistical significance assessed by two-tailed Mann-Whitney U-test comparing CCr treated to EV and CKB-KO to EV animals. (g) Liver weight/mouse weight from (e, f). Values are mean ±SEM from n=8 control (EV), n=8 EV+CCr and n=7 CKB-KO mice. Statistical significance assessed by two-tailed Mann-Whitney U-test comparing CCr treated to EV and CKB-KO to EV animals.

References

    1. Papalazarou V, Salmeron-Sanchez M, Machesky LM. Tissue engineering the cancer microenvironment-challenges and opportunities. Biophys Rev. 2018;10:1695–1711. doi: 10.1007/s12551-018-0466-8. - DOI - PMC - PubMed
    1. Bonnans C, Chou J, Werb Z. Remodelling the extracellular matrix in development and disease. Nat Rev Mol Cell Biol. 2014;15:786–801. doi: 10.1038/nrm3904. - DOI - PMC - PubMed
    1. Tian C, et al. Proteomic analyses of ECM during pancreatic ductal adenocarcinoma progression reveal different contributions by tumor and stromal cells. Proc Natl Acad Sci U S A. 2019 doi: 10.1073/pnas.1908626116. - DOI - PMC - PubMed
    1. Bailey P, et al. Genomic analyses identify molecular subtypes of pancreatic cancer. Nature. 2016;531:47. - PubMed
    1. Cukierman E, Bassi DE. Physico-mechanical aspects of extracellular matrix influences on tumorigenic behaviors. Semin Cancer Biol. 2010;20:139–145. doi: 10.1016/j.semcancer.2010.04.004. - DOI - PMC - PubMed

Publication types

MeSH terms