. 2020 Jun;2(6):499-513.
doi: 10.1038/s42255-020-0211-z. Epub 2020 Jun 1.

Systematic mapping of genetic interactions for de novo fatty acid synthesis identifies C12orf49 as a regulator of lipid metabolism

Affiliations

Systematic mapping of genetic interactions for de novo fatty acid synthesis identifies C12orf49 as a regulator of lipid metabolism

Michael Aregger et al. Nat Metab. 2020 Jun.

Abstract

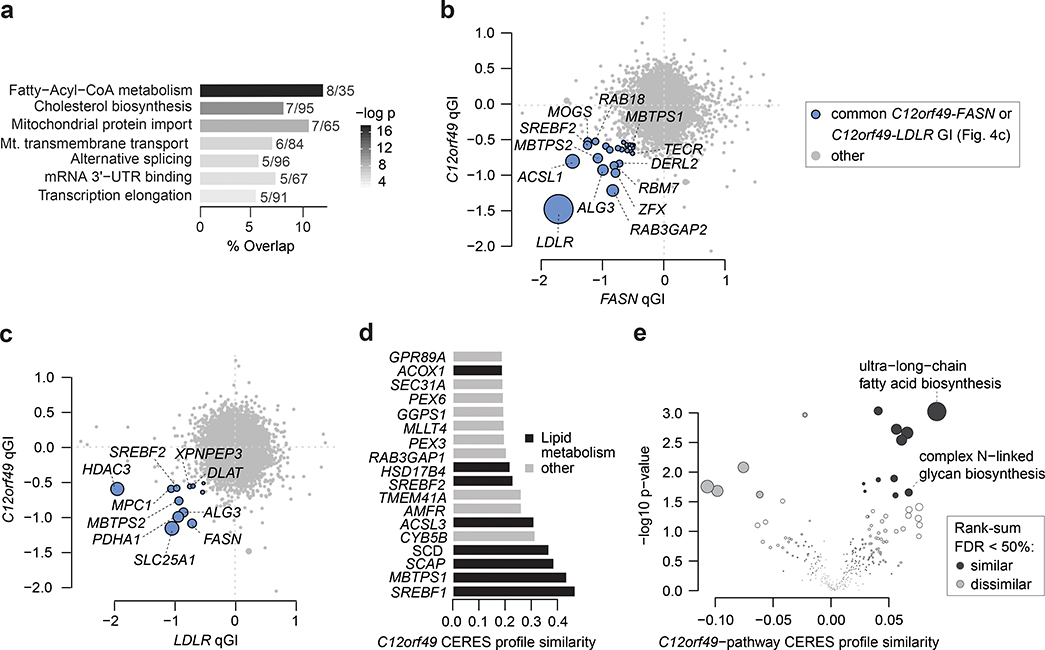
The de novo synthesis of fatty acids has emerged as a therapeutic target for various diseases, including cancer. Because cancer cells are intrinsically buffered to combat metabolic stress, it is important to understand how cells may adapt to the loss of de novo fatty acid biosynthesis. Here, we use pooled genome-wide CRISPR screens to systematically map genetic interactions (GIs) in human HAP1 cells carrying a loss-of-function mutation in fatty acid synthase (FASN), whose product catalyses the formation of long-chain fatty acids. FASN-mutant cells show a strong dependence on lipid uptake that is reflected in negative GIs with genes involved in the LDL receptor pathway, vesicle trafficking and protein glycosylation. Further support for these functional relationships is derived from additional GI screens in query cell lines deficient in other genes involved in lipid metabolism, including LDLR, SREBF1, SREBF2 and ACACA. Our GI profiles also identify a potential role for the previously uncharacterized gene C12orf49 (which we call LUR1) in regulation of exogenous lipid uptake through modulation of SREBF2 signalling in response to lipid starvation. Overall, our data highlight the genetic determinants underlying the cellular adaptation associated with loss of de novo fatty acid synthesis and demonstrate the power of systematic GI mapping for uncovering metabolic buffering mechanisms in human cells.


Conflict of interest statement

COMPETING INTERESTS STATEMENT

J.M., B.A. and C.B are shareholders in Northern Biologics. J.M. is a shareholder in Pionyr Immunotherapeutics, is acting CSO and shareholder in Empirica Therapeutics, and is an SAB member and shareholder of Aelian Biotechnology. C.B. is an SAB member of Yumanity Therapeutics. The authors declare no competing interest.

Figures

Extended Data Fig. 1
Extended Data Fig. 1. Validation of FASN-KO cells and genetic interactions screens.
(a) Western blot depicting FASN and β-Actin levels in HAP1 parental wildtype (WT) and FASN-KO cells. Representative data from three biologically independent experiments. (b) Bar plot depicting malonyl-CoA levels in HAP1 WT and FASN-KO cells as detected by mass spectrometry-based metabolite profiling, normalized to parent HAP1 WT cells. Data are represented as means ± standard deviation; n = four biologically independent experiments; two-tailed Mann Whitney U test. (c) Growth curves of HAP1 WT cells depicting relative cell numbers over 3 days, plotted as a function of glucose concentration in mM, in either 0.5 mM (blue), 1 mM (red), 1.5 mM (yellow), or 2 mM (black) glutamine. (d) Histogram showing a frequency distribution of all pairwise Pearson correlation coefficients for LFC values (T0/T18) of the 21 WT HAP1 screens. (e) Precision-recall curves for the three CRISPR replicate screens in HAP1 FASN-KO cells using the reference core essential gene set (CEG2) defined in Hart et al., 201719. (f) Fitness effect (log2 fold-change, LFC) distributions for reference core essential (CEG2) and non-essential gene sets defined in Hart et al., 201719 across the three FASN-KO query screens. (g) Agreement of gRNA-level genetic interaction scores with FASN. Scatter plots show all possible pairwise combinations of three biological replicate screens. The Pearson correlation coefficient (r), based on comparison values for 70,152 gRNAs. (h) Agreement of FASN quantitative genetic interactions (qGIs). Scatter plots show gene-level FASN genetic interactions (qGI scores) derived from all possible pairwise combinations of three biological replicate screens. The Pearson correlation coefficient (r), based on comparison of all qGI scores (r shown in grey, calculated on all the grey and purple data points in the scatter plots), or only genetic interactions that exceed a given significance threshold (|qGI| > 0.5, FDR < 0.5) in either one screen (logic OR; purple). (i) Scatter plot showing reproducibility scores as a function of qGI scores for a single FASN-KO screen (replicate A). Pairwise reproducibility of a qGI score was calculated by computing the contribution of each of the 17,804 genes to the covariance between a pair of screens divided by the sum of standard deviations. The reproducibility score represents the sum of those values across the three pairwise comparisons. Five genes with highest reproducibility scores and the most negative qGI scores with the FASN-KO screen (replicate A) are labelled. (j) Establishing the AAVS1 target locus as a good negative control site in HAP1 WT and FASN-KO cells. Schematic depicting co-culture validation assays (upper panel). Parental WT and FASN-KO cells were stably transduced with color-coded gRNA expression vectors carrying an intergenic control or screen hit-targeting gRNA. Color-coded cells are mixed at an equal ratio, cultured over two weeks and the relative proportion of green and red cells was quantified by flow cytometry. Control co-culture experiments performed in parallel to the validation of hit genes depicted in Fig. 1e as indicated above each barplot (lower panel). Bar plots are depicting the color ratio of cells carrying two colour-coded gRNAs targeting AAVS1 (intergenic control) across WT and two FASN-KO clones as indicated. Experiments were performed with three independent gRNA targeting AAVS1 and using both color orientations. All data are represented as means ± standard deviation; n = three (LDLR) or four (SLCO4A1, C12orf49) biologically independent experiments. (k) Scatter plots reproducibility scores as a function of qGI scores for the negative genetic interaction hits depicted in Fig. 1h functioning in lipid uptake and homeostasis (red), vesicle transport genes (black) and glycosylation (blue). (l) Precision and recall values for GIs with FASN measured at the standard (|qGI| > 0.5, FDR < 0.5) and stringent (|qGI| > 0.7, FDR < 0.2) thresholds. Precision and recall values were computed using an MCMC-based approach (see Methods).
Extended Data Fig. 2
Extended Data Fig. 2. Quality control of genetic interaction screens for fatty acid synthesis-related query genes.
(a) Precision-recall curves distinguishing the reference core essential gene set (CEG2) defined in Hart et al., 201719 and a non-essential gene set in CRISPR screens in five HAP1 knockout query cell lines (LDLR, C12orf49, SREBF2, ACACA, SREBF1-KO). (b) Fitness effect (LFC) distributions for reference core essential (CEG2) and non-essential gene sets defined in Hart et al., 201719 across CRISPR screens in five HAP1 KO cell lines (LDLR, C12orf49, SREBF2, ACACA, SREBF1). (c) Bar plot of enrichment of co-annotation as defined by the Human Functional Network, Gene Ontology Bioprocesses (BP), HumanCyc or and aggregation of pathway standards (including REACTOME, KEGG or BIOCARTA) for genetic interactions identified across all six query genome-wide screens (FASN, LDLR, C12orf49, SREBF2, ACACA, SREBF1). Enrichment was tested using a hypergeometric test. See methods for details of analysis.
Extended Data Fig. 3
Extended Data Fig. 3. Pathway enrichment analysis of genetic interactions for fatty acid synthesis-related query genes in additional HumanCyc sub-categories.
(a) Dot plot of normalized pathway enrichment values for aggregate GIs across the six query genes (FASN, C12orf49, LDLR, SREBF2, ACACA, SREBF1) with sub-categories from HumanCyc are indicated. A GI is identified for a query-library pair if the |qGI| > 0.5 and FDR < 0.5. Enrichment for positive (yellow) and negative (blue) GI is tested inside Glycan Pathways and Generation of precursor metabolite and energy HumanCyc branches using a hypergeometric test. Enrichment with p-value < 0.05 are blue (negative GI) and yellow (positive GI). Dot size is proportional to the fold-enrichment in the indicated categories and specified in the legend.
Extended Data Fig. 4
Extended Data Fig. 4. Overview of C12orf49, cancer associations, and functional correlates.
(a) Cartoon of C12orf49 protein sequence features and domains. (b-e) Kaplan Meier survival plots displaying univariate analysis of TCGA data across multiple tumor types including kidney, breast, liver and sarcoma for C12orf49 high vs. low expressing tumor tissue (www.kmplot.com )36. Patient numbers at risk (n) are indicated below each plot; two-sided logrank test. (f-h) GI overlap between the 17,804 C12orf49 and SREBF2, SREBF1 and ACACA qGI scores shown as pairwise scatter plots with C12orf49 as function of SREBF2 (f), SREBF1 (g) and ACACA (h). A common negative GI is called if it is significant (qGI < −0.5, FDR < 0.5) in both screens (indicated in blue). The top 10 strongest common GIs and lipid metabolism genes are labelled. (i) Profile similarity of C12orf49 across genome-wide DepMap CRISPR/Cas9 screens. Similarity was quantified by taking all pairwise gene-gene Pearson correlation coefficients of CERES score profiles across 563 screens (19Q2 DepMap data release). The distribution of 17,633 CERES profile similarity is plotted as a quantile-quantile plot, and the top 18 most similar out of 17,633 genes are labelled. Genes associated with lipid metabolism are indicated in red. (j) Pathway analysis of C12orf49 profile similarity. C12orf49 profile similarity scores for all 17,634 genes represented in the DepMap were mean-summarized by pathway as defined in the HumanCyc standard. Tendencies towards pathway-level similarity (co-essentiality) and dissimilarity (exclusivity) with C12orf49 were tested using a two-sided Wilcoxon rank-sum test with multiple hypothesis correction using the Benjamini and Hochberg procedure.
Extended Data Fig. 5
Extended Data Fig. 5. Regulation of LDL uptake and LDLR expression by C12orf49.
(a) Bar plots showing the results of a low density lipoprotein (LDL) uptake assay across the indicated HAP1 cell lines using pHrodo-LDL probe. All data are represented as means ± standard deviation; n = two (SREBF1, SREBF2) or three (WT, FASN, LDLR, C12orf49, WT + C12orf49-V5, C12orf49 + C12orf49-V5) biologically independent experiments; one-way ANOVA. (b) Bar plots showing the results of a transferin uptake assay across the indicated HAP1 cell lines using pHrodo-Transferin probe. All data are represented as means ± standard deviation; n = two (SREBF1, SREBF2) or three (WT, FASN, LDLR, C12orf49, WT + C12orf49-V5, C12orf49 + C12orf49-V5) biologically independent experiments; one-way ANOVA. (c) Bar plots showing the results of a low density lipoprotein (LDL) uptake assay across the indicated in lipoprotein-deprived HAP1 cell lines using Dil-LDL probe. All data are represented as means ± standard deviation; n = two biologically independent experiments. (d) Pathway enrichment analysis of BioID preys captured with N-terminal (top panel) or C-terminal (bottom panel) miniTurbo-tagged C12orf49 under normal growth conditions using the GO molecular function, biological process, cellular compartments, KEGG and Reactome standards. Terms for significantly enriched gene sets (p < 0.05, maximum term size 105) are indicated and bars depict mean percentage overlap with the indicated term. Numbers next to each bar indicate the mean overlap and term sizes, respectively. The greyscale color legend for p-values is indicated on the right. P-values were calculated using gProfileR. (e) Barplots depicting the number of proteins localizing to indicated cellular compartments for preys captured with N-terminal (grey) or C-terminal (black) miniTurbo-tagged C12orf49 in 293 cells under serum-starvation.
Extended Data Fig. 6
Extended Data Fig. 6. RNAseq and western blot analysis in response to serum or lipoprotein starvation and upon inhibition of the proteasome.
(a) Gene ontology enrichment analysis of genes upregulated under serum starvation in HAP1 wildtype (WT), C12orf49 or SREBF2-KO cells using GO molecular functions, GO bioprocesses and Reactome standards. Gene sets with overlapping members have been merged and bars depict mean percentage overlap with the indicated term. Numbers next to each bar indicate the mean overlap and term sizes, respectively. The greyscale color legend for p-values is indicated on the right; p-values were calculated using gProfileR. (b) Boxplots depicting mean expression and induction of genes assigned with the indicated term across HAP1 WT, C12orf49 and SREBF2-KO cells under normal (+FBS) and serum-starved (-FBS) conditions; n = three biologically independent experiments, two-tailed student’s t test. Boxes show IQR, 25th to 75th percentile, with the median indicated by a horizontal line. Whiskers extend to the quartile ± 1.5 x IQR. (c) Western blotting analysis of SREBP2, LDLR and β-Actin levels across the indicated HAP1 co-isogenic knockout cell lines in response to overnight lipoprotein withdrawal (−) and a short refeeding period (−/+) in presence or absence of the proteasomal inhibitor MG132 (10μM MG132 for 5 hours) as indicated. Unprocessed full length and processed C-terminal SREBP2 products are indicated. Representative data from two biologically independent experiments.
Extended Data Fig. 7
Extended Data Fig. 7. Gating strategy for flow cytometry experiments.
Gating strategies for flow cytometry experiments for (a) co-culture assays and (b) LDL/Transferrin uptake assays. In all cases the following steps were taken: 1. Forward scatter area (FSC-A) vs. side scatter area (SSC-A) were used to separate cell events from debris. 2. Forward scatter height (FSC-H) vs. forward scatter width (FSC-W) was used separate single cells from aggregates. 3. Forward scatter area (FSC-A) vs. viability stain (7AAD/B695–40 or Zombie NIR/R780–60) was utilized to gate live cells. For co-culture assays, gating scheme for separating GFP/B530–30 vs RFP/YG610–20 positive cells including steps 1–3 are shown in panel (a). For Dil-LDL/YG585–15 quantification, marker-positive live cells were quantified relative to unstained controls following steps 1–3 as displayed panel (b).
Figure 1.
Figure 1.. Genome-scale identification of digenic interactions with FASN.
(a) Schematic outline for the identification of genetic interactions in co-isogenic HAP1 cell lines. FASN knockout (KO) and wildtype parental cells are infected with a lentiviral genome-wide CRISPR gene KO library (TKOv3) and gRNA abundance is determined using Illumina sequencing of guide RNA (gRNA) sequences amplified from extracted genomic DNA from the starting cell population (T0) and end time point (day 18, T18) of the screen. (b) Schematic outline for scoring quantitative genetic interactions (qGI) across co-isogenic query cell lines. First, the log2 fold-change (LFC) for each gRNA comparing sequence abundance at the starting (T0) and end time point (T18) in a given query KO or wildtype (WT) cell population are computed. Differential LFC for each gRNA are then estimated by comparing its LFC in WT and query KO cells. A series of normalization steps and statistical tests are applied to these data to generate gene-level qGI scores and false discovery rates (see Methods). The LFC scatterplot (bottom left graph) visualizes differential fitness defects in a specific query KO and WT cells, whereas the volcano plot (bottom right graph) visualizes qGI scores for a specific query. (c) Replicate analysis of gene loss of function fitness phenotypes in FASN screens. Scatter plots of LFC associated with perturbation of 17,804 individual genes derived from a FASN query KO mutant screen conducted in triplicate. Reproducibility of fitness effects were determined by measuring Pearson correlation coefficients (r) between all possible pairwise combinations of FASN-KO replicate screens. (d) Evaluation of FASN quantitative genetic interactions (qGIs). qGI scores were measured by comparing the LFC for every gene represented in the TKOv3 gRNA library in a FASN-KO with those observed in a WT cell line, as described. Scatter plots show FASN genetic interactions (qGI scores) derived from all possible pairwise combinations of three biological replicate screens. The Pearson correlation coefficient (r), based on comparison of all qGI scores (r shown in grey, calculated on all the grey and purple data points in the scatter plots), or only genetic interactions that exceed a given significance threshold (|qGI| > 0.5, FDR < 0.5) in both screens (purple). (e) Validation of FASN negative genetic interaction. Bar plots depict the ratio of WT and FASN-KO (2 independent clones, c1 and c2) cells carrying a gRNA targeting SLCO4A1, LDLR or C12orf49, which all showed a negative interaction with FASN, compared to a gRNA targeting AAVS1 (intergenic control). Experiments were performed with three independent gRNAs targeting each genetic interaction screen hit. All data are represented as means ± standard deviation; n = 3 (LDLR) or 4 (SLCO4A1, C12orf49) biologically independent experiments, one-way ANOVA (Kruskall-Wallis test). (f) FASN negative and positive genetic interactions. A scatter plot illustrating the fitness effect (LFC) of 450 genes in a FASN-KO vs. WT parental HAP1 cell line, which exhibited a significant genetic interaction in at least 2 out of 3 FASN-KO replicate screens (|qGI| > 0.5, FDR < 0.5). Negative (blue) and positive (yellow) FASN genetic interactions are shown. Node size corresponds to the mean absolute qGI score derived from three biologically independent replicate screens. Genes with mean absolute qGI score > 1.5 as well as selected negative interactions involving genes with established roles in lipid metabolism are indicated. Inset displays scatter plot of the fitness effect (LFC) of all 17,804 genes targeted by the TKOv3 gRNA library in a FASN-KO vs. WT parental HAP1 cell line. The color indicates density of genes. (g) Enrichment for Gene Ontology (GO) molecular function, GO bioprocesses and Reactome terms among genes that exhibited a significant negative genetic interaction with FASN (significant in at least 2 FASN replicates, |qGI| > 0.5, FDR < 0.5). The number of genes overlapping a particular term and term size are indicated next to each bar, respectively. The greyscale color legend for p-values is indicated on the right; p-values were calculated using gProfileR. (h) Schematic depicting the function of selected FASN negative interactions known to be involved in lipid uptake and homeostasis pathways (red), vesicle transport (black) and glycosylation (blue).
Figure 2.
Figure 2.. Querying five additional lipid metabolism genes for digenic interactions.
(a) Schematic diagram showing key steps in fatty acid metabolism. The genes encoding the proteins mediating these key steps, which are also query genes for genetic interaction screens described in the main text, are labelled in red. (b-f) Volcano plots showing qGI scores and associated significance (-log10 p-value) for the 17,804 genes targeted by the TKOv3 gRNA library in the (b) LDLR-KO, (c) SREBF2-KO, (d) ACACA-KO, (e) SREBF1-KO and (f) C12orf49-KO screens. Colored dots indicate genes that meet the standard threshold of |qGI| > 0.5, FDR < 0.5, where positive GIs are indicated in yellow and negative GIs in blue. The dot size is proportional to both qGI and FDR, calculated as described in the Methods. Genes with |qGI| scores > 1.5 as well as selected top negative GI hits associated with lipid metabolism, citrate synthesis and transport are indicated. (g) Heatmap showing overlapping genetic interactions across the six interrogated queries. Heatmap displaying genes (x-axis) significantly interacting with FASN across all three FASN replicate screens and at least one additional screened query genes (y-axis) (|qGI| > 0.5, FDR < 0.5). Positive and negative qGI scores are indicated in yellow and blue, respectively. The FASN qGI is represented as the mean qGI from the three FASN screens (same data as in Fig. 1f).
Figure 3.
Figure 3.. Genetic interactions reveal multiple levels of functional enrichment.
(a) Dot plot of normalized pathway enrichment scores on the HumanCyc category level, calculated from qGIs across all six query genes (FASN, C12orf49, LDLR, SREBF2, ACACA, SREBF1). A GI is identified for a query-library pair if the |qGI| > 0.5 and FDR < 0.5. Enrichment for positive (yellow) and negative (blue) GIs is tested in each of the 10 HumanCyc main pathway categories using a hypergeometric test and considering all 17,804 genes targeted in the TKOv3 library as the universe. Enrichment with p-value < 0.05 are blue (negative GI) and yellow (positive GI). Dot size is proportional to the fold-enrichment in the indicated categories and specified in the legend. Categories indicated in bold are further expanded in part (b) and in Extended Data Fig. 3a. (b) Dot plot of normalized pathway enrichment of GIs on a sub-category level, calculated as described in part (a), except that sub-categories were examined inside the Biosynthesis and Macromolecule Modification HumanCyc branches. Enrichment with p-value < 0.05 are blue (negative GI) and yellow (positive GI). Dot size is proportional to the fold-enrichment in the indicated categories and specified in the legend. Categories indicated in bold text are further expanded in part (c). (c) Matrix dot plot of pathway enrichments of GIs for the fatty acid and lipid biosynthesis and protein modification sub-categories. Dots show positive (yellow) or negative (blue) z-transformed qGI scores summarized at a pathway-level. qGI scores were first z-score transformed at a gene-level for each genome-wide query screen separately. Then, a mean z-score was calculated for each pathway for a given query screen. Dot size corresponds to the absolute z-transformed mean qGI score, grey dots represent |z| < 0.5. Pathways marked with an asterisk are annotated to both protein modification and carbohydrate biosynthesis pathways. Bold pathways are shown in (d-e). Pathways were displayed if they shared an absolute z-score larger than 1.5 with any query gene. (d-f) Gene-level heatmaps for genes involved in enriched pathways. qGI scores between query genes and all genes from the selected pathways. Positive and negative qGI scores are indicated in yellow and blue, respectively.
Figure 4.
Figure 4.. C12orf49 genetic interaction profile suggests a functional role in lipid metabolism.
(a) Bar plot depicting pathway enrichment of negative genetic interactions with C12orf49 (|qGI| > 0.5, FDR < 0.5) using GO molecular functions, GO bioprocesses and Reactome standards. Significantly enriched gene sets (p < 0.05, maximum term size 100). Bars depict mean percentage overlap with the indicated term, and the numbers next to each bar indicate the number of genes overlapping a particular term and term size, respectively. The greyscale color legend for p-values is indicated on the right. The greyscale color legend for p-values is indicated on the right; p-values were calculated using gProfileR. (b) Scatter plot of C12orf49 and FASN qGIs depicting GI overlap between C12orf49 and FASN qGI scores. FASN qGI scores are represented as the mean between three independent screens. A common negative GI is called if it is significant (qGI < −0.5, FDR < 0.5) in the C12orf49-KO screen and significant in 2 of 3 FASN-KO screens (indicated in blue). The top 10 strongest common GIs, lipid metabolism and vesicle trafficking genes are labelled. (c) Scatter plot of C12orf49 and LDLR qGIs depicting GI overlap between C12orf49 and LDLR qGI scores. A common negative GI is called if it is significant (qGI < −0.5, FDR < 0.5) in both screens (indicated in blue). The top 10 strongest common GIs and lipid metabolism genes are labelled. (d) Bar plot indicating the C12orf49 profile similarity across genome-wide DepMap CRISPR/Cas9 screens. Similarity (i.e. co-essentiality) was quantified by taking all pairwise gene-gene Pearson correlation coefficients of CERES score profiles across 563 screens (19Q2 DepMap data release). The top 18 out of 17,633 gene profiles most similar to C12orf49 are shown. Genes associated with lipid metabolism are indicated in black. (e) Volcano plot of pathway enrichment for C12orf49 co-essential genes. C12orf49 co-essentiality profile scores for all 17,634 genes represented in the DepMap were mean-summarized by pathway as defined in the HumanCyc standard. Tendencies towards pathway-level similarity (co-essentiality) and dissimilarity (exclusivity) with C12orf49 were tested using a two-sided Wilcoxon rank-sum test followed by multiple hypothesis correction with the Benjamini and Hochberg procedure.
Figure 5.
Figure 5.. C12orf49 shuttles between ER and Golgi and regulates lipid uptake through modulation of SREBP2 processing.
(a) Bar plots showing the results of low density lipoprotein (LDL) uptake assays in the indicated cells using the Dil-LDL probe. All data are represented as means ± standard deviation; n = 4 (SREBF1, SREBF2), 6 (LDLR, WT + C12orf49-V5, C12orf49 + C12orf49-V5) or 8 (WT, FASN, C12orf49) independent biological replicates; one-way ANOVA. (b) Schematic outlining proximal protein capture using BioID mass spectrometry analysis (upper panel) and analysis of subcellular localization of C12orf49 BioID preys (lower panel). Barplots depicting the fraction of proteins localizing to indicated cellular compartments for preys captured with N-terminal (grey) or C-terminal (black) miniTurbo-tagged C12orf49 in 293 cells. The inset shows a schematic representation of the predicted topology and orientation of C12orf49 with respect to the cytoplasm and ER. (c) Immunofluorescence microscopy analysis of C-terminal V5-tagged C12orf49 in HAP1 cells under normal (left) or serum-starved (right) growth condition. C12orf49-V5 localization is shown in green, GOLGA2 is a marker of the Golgi apparatus and shown in red, and DAPI (blue) marks the nuclei. Scale bars correspond to 10 μm. Representative data from 2 independent biological replicates. (d) Scatter plot displaying the specificity of detected preys captured with BioID. Average spectral counts of preys captured in proximity to N-terminal miniTurbo BirA-tagged C12orf49 exposed to serum starvation are plotted against their specificity across hundreds of baits listed in the Human Cell Map BioID data set (humancellmap.org) (left). The inset shows a comparison of the average spectral counts for preys involved in the regulation of SREBPs across the different miniTurbo-tagged constructs (i.e. N- and C-terminal) and growth conditions (i.e. normal and serum-starved) (right). BFDR was calculated using using SAINTexpress v3.6.1; n = 3 biologically independent experiments. (e) Bar plots indicating FPKM expression values from RNA sequencing data for LDLR and LDLRAP1 in WT, C12orf49-KO, and SREBF2-KO cells under normal (+FBS) and serum-starved (-FBS) growth conditions as assessed by RNA sequencing. All data are represented as means ± standard deviation; n = 3 independent biological replicates. (f) Bar plot of relative mRNA expression of LDLR across HAP1 WT, FASN-KO and C12orf49-KO cells. All data are represented as means ± standard deviation; n = 3 independent biological replicates; one-way ANOVA. (g) Western blotting analysis of SREBP2, LDLR and β-Actin levels across the indicated HAP1 co-isogenic knockout cell lines cultured in presence of FBS or exposed to overnight serum (left panel) or lipoprotein withdrawal (middle panel) and a short refeeding period (−/+). Unprocessed full length (FL) and processed C-terminal SREBP2 products are indicated. The same analysis was repeated in HEK293T cells (right panel). Prior protein extraction, HEK293T cells were stably transduced with lentiviral Cas9 and gRNA expression cassettes, selected and cultured for 4 days. Representative data from 3 independent biological replicates.
Figure 6.
Figure 6.. LUR1/C12orf49 shuttles between ER and Golgi and regulates SREBF2 activation and lipid uptake.
Proposed model summarizing functions and locations of key players in lipid metabolism, including LUR1/C12orf49, and highlighting the processes induced upon lipid deprivation in presence (left) or upon loss of LUR1/C12orf49 (right). Left panel: (1) upon lipid deprivation (e.g. -LDL) LUR1/C12orf49 and SREBF2 relocate from the ER to the Golgi; (2) SREBF2 gets activated in the Golgi through proteolytic cleavage; (3) the processed, transcriptionally active domain shuttles to the nucleus where it induces expression of target genes required for lipid homeostasis such as LDLR; (4) newly synthesized and recycled LDLR shuttle through the ER-Golgi network where they are post-translationally modified (incl. glycosylation) and traffic to the cell surface; (5) on the cell surface LDLR binds LDL particles; (6) LDL particles are taken up through receptor-mediated endocytosis; (7) LDL particles are degraded and lipoprotein becomes available for metabolic processes including the synthesis, modification or storage of fatty acids and cholesterol. Right panel: (1) Loss of LUR1/C12orf49 results in (2) impaired SREBF2 processing (3–5) and subsequently reduced expression of LDLR; (6) LDL uptake levels are decreased as a consequence of reduced LDLR expression and uptake activity; (7) decreased availability of extracellular lipoprotein leads to increased dependence on de novo synthesis pathways such as de novo fatty acid and cholesterol synthesis, explaining the negative GI between LUR1/C12orf49 and FASN and other members of lipid metabolic pathways.

References

    1. Chen M & Huang J The expanded role of fatty acid metabolism in cancer: new aspects and targets. Precis. Clin. Med. 2, 183–191 (2019). - PMC - PubMed
    1. Chen RR et al. Targeting of lipid metabolism with a metabolic inhibitor cocktail eradicates peritoneal metastases in ovarian cancer cells. Commun. Biol. 2, 281 (2019). - PMC - PubMed
    1. Imoto M Chemistry and biology for the small molecules targeting characteristics of cancer cells. Biosci. Biotechnol. Biochem. 83, 1–10 (2018). - PubMed
    1. Menendez JA & Lupu R Fatty acid synthase (FASN) as a therapeutic target in breast cancer. Expert Opin. Ther. Targets 21, 1001–1016 (2017). - PubMed
    1. Garber K Cancer anabolic metabolism inhibitors move into clinic. Nat. Biotechnol. 34, 794–795 (2016). - PubMed

Publication types

MeSH terms