. 2020 Mar;2(3):243-255.
doi: 10.1038/s42255-020-0175-z. Epub 2020 Mar 9.

PTH hypersecretion triggered by a GABAB1 and Ca2+-sensing receptor heterocomplex in hyperparathyroidism

Affiliations

PTH hypersecretion triggered by a GABAB1 and Ca2+-sensing receptor heterocomplex in hyperparathyroidism

Wenhan Chang et al. Nat Metab. 2020 Mar.

Abstract

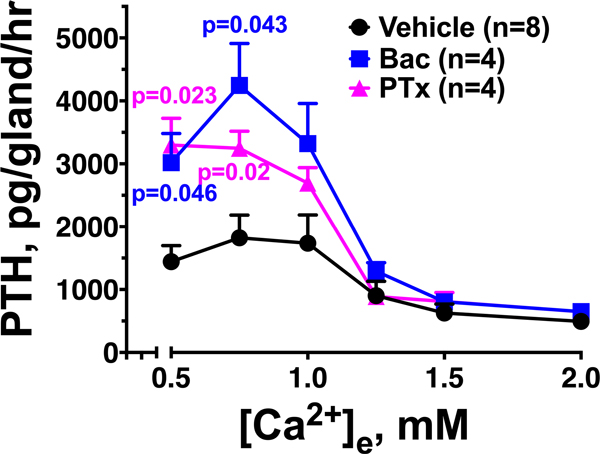
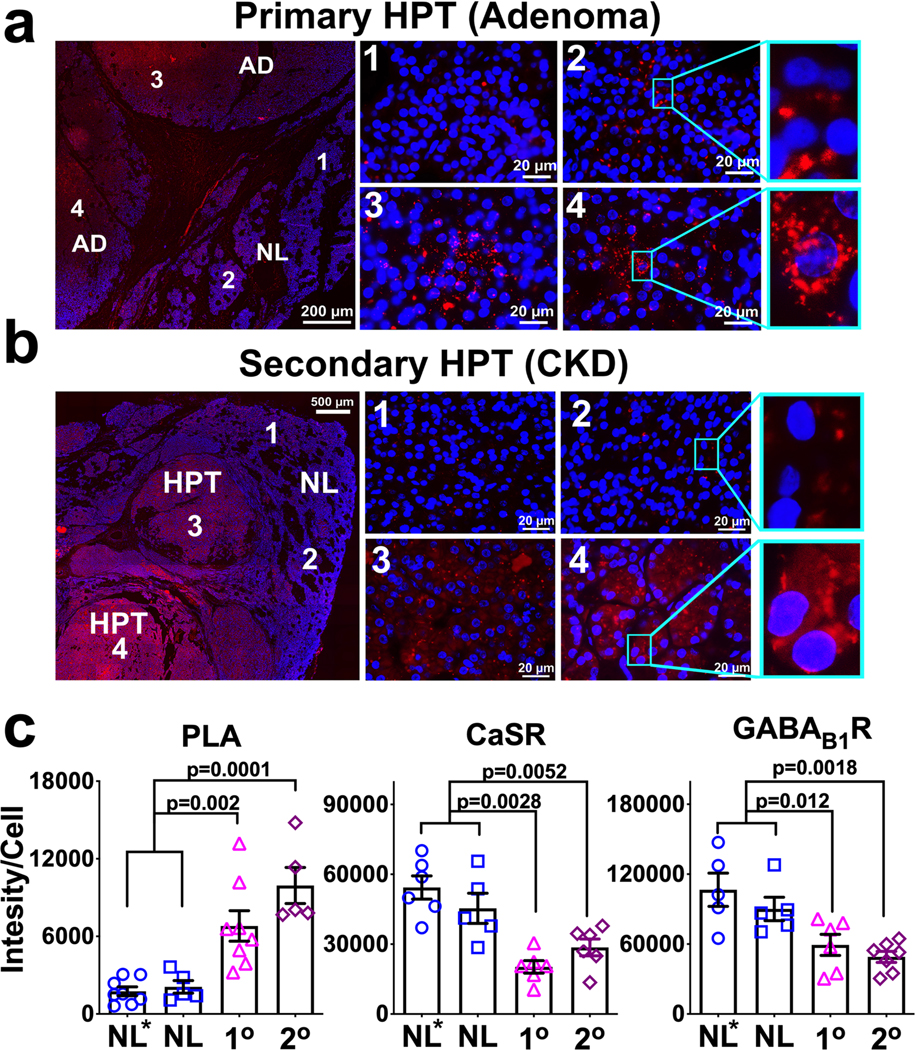
Molecular mechanisms mediating tonic secretion of parathyroid hormone (PTH) in response to hypocalcaemia and hyperparathyroidism (HPT) are unclear. Here we demonstrate increased heterocomplex formation between the calcium-sensing receptor (CaSR) and metabotropic γ-aminobutyric acid (GABA) B1 receptor (GABAB1R) in hyperplastic parathyroid glands (PTGs) of patients with primary and secondary HPT. Targeted ablation of GABAB1R or glutamic acid decarboxylase 1 and 2 in PTGs produces hypocalcaemia and hypoparathyroidism, and prevents PTH hypersecretion in PTGs cultured from mouse models of hereditary HPT and dietary calcium-deficiency. Cobinding of the CaSR/GABAB1R complex by baclofen and high extracellular calcium blocks the coupling of heterotrimeric G-proteins to homomeric CaSRs in cultured cells and promotes PTH secretion in cultured mouse PTGs. These results combined with the ability of PTG to synthesize GABA support a critical autocrine action of GABA/GABAB1R in mediating tonic PTH secretion of PTGs and ascribe aberrant activities of CaSR/GABAB1R heteromer to HPT.


Figures

Extended Data Fig. 1:
Extended Data Fig. 1:. Expression of CaSR and GABAB1R in mouse and human PTGs.
(a, b) Membrane protein lysates (50 μg/lane) (a) and tissue sections (b) of PTGs from PTGGABAB1R+/+ (control) and PTGGABAB1R−/− (KO) mice were probed with anti-GABAB1R-C antibody for expression of GABAB1R as described in On-line Methods. In panel (a), a dominant ≈100 kD (unglycosylated) GABAB1R and minor ≈130 kD and ≈150 kD (presumably glycosylated) were detected in the control, but not KO, PTGs. n = 2 batches of PTGs from a total of 20 mice/genotype. (c, d) Membrane protein lysates (50 μg/lane) (c) and tissue sections (d) of PTGs from PTGCaSR+/+ (control) and PTGCaSR−/− (KO) mice were probed with anti-N-CaSR (VA609) antibody for expression of CaSR. In panel (c), a dominant ≈120 kD (unglycosylated) CaSR and ≈140 kD and ≈160 kD glycosylated (arrowheads) and larger aggregates were detected in the control, but not KO PTGs. n = 2 batches of PTGs with a total of 16 mice/genotype. Panels b and d show brown DAB staining, indicating immunoreactivity of GABAB1R and CaSR, respectively, and blue/purple hematoxylin counterstaining in mouse PTGs. (e) Membrane proteins (400 μg) extracted from human parathyroid adenomas were subjected to immunoprecipitation (Imppt) with CaSR antibodies or non-immune IgG and immunoblotted (IB) along with non-Imppt controls (input, 50 μg) with either CaSR or GABAB1R antibodies. Left panels demonstrate the ability of CaSR antibody to pull down ≈140 and 150 kD glycosylated CaSR (arrowheads) and large aggregates (*) along with ≈100 kD unglycosylated and ≈130 kD glycosylated GABAB1R (open arrow). Two right panels demonstrate the ability of GABAB1R antibody to pull down ≈100 kD unglycosylated and ≈130 kD glycosylated GABAB1R (open arrow) along with the ≈140 kD glycosylated CaSR (arrowhead) and large aggregates (*). n = 3 human PTG lysates.
Extended Data Fig. 2:
Extended Data Fig. 2:. Expression of GAD1/2 and GABA in mouse and/or human PTGs.
(a,b) Sections of PTGs from control (Cont) and GAD1/2-DKO mice were probed with anti-GAD1/2 antibody and FITC-conjugated secondary Ab and counterstained with blue fluorescent DAPI nuclear dye (a) or probed with anti-GABA2 antibody and HRP-conjugated secondary Ab and counterstained with hematoxylin (b) as described in On-line Methods. Inserts show digitally enlarged views of the white box areas. n = 12 PTGs from 6 mice for each genotype. (c) PTG sections from B6:Wt mice (top panels) and patients with 1° HPT (bottom panels) were probed with anti-GABA antibody (left panels) or non-immune IgG, followed by horseradish peroxidase (HRP)-conjugated secondary Ab. For panels (b) and (c), brown immunoreactivity signals were developed by immersing the sections with 3,3’-diaminobenzidine (DAB) substrate and counterstained with blue hematoxylin as described in On-line Methods. n = 8 PTGs from 4 mice and 4 human PTGs.
Extended Data Fig. 3:
Extended Data Fig. 3:. PTH secretion from PTGs lacking Gq and G11 or CaSR.
Secretory properties of PTGs from 8-wk-old male PTGGq−/−//G11+/+ (n = 12 pairs PTGs from 12 mice), PTGGq−/−//G11+/– (n =15 pairs PTGs from 15 mice), and PTGGq−/−//G11−/− (n =3 pairs PTGs from 3 mice) mice, which carry PTG-specific Gnaq and/or germ-line Gna11 gene KO alleles, 4-wk-old PTCCaSR−/− mice, which carry PTG-specific Casr gene KO alleles (n =5 pairs PTGs from 5 mice), and control littermates (n =7 pairs PTGs from 7 mice), which carry floxed-Gnaq and wild-type Gna11 without Cre expression, were assessed by incubating the glands with a series of media containing increasing [Ca2+] (from 0.5 to 3 mM). PTH secretory rates were normalized to the rate of basal secretion rate at 0.5 mM Ca2+ to calculate the Ca2+ set-points, indicated by vertical dashed lines. Mean ± s.e.m.
Extended Data Fig. 4:
Extended Data Fig. 4:. Effect of pertussis toxin on PTH secretion from PTGs.
PTGs (2 per group) from wild-type C57/B6 were sequentially incubated with increasing [Ca2+]e from 0.5 to 2.0 mM (1 hr for each concentration) in the presence of vehicle (0.1% DMSO) or baclofen (Bac, 300 μM) with or without preincubation with pertussis toxin (PTx, 100 μg/ml, 3 hrs). Mean ± s.e.m. of n pairs of PTGs from n mice as indicated. P values vs Vehicle controls were assessed by 2-way ANOVA with Sidak’s test.
Extended Data Figure 5.
Extended Data Figure 5.. Signaling responses to Ca2+ and/or baclofen in parathyroid-derived PTH-C1 cells.
(a) Time-course of Gq activation. Representative FRET experiments showing stimulatory effect of Ca2+ (10 mM) which is suppressible by baclofen (300 μM) in PTH-C1 cells coexpressing the FRET-based Gq sensor (GqTurq/YFP) without (−) or with (+) coexpression of recombinant (Recom) CaSR and GABAB1R. The change in FRET (NFRET) was calculated according to equation #2 (see On-line Methods) with the initial value at t = 0 set to 1. Similar results were obtained from 2 independent experiments. (b) Averaged time courses of cAMP in PTH-C1 cells expressing CaSR without (control in blue) or with pretreatment with cholera toxin (CTx in black). Cells were continuously perfused with buffer without or with extracellular Ca2+ or forskolin (horizontal bar). Data were normalized to control with the initial value at t = 0 set to 1 and represent the mean ± SEM of n = 45 cells from 3 separate experiments
Figure 1.
Figure 1.. Expression of GABAB1R and GAD1/2 and GABA synthesis in PTGs.
(a) qPCR analyses showed RNA expression of CaSR, GABAB1R, GAD1 and GAD2, but not GABAB2R in mouse PTGs, Mean ± s.e.m. of n = 5 batches of PTGs from 60 mice. (b–d) Representative immunohistochemistry (b, c) and immunoblotting (d) analyses that show the expression of ≈100 kD core and ≈130 and ≈150 kD glycosylated GABAB1R as well as the expression of 67 kD GAD1 and 65 kD GAD2 in mouse PTGs and hippocampi (Hipp). n = 5 batches of PTGs from 50 mice and 10 mouse brains. Brown DAB signals in panel b indicates GABAB1R immunoreactivity in mouse PTCs counterstained with blue hematoxylin. Green florescent FITC signals in panel c indicate GAD1/2 immunoreactivity in mouse PTCs counterstained with blue DAPI nuclear dye. (e) Representative immunohistochemical detection of GABA in mouse and human PTGs. n = 12 PTGs from 8 mice and 6 human PTGs. (f) GABA levels in human PTG and mouse brain were quantified by multiple reaction monitoring (MRM); Mean ± s.e.m. of n = 3 human PTGs and 3 mouse brains. The p-value was determined by 2-tails Student t-test. (g) Representative MRM chromatogram of d5-GABA (m/z 109.02 → 92.05) synthesis in human PTG extracts incubated with cofactor vitamin B6 in the presence (purple tracing) or absence (green tracing) of d5-glutamate. n = 3 independent assays from 3 human PTG lysates.
Figure 2.
Figure 2.. Impact of GABAB1R and GAD1/2 on PTH Secretion and Mineral and Skeletal Homeostasis.
(a,b) PTGs (2 or 4 per group) of 4-week-old C57/B6 wild-type (B6:Wt) mice were sequentially incubated with increasing [Ca2+]e from 0.5 to 3.0 mM (1 hr per concentration) in the presence of vehicle (Veh, 0.1% DMSO, red circle), (a) 300 μM GABAB1R agonist [GABA: green triangle or Baclofen (Bac): blue square], or (b) 10 μm GABAB1R antagonist, CGP54626 (CGP) (green triangle). Top panels show changes in the rate of PTH secretion on a per-gland and per-hour basis with raising [Ca2+]e to compare the maximal PTH secretion rate (PTH-Max). Bottom panels show normalized PTH secretion rate to the basal rate at 0.5 mM Ca2+ to better assess changes in the Ca2+-set-point ([Ca2+]e needed to suppress 50% of [Ca2+]e-suppressible PTH secretion). Color dotted vertical lines indicate Ca2+ set-points for the corresponding treatments. Mean ± s.e.m. of n = 4 groups of PTGs from 8 mice for each treatment in panel a and 5 (Veh) or 6 (CGP) pairs of PTGs from 5 or 6 mice for panel b; *P < 0.05; **P < 0.01, ***P < 0.001vs Vehicle by two-way ANOVA with Sidak’s multiple comparisons test using Prism 8 statistics software. (c) PTH secretory properties in PTGs (2 per group) from 3-month-old PTGGABAB1R−/− (KO) and control (Cont) littermates were assessed in the presence of vehicle (Veh, 0.1% DMSO, Cont: red circle, KO: red triangle) or baclofen (300 μM, Cont: blue square, KO: green triangle). Mean ± s.e.m., of n = 4–8 pairs of PTGs from 4–8 mice for each genotype and treatment; * P < 0.05, ** P < 0.01 vs Cont-Veh; &P < 0.01 KO-Bac vs Cont-Veh or Cont-Bac by two-way ANOVA with Sidak’s multiple comparisons test. (d) PTH secretory properties in PTGs (2 per group) from 3-month-old PTGGAD1−/−;GAD2−/− double KO (GAD1/2-DKO, magenta triangle) and control (Cont, red circle) littermates. Mean ± s.e.m. of n mice as indicated for each genotype; * P < 0.05, vs Cont by two-way ANOVA with Sidak’s multiple comparisons test. (e-h) Representative pictures (e), average body weights (B.Wt.) (f), serum PTH (sPTH) and total serum Ca2+ (sCa) levels (g), and skeletal parameters in trabecular (Tb) bone of distal femur and cortical (Ct.) bone in tibiofibular junction (h) of GABAB1R-KO mice and control (Cont) littermates with the n as indicated for each group. Tb.BV/TV: Tb bone fraction over total bone volume; Tb.Th: Tb thickness; Tb.BMD: Tb bone mineral density; Ct.TV: total Ct bone volume; Ct.Th: Ct thickness. Mean ± s.e.m. of n = mice as indicated, P-values were assessed by 2-tails Student’s t-test. (i-k) Average B.Wt. (i), sPTH and Ca2+ (sCa) levels (j), and PTG micrographs and quantified volumes (k) of GAD1/2-DKO mice and control (Cont) littermates with the n as indicated for each genotype. For panel K, PTGs were compressed into discs between a pair of glass slide and coverslip with a 120-μm spacer during fixation, washed, stained with blue fluorescent DAPI dye, and imaged. Glandular volumes were calculated as the products of glandular areas x 120 μm and presented in the scatter histograms. Mean ± s.e.m. of n mice as indicated per genotype. P-values were assessed by 2-tails Student’s t-test.
Figure 3.
Figure 3.. Heteromerization of CaSR and GABAB1R in PTCs and HEK293 cells.
(a, b) Proximity ligation assay (PLA) with CaSR and GABAB1R antibodies show strong fluorescent signals (in red) of receptor heteromerization in (a) PTGs from control (Cont), but not PTGGABAB1R−/− KO mice, and in (b) PTGs from patients with 1° HPT incubated with both antibodies, but not in those treated with anti-CaSR alone. Blue: DAPI nuclear staining. Lower panels show digitally enlarged images of white boxed areas. n = 6 PTGs from 3 mouse or 3 human PTGs per group. (c) Membrane proteins (400 μg) extracted from human parathyroid adenomas were subjected to immunoprecipitation (Imppt) with either CaSR or GABAB1R antibodies and immunoblotted (IB) along with non-Imppt controls (input, 50 μg) with either CaSR or GABAB1R antibodies. Left two panels demonstrate the ability of CaSR antibody to pull down ≈140 and 150 kD glycosylated CaSR (arrowheads) and large aggregates (*) along with ≈100 kD unglycosylated and ≈130 kD glycosylated GABAB1R (open arrow). Two right panels demonstrate the ability of GABAB1R antibody to pull down ≈100 kD unglycosylated and ≈130 kD glycosylated GABAB1R (open arrow) along with the ≈140 kD glycosylated CaSR (arrowhead) and large aggregates (*). n = 3 different human PTG lysates. (d) An example of photobleaching experiment. Emission intensities of YFP (535 nm, orange) and CFP (480 nm, blue) recorded from a batch of 5 single cells coexpressing CaSR fused with CFP (CaSR-CFP) and GABAB1R fused with YFP (GABAB1R-YFP). Emission intensities were recorded before and after YFP was photobleached by exposure to continuous illumination at 500 nm. (e) Average recorded FRET efficiency was calculated according to equation (3) (see On-line Methods) from HEK-293 cells expressing a combination of receptors or proteins C-terminally tagged with CFP or YFP as indicated. Mean ± s.e.m. of n batches of cells (5 cells/batch) as indicated from 3 independent DNA transfections. P values between groups were assessed by one-way ANOVA Sidak’s multiple comparisons test. (f, g) (f) Multicolor BiFC detection of GABAB1R homomers and GABAB1R/CaSR or GABAB1R/GABAB2R heteromers. CaSR carrying an N-terminal fragment of CFP (CaSRN-CFP), GABAB1R carrying the N-terminus of the YFP (GABAB1RN-YFP), and GABAB1R carrying the C-terminus of CFP/YFP (GABAB1RC-CFP/YFP) were coexpressed in HEK-293 cells. The relative amount of homodimer versus heterodimer was visualized after excitation at 500 nm (YFP) or 436 nm (CFP), respectively. In separate experiments, similar BiFC approach and transfection protocols were used to assess heteromerization of GABAB1RN-CFP and GABAB2RC-CFP in HEK-293 cells. (g) CFP emission intensities recorded from HEK293 cells transfected with an increasing amount of CaSRN-CFP in combination with a fixed amount of GABAB1RC-CFP cDNAs. Mean ± s.e.m. of n batches of cells (5 cells/batch) as indicated from 3 independent DNA transfections. P values between groups were assessed by 2-tails Student’s t-test.
Figure 4.
Figure 4.. Signaling properties of the CaSR/GABAB1R heteromer.
(a, b) Representative FRET experiments showing direct effect of Ca2+ (3 mM) alone or with baclofen (300 μM) in single HEK293 cells coexpressing the FRET-based Gq sensor (GqTurq/YFP) and CaSR (a) alone, or (b) in combination with GABAB1R. The change in FRET (NFRET) was calculated according to equation #2 (see On-line Methods) with the initial value at t = 0 set to 1. (c) Histograms represent the effects of Ca2+ and baclofen added alone or together on the level of Gq activation with 100% corresponding to an increase of the FRET ratio by 6%. Mean ± s.e.m. of N = 5 with 5 cells/ experiment; P values between groups were assessed by one-way ANOVA Sidak’s multiple comparisons test. (d–f) Similar experiments were done with the FRET-based Gi sensor (GiCFP/YFP) (d,e) and summarized (f). Mean ± s.e.m. of n = 4–5 experiments with 5 cells/experiment. P values between groups were assessed by one-way ANOVA Sidak’s multiple comparisons test. (g, h) Concentration-response relation for Ca2+ on the change in total inositol phosphate (InPTotal) production (g), and corresponding normalized histograms summarizing (h) the effects of baclofen on Ca2+-mediated InP production in cells coexpressing CaSR and/or GABAB1R. Mean ± s.e.m. of n = 6–10 experiments with 5 cells/experiment. P values between groups were assessed by one-way ANOVA Sidak’s multiple comparisons test. (i-k) Averaged time-courses of cAMP in PTH-C1 cells pretreated with cholera toxin (CTX, 1 μg/ml for 5 h) and expressing CaSR (i) alone or (j, k) with GABAB1R. Horizontal bars represent application of a saturating concentration of Ca2+ (3 mM) alone or in combination with baclofen (300 μM) and/or a GABAB1R antagonist, CGP54626 (10 μM), or forskolin (10 μM). Mean ± s.e.m. of n = 3 experiments with 10–15 cells/experiment.
Figure 5.
Figure 5.. Increased Expression of CaSR/GABAB1R Heteromers in PTGs from Patients with 1° HPT and 2° HPT.
(a,b) Representative images of fluorescent PLA signals (in red) of CaSR/GABAB1R heteromers in parts of the excised glands that represent the adenoma (zones 3 and 4) and adjacent normal parathyroid tissue (zones 1 and 2) in sections of (a) PTG tumor from a patient with surgically proven 1° HPT, or (b) hyperplastic nodules in the PTG removed from a patient with 2° HPT. Blue fluorescence indicates DAPI nuclear staining. There sections from each sample (patents) were stained independently in 3 separate experiments and the averaged value was used for statistical analyses shown below. (c) Corresponding histograms comparing expression levels of CaSR/GABAB1R heteromers (left plot), or individual receptors (central and right plots) from abnormal parathyroid tissues to expression levels in normal parathyroid tissues (NL*) excised together with hyperplasic PTGs as seen in panels (a) and (b) or removed during thyroid surgery from patients without known parathyroid diseases (NL, images not shown). The increased levels of CaSR/GABAB1R heteromer were accompanied by reduced CaSR and GABAB1R expression (see Supplementary Fig. 5a,b for representative images) in both HPT states. Data are the Mean ± s.e.m. of n= 5–8 (NL*), 5 (NL) , 5–8 (1° HPT), and 5–7 (2° HPT) biologically independent PTGs samples (patients)/3 independent experiments. P-values between groups indicated were determined by one-way ANOVA with Sidak’s test.
Figure 6.
Figure 6.. Impacts of GABAB1R KO on PTH Secretory Functions and Mineral and Hormonal Status in Mouse Models of Hereditary HPT and Chronic Ca2+-deficiency.
(a) Pictures of 3-month-old male mice with heterozygous or homozygous GABAB1R KO in the background of heterozygous or homozygous CaSR KO in their PTCs and their control littermates and 3-week-old mice with homozygous CaSR KO, which usually die between 3–4 weeks of age. (b–d) Average body weights (B.Wt.) (c), sPTH (d) and Ca2+ levels (d) in mice with PTG-specific heterozygous (+/−) or homozygous (−/−) CaSR and heterozygous (+/−) or homozygous (−/−) GABAB1R KO and control littermates carrying floxed-alleles without PTH-Cre expression. Mean ± s.e.m. of n mice for each group as indicated below the genotype. *P < 0.05, **P < 0.01 between groups by one-way ANOVA with Sidak’s test. (e, f) Assessments of PTH secretory properties (PTH-Max and Ca2+-set-point) of PTGs (2 per group) from the 3-month-old mice with heterozygous (e) or homozygous (f) CaSR KO without (blue or brown circle) or with (magenta or yellow square) homozygous GABAB1R KO and their control littermates (gray circle). Mean ± s.e.m. of n mice as indicated in the plots. **P < 0.01 vs PTGCaSR+/–//GABAB1R+/+ mice in panel E or vs PTGCaSR−/−//GABAB1R+/+ mice in panel F by two-way ANOVA with Sidak’s test. (g) Serum PTH and Ca2+ levels in 16-wk-old male PTGGABAB1RKO and Control (Cont) littermates after feeding with normal (1%) or low Ca2+ (0.02%) diets for 4 weeks. Mean ± s.e.m. of n = 8–12 mice as indicated, *P < 0.05 and **P < 0.01 between groups indicated by one-way ANOVA with Sidak’s test.
Figure 7.
Figure 7.. Proposed Model Illustrating the Role of GABA and GABAB1R in PTGs.
We propose that GABA made by parathyroid GAD1/2 acts as an autocrine pathway to activate GABAB1R in the GABAB1R/CaSR heteromers to block G-protein signaling of the CaSR/CaSR homomers in PTGs, thus promoting PTH secretion, and that increased expression and/or activation of GABAB1R/CaSR heteromers underlie the PTH hypersecretion in different HPT states. The presented stoichiometric composition of the receptor complex is speculative and remains to be determined.

Similar articles

Cited by

References

    1. Hannan FM, Kallay E, Chang W, Brandi ML & Thakker RV. The calcium-sensing receptor in physiology and in calcitropic and noncalcitropic diseases. Nat Rev Endocrinol 15, 33–51 (2018). - PMC - PubMed
    1. Conigrave AD. & Ward DT. Calcium-sensing receptor (CaSR): pharmacological properties and signaling pathways. Best Pract Res Clin Endocrinol Metab 27, 315–331 (2013). - PubMed
    1. Bandeira F, et al. Bone disease in primary hyperparathyroidism. Arq Bras Endocrinol Metabol 58, 553–561 (2014). - PMC - PubMed
    1. Bandeira L. & Bilezikian J. Primary Hyperparathyroidism. F1000Res 5(2016). - PMC - PubMed
    1. Brancaccio D. & Cozzolino M. CKD-MBD: an endless story. J Nephrol 24 Suppl 18, S42–48 (2011). - PubMed

Methods-only References

    1. Haller C, et al. Floxed allele for conditional inactivation of the GABAB(1) gene. Genesis 40, 125–130 (2004). - PubMed
    1. Chattopadhyaya B, et al. GAD67-mediated GABA synthesis and signaling regulate inhibitory synaptic innervation in the visual cortex. Neuron 54, 889–903 (2007). - PMC - PubMed
    1. Heusner CL, Beutler LR, Houser CR. & Palmiter RD. Deletion of GAD67 in dopamine receptor-1 expressing cells causes specific motor deficits. Genesis 46, 357–367 (2008). - PMC - PubMed
    1. Soderberg O, et al. Direct observation of individual endogenous protein complexes in situ by proximity ligation. Nat Methods 3, 995–1000 (2006). - PubMed
    1. Vilardaga JP. Studying ligand efficacy at G protein-coupled receptors using FRET. Methods Mol Biol 756, 133–148 (2011). - PMC - PubMed

Publication types

MeSH terms