. 2019 Feb;1(2):222-235.
doi: 10.1038/s42255-018-0028-1. Epub 2019 Jan 28.

Functional identity of hypothalamic melanocortin neurons depends on Tbx3

Affiliations

Functional identity of hypothalamic melanocortin neurons depends on Tbx3

Carmelo Quarta et al. Nat Metab. 2019 Feb.

Abstract

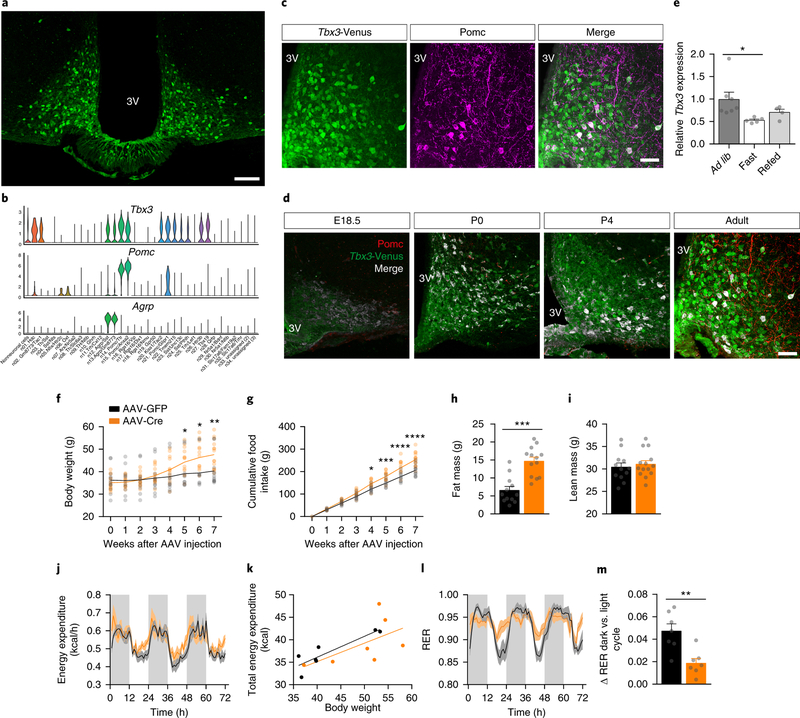
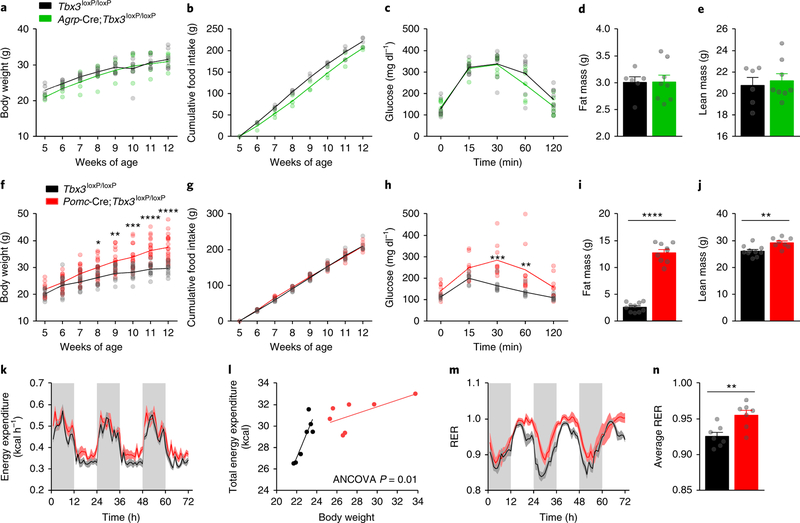
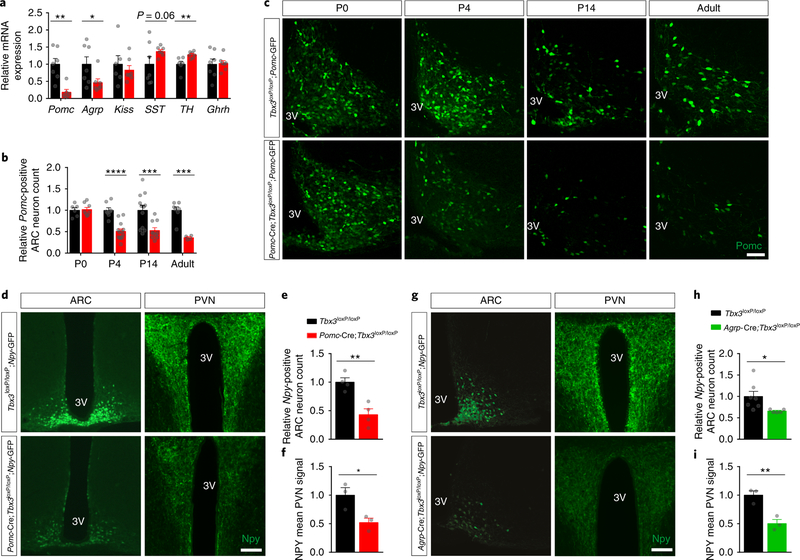
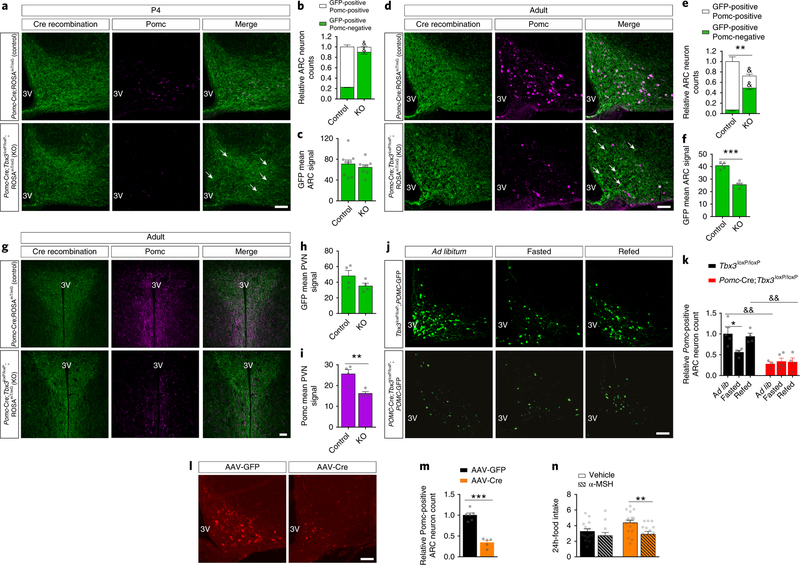
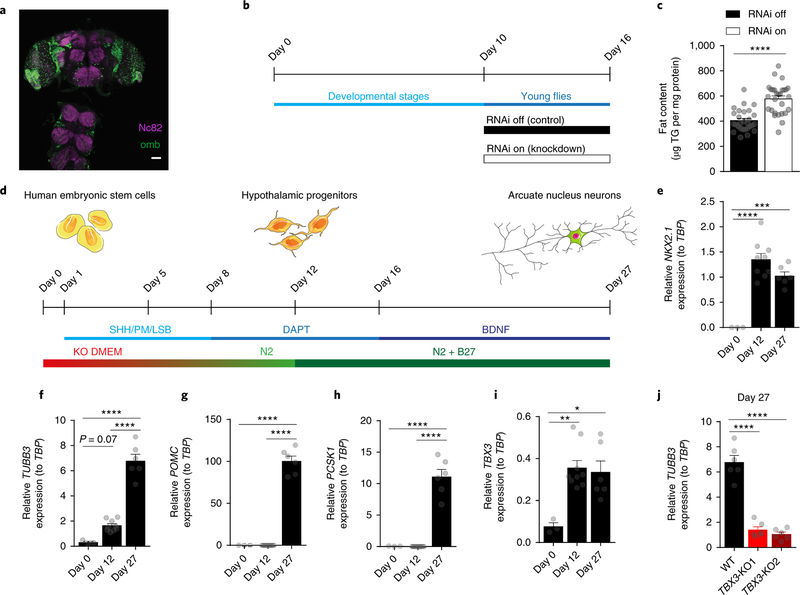
Heterogeneous populations of hypothalamic neurons orchestrate energy balance via the release of specific signatures of neuropeptides. However, how specific intracellular machinery controls peptidergic identities and function of individual hypothalamic neurons remains largely unknown. The transcription factor T-box 3 (Tbx3) is expressed in hypothalamic neurons sensing and governing energy status, whereas human TBX3 haploinsufficiency has been linked with obesity. Here, we demonstrate that loss of Tbx3 function in hypothalamic neurons causes weight gain and other metabolic disturbances by disrupting both the peptidergic identity and plasticity of Pomc/Cart and Agrp/Npy neurons. These alterations are observed after loss of Tbx3 in both immature hypothalamic neurons and terminally differentiated mouse neurons. We further establish the importance of Tbx3 for body weight regulation in Drosophila melanogaster and show that TBX3 is implicated in the differentiation of human embryonic stem cells into hypothalamic Pomc neurons. Our data indicate that Tbx3 directs the terminal specification of neurons as functional components of the melanocortin system and is required for maintaining their peptidergic identity. In summary, we report the discovery of a key mechanistic process underlying the functional heterogeneity of hypothalamic neurons governing body weight and systemic metabolism.


Figures

Figure 1.
Figure 1.. Loss of Tbx3 in hypothalamic neurons promotes obesity
(a) Representative image depicting Tbx3-positive neurons in the ARC of Tbx3-Venus mice, enhanced with GFP immunohistochemistry. Scale bar = 100 μm. (b) Violin plots depicting expression of Tbx3, Pomc and Agrp across neuronal clusters identified by Campbell et al. Of the 21,086 analyzed cells, 13,079 were identified as neurons and 8,007 as non-neurons based on the expression of the canonical neuronal marker Tubb3. The width of the violin plot at different levels of the log-transformed and scaled expression levels indicates high levels of expression of Tbx3 in neuron clusters 14 (Pomc/Ttr, n = 512), 15 (Pomc/Anxa2, n = 369) and 21 (Pomc/Glipr1, n = 310) compared to the other neuronal clusters. (c) Co-localization between Tbx3-Venus and Pomc in the ARC of Tbx3-Venus mice, assessed by immunohistochemistry. Scale bar = 50 μm. (d) Co-localization between Tbx3- and Pomc-expressing cells by immunohistochemistry in Tbx3-Venus mice during embryonic (E18.5), neonatal (P0, P4), and adult life (shown previously in Fig. 1c). (e) Quantification of Tbx3 mRNA levels by qRT-PCR in ARC micropunches isolated from adult (12-wk-old) C57BL/6J mice after 24 h of fasting (n=5), or 24 h of fasting followed by 6 h of refeeding (n=4), relative to mice fed ad libitum (n=7). (f) Body weight change and cumulative food intake (g) in adult Tbx3loxP/loxP mice after stereotaxic injection in the medio-basal hypothalamus (MBH) of AAV-Cre (n=14) or AAV-GFP (n=12) particles. (h) Fat mass of AAV-Cre (n=13) or AAV-GFP (n=12)-treated Tbx3loxP/loxP mice, 7 wk after surgery. (i) Lean mass of AAV-Cre (n=14) or AAV-GFP (n=12)-treated Tbx3loxP/loxP mice, 7 wk after surgery. (j) Hourly energy expenditure and total uncorrected energy expenditure correlated to body weight (k) in AAV-Cre (n=7) or AAV-GFP-treated (n=7) Tbx3loxP/loxP mice 4 wk after surgery. (l) Hourly respiratory exchange ratio (RER) and ΔRER averaged between night and day cycles (m) in AAV-Cre (n=7) or AAV-GFP-treated (n=7) Tbx3loxP/loxP mice 4 wk after surgery. 3V, third ventricle. In (k), individual data are presented, and lines depict the fitted regression. In all other analyses, data are mean ± SEM. In (e), *p=0.0476 relative to ad lib. using ANOVA followed by Tukey’s posttest. In (f), *p=0.0177, **p=0.0095 using ANOVA followed by Sidak’s post-test. In (g), **p=0.0028, ***p=0.0001 and ****p<0.0001 using ANOVA followed by Sidak’s post-test. In (h) and (m), ***p<0.0001 and **p=0.0029 and using two-tailed t-test. The experiments in (a) and (c) were repeated more than three independent times with similar results. The experiments in (d) were performed one time with several samples showing similar results.
Figure 2.
Figure 2.. Loss of Tbx3 in Pomc but not Agrp neurons triggers obesity.
(a) Body weight in Agrp-Cre;Tbx3loxP/loxP mice (n=5) relative to control littermates (n=8). (b) Cumulative food intake in Agrp-Cre;Tbx3loxP/loxP mice (n=3) relative to control littermates (n=4). (c) Glucose tolerance test in adult Agrp-Cre;Tbx3loxP/loxP mice (n=7) relative to control littermates (n=8). (d) Fat mass and lean mass (e) in adult Agrp-Cre;Tbx3loxP/loxP mice (n=8) relative to control littermates (n=6). (f) Body weight in Pomc-Cre;Tbx3loxP/loxP mice (n=18) relative to control littermates (n=11). (g) Cumulative food intake in Pomc-Cre;Tbx3loxP/loxP mice (n=7) relative to control littermates (n=7). (h) Glucose tolerance test in adult Pomc-Cre;Tbx3loxP/loxP mice (n=9) relative to control littermates (n=8). (i) Fat mass and lean mass (j) in adult Pomc-Cre;Tbx3loxP/loxP mice (n=9) relative to control littermates (n=10). (k) Hourly energy expenditure, and energy expenditure correlated to body weight (l), hourly respiratory exchange ratio (RER) (m), and average RER values (n), in 7-wk-old Pomc-Cre;Tbx3loxP/loxP mice (n=7) relative to control littermates (n=7). Data in (a-k), (m-n), are mean ± SEM. In (f), *p=0.02, **p=0.003, ***p=0.0001, ****p<0.0001 using ANOVA followed by Sidak’s post-test. In (h), **p=0.001, ***p=0.0002 using ANOVA followed by Sidak’s post-test. In (i-j), ****p<0.0001 and **p=0.0035 using two-tailed t-test. In (n), **p=0.0055 using two-tailed t-test.
Figure 3.
Figure 3.. Loss of Tbx3 impairs the postnatal melanocortin system.
(a) Quantification of enzyme and neuropeptide mRNA levels by qRT-PCR in ARC micropunches isolated from adult (12-wk-old) Pomc-Cre;Tbx3loxP/loxP mice (n=7) and control Tbx3loxP/loxP littermates (n=7). Kiss: kisspeptin, SST, somatostatin, TH, tyrosine hydroxylase, Ghrh, growth hormone-releasing hormone. (b) Quantification and representative images (c) of the relative number of Pomc-expressing neurons in the ARC of Pomc-Cre;Tbx3loxP/loxP;Pomc-GFP mice and in control littermates (Tbx3loxP/loxP;Pomc-GFP) at different stages of neonatal life, as well as in adult animals. Tbx3loxP/loxP;Pomc-GFP: n=6 (P0), n=8 (P4), n=12 (P14), n=7 (adult). Pomc-Cre;Tbx3loxP/loxP;Pomc-GFP: n=8 (P0), n=13 (P4), n=10 (P14), n=4 (adult). (d) Representative images and relative quantification (e) of Npy-positive neurons in the ARC of adult Pomc-Cre;Tbx3loxP/loxP;Npy-GFP mice (n=4) and control littermates (Tbx3loxP/loxP;Npy-GFP, n=4). (f) Npy-positive neuronal fibers in the PVN of adult Pomc-Cre;Tbx3loxP/loxP;Npy-GFP mice (n=3) and control littermates (Tbx3loxP/loxP;Npy-GFP, n=3). (g) Representative images and relative quantification (h) of Npy-positive neurons in the ARC of adult Agrp-Cre;Tbx3loxP/loxP;Npy-GFP mice (n=5) and control littermates (Tbx3loxP/loxP;Npy-GFP, n=7). (i) Npy-positive neuronal fibers in the PVN of adult Agrp-Cre;Tbx3loxP/loxP;Npy-GFP mice (n=3) and control littermates (Tbx3loxP/loxP;Npy-GFP, n=3). 3V, third ventricle. Scale bars in (c) are 50 μm and scale bars in (d-g) are 100 μm. Data (a-b), (e-f), and (h-i) are mean ± SEM. In (a), **p=0.0017 (Pomc), **p=0.0097 (TH), *p=0.0049 using two-tailed t-test. In (b), ****p<0.0001 (P4), ***p=0.0032 (P14), ***p=0.0002 (Adult) using two-tailed t-test. In (e-f), **p=0.0043, *p=0.034 using two-tailed t-test. In (h-i), *p=0.04, **p=0.0087 using two-tailed t-test. The experiments in (c) were repeated more than three independent times with similar results. The experiments in (d) and (g) were repeated two independent times with similar results.
Figure 4.
Figure 4.. Tbx3 is critical for the differentiation of Pomc neurons
(a) Representative images and relative quantification (b) of GFP-expressing neurons (Cre recombination) and Pomc-positive neurons in the ARC of P4-old Pomc-Cre;Tbx3loxP/loxP;ROSAmT/mG mice (n=8) relative to controls (Tbx3loxP/loxP;ROSAmT/mG, n=9), assessed by immunohistochemistry. Arrows depict GFP-positive/Pomc-negative cells. (c) Relative densitometric analysis of Cre recombination (GFP immunoreactivity) in the ARC of P4old Pomc-Cre;Tbx3loxP/loxP;ROSAmT/mG mice (n=8) and controls (n=9). (d) Representative images and relative quantification (e) of GFP-expressing neurons (Cre recombination) and Pomc-positive neurons in the ARC of adult (12-wk old) Pomc-Cre;Tbx3loxP/loxP;ROSAmT/mG mice (n=4) and controls (n=4), assessed by immunohistochemistry. Arrows depict GFP-positive/Pomc-negative cells. (f) Relative densitometric analysis of Cre recombination (GFP immunoreactivity) in the ARC of adult Pomc-Cre;Tbx3loxP/loxP;ROSAmT/mG mice (n=4) and controls (n=4). (g) Representative images depicting Cre recombination (GFP immunoreactivity) and Pomc-positive neuronal fibers in the paraventricular nucleus (PVN) of adult Pomc-Cre;Tbx3loxP/loxP;ROSAmT/mG mice and controls, assessed by immunohistochemistry. (h) Relative densitometric analysis of Cre recombination (GFP immunoreactivity) and Pomc immunoreactivity (i) in the PVN of adult Pomc-Cre;Tbx3loxP/loxP;ROSAmT/mG mice (n=4) and controls (n=4). (j) Representative image and cell number quantification (k) of Pomc-positive neurons in the ARC of adult Pomc-Cre;Tbx3loxP/loxP;Pomc-GFP mice or control littermates (Tbx3loxP/loxP;Pomc-GFP) after 15-h of fasting with or without 2 h of refeeding. Tbx3loxP/loxP;Pomc-GFP: n=4 for each condition. Pomc-Cre;Tbx3loxP/loxP;Pomc-GFP: n=3 (Ad lib), n=5 (Fasted), n=4 (Refed). (l) Representative images and relative quantification (m) of Pomc-expressing neurons in the ARC of adult Tbx3loxP/loxP mice 7 wk after AAV-Cre (n=5) or AAV-GFP (n=6) MBH injection. (n) 24-h food intake measured in adult Tbx3loxP/loxP mice 7 wk after AAV-Cre or AAV-GFP MBH injection, following intracerebroventricular administration of vehicle or αMSH. AAV-Cre: n=18 (vehicle), n=15 (αMSH). AAV-GFP: n=14 (vehicle), n=12 (αMSH). 3V, third ventricle. Scale bars in (a-d-g-j-l) are 50 μm. Data are mean ± SEM. In (b) and (e), &p<0.0001 for comparisons of GFP-positive/Pomc-positive or GFP-positive/Pomc-negative sub-populations counts between PomcCre;Tbx3loxP/loxP;ROSAmT/mG mice and controls, **p=0.0025 for comparison between total number of Cre-recombined neurons of Pomc-Cre;Tbx3loxP/loxP;ROSAmT/mG mice and controls, using ANOVA followed by Sidak’s posttest. In (f) and (i), ***p=0.0003 and **p=0.0071 using two-tailed t-test. In (k), *p=0.04, &&p=0.011 comparing Ad lib Pomc-Cre;Tbx3loxP/loxP;ROSAmT/mG mice vs Ad lib controls, &&p=0.027 comparing Refed Pomc-Cre;Tbx3loxP/loxP;ROSAmT/mG mice vs Refed controls, by ANOVA followed by Tukey’s post-test. In (m), ***p<0.0001 using two-tailed t-test. In (n), **p=0.0061 by ANOVA followed by Tukey’s post-test. The experiments in (a) were repeated two independent times with similar results. The experiments in (d), (g), (j) were performed one time with several samples showing similar results. The experiments in (l) were repeated two independent times with similar results.
Figure 5.
Figure 5.. Tbx3 functions in Drosophila and human neurons
(a) Representative image depicting expression of the Drosophila Tbx3 ortholog omb (omb expression assessed via GFP in ombP3-Gal4>GFP flies) and Nc82 (neuronal marker) in the central nervous system of Drosophila melanogaster. Scale bar = 50 μm. (b) Timeline of RNA interference (RNAi) knockdown of omb (RNAi on), and control flies (RNAi off). (c) Quantification of Drosophila body fat content following knockdown of omb (RNAi on, n=28) compared to controls (RNAi off, n=28) using the omb-RNAi line 1. (d) Differentiation of human ESC into hypothalamic arcuate-like neurons. The combination of dual SMAD inhibition (L, LDN193189, 2.5 μM; SB, SB431542, 10 μM), early activation of sonic hedgehog (SHH) signaling (100 ng/ml SHH; SHH agonist PM, purmorphamine, 2 μM) and step-wise switch from ESC medium (KO DMEM) to neural progenitor medium (N2) followed by inhibition of Notch signaling (DAPT, 10 μM) converts hESC into hypothalamic progenitors. For neuronal maturation, cells are cultured in neuronal medium (N2 + B27), treated with DAPT and subsequently exposed to BDNF (brain-derived neurotrophic factor, 20 ng/ml). Gene expression analyses of (e) NKX2.1, (f) TUBB3, (g) POMC, (h) PCSK1, and (i) TBX3 over the time course of differentiation of ESC into hypothalamic neurons by qRT-PCR. (j) Gene expression analysis by qRT-PCR of TUBB3 in wildtype (WT) human ESC clones and in TBX3 knockout (TBX3-KO1 and TBX3-KO2) cell lines at ARC-like neurons (Day 27) stage. Data are mean ± SEM. In (e-i), n=3 (day 0), n=9 (day 12), n=6 (day 27). In (j), n=6 per group. In (c), ****p<0.0001 using two-tailed t-test. In (e), ****p<0.0001 and ***p=0.0005 using ANOVA followed by Tukey’s post-test. In (f-i), *p=0.01,**p=0.0039, and ****p<0.0001 using ANOVA followed by Tukey’s post-test. In (j), ****p<0.0001 using ANOVA followed by Dunnett’s post-test. The experiment in (a) was repeated two independent times with similar results.

References

    1. Cone RD Anatomy and regulation of the central melanocortin system. Nat. Neurosci 8, 571–578 (2005). - PubMed
    1. Gautron L, Elmquist JK & Williams KW Neural control of energy balance: translating circuits to therapies. Cell 161, 133–145 (2015). - PMC - PubMed
    1. Koch M. & Horvath TL Molecular and cellular regulation of hypothalamic melanocortin neurons controlling food intake and energy metabolism. Mol. Psychiatry 19, 752–761 (2014). - PubMed
    1. Morton GJ, Meek TH & Schwartz MW Neurobiology of food intake in health and disease. Nat. Rev. Neurosci 15, 367–378 (2014). - PMC - PubMed
    1. Knight ZA et al. Molecular profiling of activated neurons by phosphorylated ribosome capture. Cell 151, 1126–1137 (2012). - PMC - PubMed

Publication types