Comparative Study
. 2020 Jul;2(7):594-602.
doi: 10.1038/s42255-020-0210-0. Epub 2020 May 25.

Comparative evaluation of itaconate and its derivatives reveals divergent inflammasome and type I interferon regulation in macrophages

Affiliations
Comparative Study

Comparative evaluation of itaconate and its derivatives reveals divergent inflammasome and type I interferon regulation in macrophages

Amanda Swain et al. Nat Metab. 2020 Jul.

Abstract

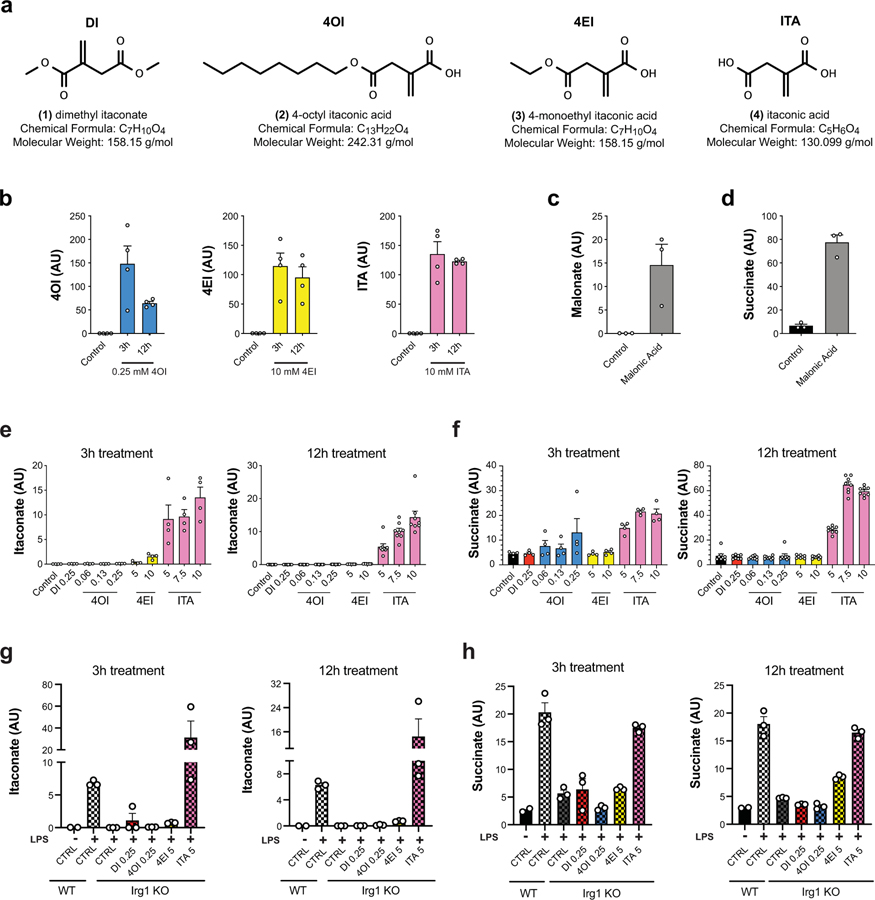
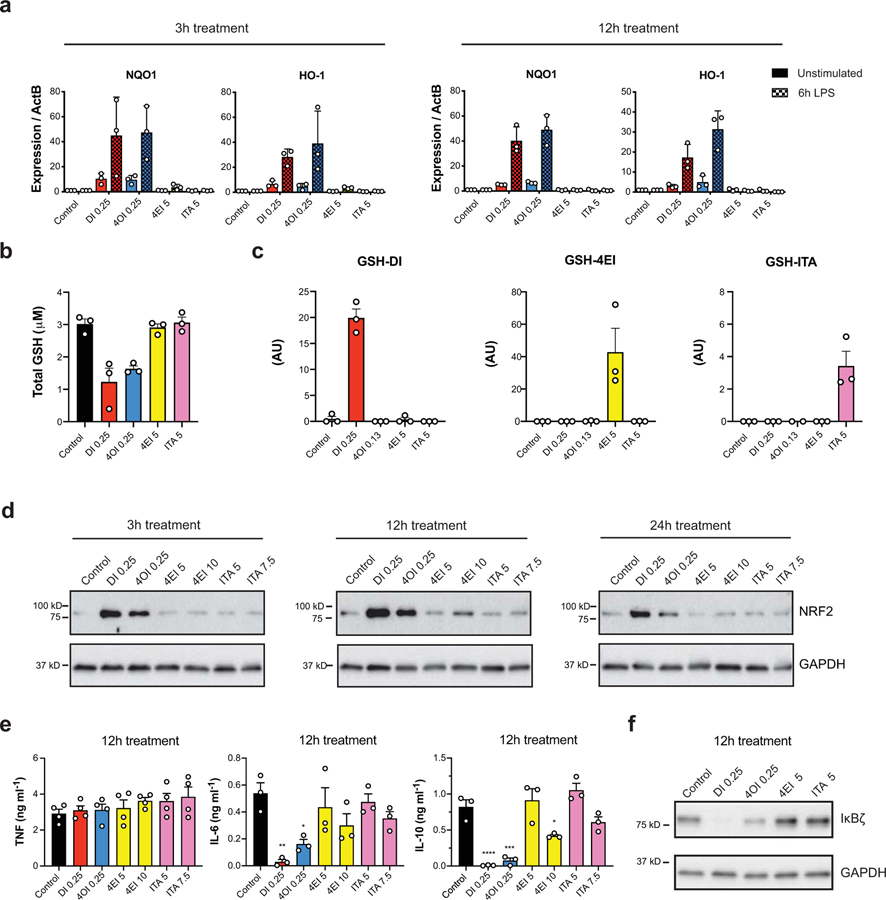
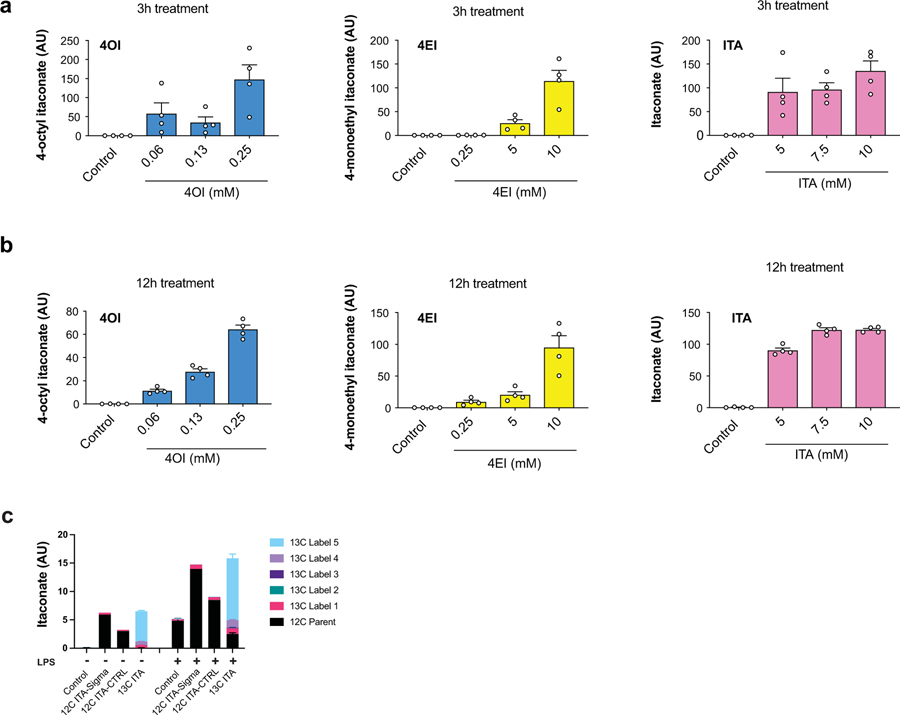
Following activation, macrophages undergo extensive metabolic rewiring1,2. Production of itaconate through the inducible enzyme IRG1 is a key hallmark of this process3. Itaconate inhibits succinate dehydrogenase4,5, has electrophilic properties6 and is associated with a change in cytokine production4. Here, we compare the metabolic, electrophilic and immunologic profiles of macrophages treated with unmodified itaconate and a panel of commonly used itaconate derivatives to examine its role. Using wild-type and Irg1-/- macrophages, we show that neither dimethyl itaconate, 4-octyl itaconate nor 4-monoethyl itaconate are converted to intracellular itaconate, while exogenous itaconic acid readily enters macrophages. We find that only dimethyl itaconate and 4-octyl itaconate induce a strong electrophilic stress response, in contrast to itaconate and 4-monoethyl itaconate. This correlates with their immunosuppressive phenotype: dimethyl itaconate and 4-octyl itaconate inhibited IκBζ and pro-interleukin (IL)-1β induction, as well as IL-6, IL-10 and interferon-β secretion, in an NRF2-independent manner. In contrast, itaconate treatment suppressed IL-1β secretion but not pro-IL-1β levels and, surprisingly, strongly enhanced lipopolysaccharide-induced interferon-β secretion. Consistently, Irg1-/- macrophages produced lower levels of interferon and reduced transcriptional activation of this pathway. Our work establishes itaconate as an immunoregulatory, rather than strictly immunosuppressive, metabolite and highlights the importance of using unmodified itaconate in future studies.


Conflict of interest statement

Competing interests statement

The authors declare that they have no competing interests.

Figures

Figure 1:
Figure 1:. Unmodified itaconate accumulates in macrophages and promotes succinate accumulation
a, Chemical structures of itaconate and its derivatives. b, Intracellular levels (n = 4 cultures) of 4OI (blue), 4EI (yellow), and itaconate (pink) after 3h or 12h treatment with the indicated compound in WT BMDMs. Intracellular detection of DI is not amenable to the electrospray ionization LCMS method used for these experiments. c, d, Intracellular levels (n = 3 cultures) of malonate (c) and succinate (d) in WT BMDMs after 3h treatment with 5 mM malonic acid. e, Intracellular levels of itaconate after 3h (n = 4 cultures) or 12h (n = 8 cultures) treatment with the indicated compounds in WT BMDMs. f, Intracellular levels of itaconate after 3h or 12h treatment (n = 3 cultures, except for WT CTRL n = 2 cultures) with the indicated compounds followed by 24h static incubation (unstimulated) or 24h LPS stimulation in WT or Irg1−/− BMDMs. g, Intracellular levels of succinate after 3h (n = 4 cultures) or 12h (n = 8 cultures) treatment with the indicated compounds in WT BMDMs. h, Intracellular levels of succinate after 3h or 12h treatment (n = 3 cultures, except for WT CTRL n = 2 cultures) with the indicated compounds followed by 24h static incubation (unstimulated) or 24h LPS stimulation in WT or Irg1−/− BMDMs. Treatment concentrations for all experiments are listed in mM. All bar plots representative of mean ± s.e.m., except where n < 3 only the mean is depicted. AU = arbitrary units based on mass spectrometry peak area and is not directly comparable between experiments.
Figure 2:
Figure 2:. DI and 4OI induce strong electrophilic stress signatures in WT BMDMs
a, mRNA expression in WT BMDMs pre-treated by the indicated compounds for 3h (left) or 12h (right) followed by either static incubation for 6h (unstimulated) or 6h LPS (n = 3 cultures). b, Total intracellular GSH levels after 3h treatment with the indicated compounds (n = 3 independent experiments). c, Intracellular levels of GSH-DI (red), GSH-4EI (yellow), and GSH-ITA (pink) after 3h treatment with the indicated compounds (n = 3 cultures). AU = arbitrary units based on mass spectrometry peak area, and is not directly comparable between experiments. GSH-4OI was not amenable to detection by this method. d, Western blots for NRF2 from WT BMDM cell lysates after 3h (left), 12h (middle), or 24h (right) treatment with the indicated compounds. Westerns representative of 3 independent experiments. e, Cytokine levels in WT BMDMs pre-treated with the indicated compounds for 12h followed by 4h LPS stimulation (for TNF n = 4 independent experiments, for IL-6 and IL-10 n = 3 independent experiments). * P < 0.05, ** P < 0.01, *** P < 0.001, **** P < 0.0001, P values calculated using one way ANOVA. Exact P values listed in Supplementary Information in Source Data files. f, Western blot of IκBζ expression in WT BMDMs pre-treated with the indicated compounds for 12h followed by 1h LPS stimulation. Westerns representative of 3 independent experiments. Treatment concentrations for all experiments listed in mM. All bar plots representative of mean ± s.e.m.
Figure 3:
Figure 3:. Itaconate inhibits IL-1β secretion in WT BMDMs at the level of signal 2
a, Westerns blots of pro-IL-1β expression in WT BMDMs pre-treated with the indicated compounds for 3h (top) or 12h (bottom) followed by 4h LPS stimulation. Westerns representative of 3 independent experiments. b, Western blot quantifications (n = 3 independent experiments). c, d, Secreted mature IL-1β levels in WT BMDMs pre-treated with the indicated compounds for 3h (top) or 12h (bottom) followed by 4h LPS stimulation (for (c) n = 4 independent experiments, except for 7.5 mM ITA n = 3 independent experiments, for (d) n = 3 independent experiments). MA = malonic acid, SA = succinic acid. e, Western blots of pro-IL-1β expression in Nrf2−/− BMDMs pre-treated with the indicated compounds for 3h (top) or 12h (bottom) followed by 4h LPS stimulation. Westerns representative of 3 independent experiments. f, Secreted mature IL-1β levels in Nrf2−/− BMDMs pre-treated with the indicated compounds for 3h (top) or 12h (bottom) followed by 4h LPS stimulation (n = 3 independent experiments) * P < 0.05, ** P < 0.01, *** P < 0.001, P values calculated using one way ANOVA. Exact P values listed in Supplementary Information in Source Data files. Treatment concentrations for all experiments listed in mM. All bar plots representative of mean ± s.e.m.
Figure 4:
Figure 4:. Itaconate boosts type I interferon signaling
a, b, IFN-β levels in WT BMDMs pre-treated with the indicated compounds for 3h or 12h followed by 4h LPS stimulation (n = 3 independent experiments for 3h treatment, n = 8 independent experiments for 12h treatment). ** P < 0.01, **** P < 0.0001, P values calculated using one way ANOVA. Exact P values listed in Supplementary Information in Source Data files. c, IFN-β levels in WT BMDMs pre-treated with the indicated compounds for 12h followed by 4h LPS stimulation (n = 3 independent experiments). MA = malonic acid, SA = succinic acid. d, IFN-β levels in WT or Irg1−/− BMDMs after 4h LPS (n = 4 independent experiments, P = 0.0335, P value calculated by paired two-tailed t test.) e, f, Transcriptional comparison (e) and selected genes (f) regulated by the presence of itaconate after 24h LPS stimulation in WT and Irg1−/− BMDMs or Irg1−/− BMDMs with the addition of 1 mM itaconate 4h after the addition of LPS (n = 3 replicates for each group; GSEA statistics on 12,000 genes after filtering.) Treatment concentrations for all experiments listed in mM. All bar plots representative of mean ± s.e.m.
None
None
None
None
None
None
None

References

    1. Everts B et al. Commitment to glycolysis sustains survival of NO-producing inflammatory dendritic cells. Blood (2012). 10.1182/blood-2012-03-419747 - DOI - PMC - PubMed
    1. Jha AK et al. Network integration of parallel metabolic and transcriptional data reveals metabolic modules that regulate macrophage polarization. Immunity (2015). 10.1016/j.immuni.2015.02.005 - DOI - PubMed
    1. Michelucci A et al. Immune-responsive gene 1 protein links metabolism to immunity by catalyzing itaconic acid production. Proc. Natl. Acad. Sci. U. S. A (2013). 10.1073/pnas.1218599110 - DOI - PMC - PubMed
    1. Lampropoulou V et al. Itaconate Links Inhibition of Succinate Dehydrogenase with Macrophage Metabolic Remodeling and Regulation of Inflammation. Cell Metab (2016). 10.1016/j.cmet.2016.06.004 - DOI - PMC - PubMed
    1. Cordes T et al. Immunoresponsive gene 1 and itaconate inhibit succinate dehydrogenase to modulate intracellular succinate levels. J. Biol. Chem (2016). 10.1074/jbc.M115.685792 - DOI - PMC - PubMed

Publication types

MeSH terms