. 2020 Jul;2(7):620-634.
doi: 10.1038/s42255-020-0217-6. Epub 2020 Jun 8.

Catecholamines suppress fatty acid re-esterification and increase oxidation in white adipocytes via STAT3

Affiliations

Catecholamines suppress fatty acid re-esterification and increase oxidation in white adipocytes via STAT3

Shannon M Reilly et al. Nat Metab. 2020 Jul.

Abstract

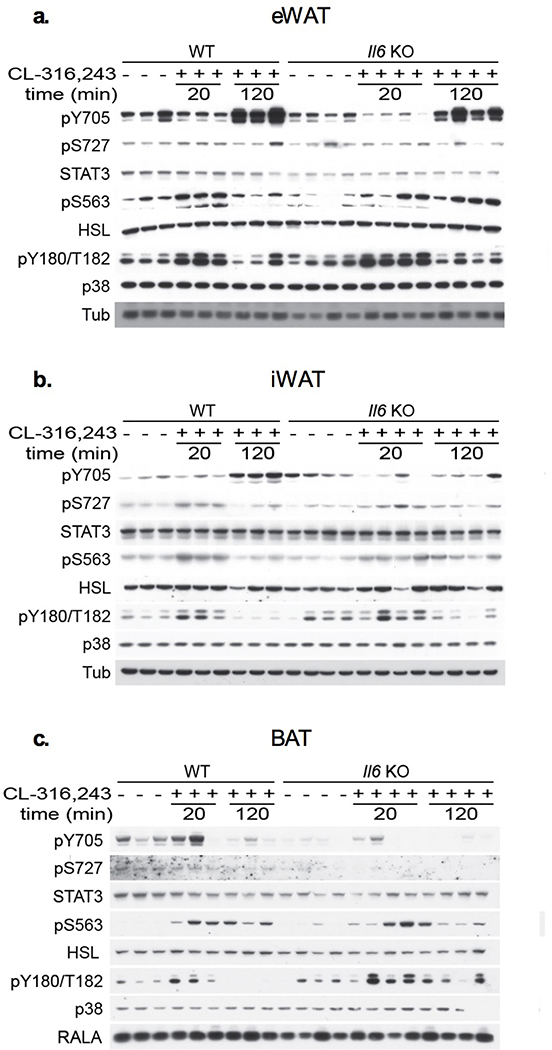
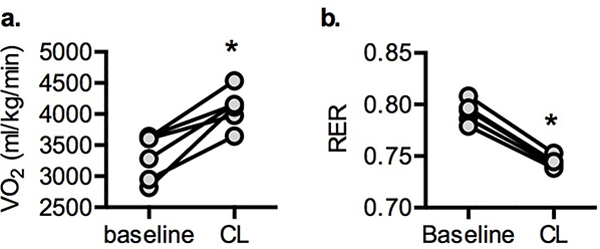
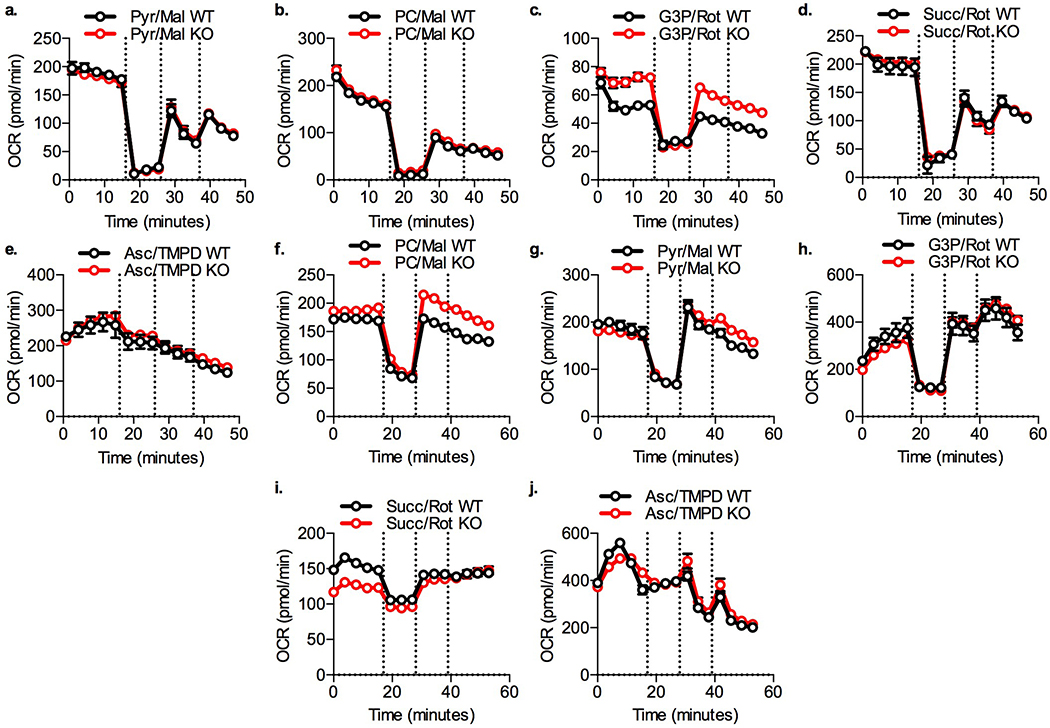
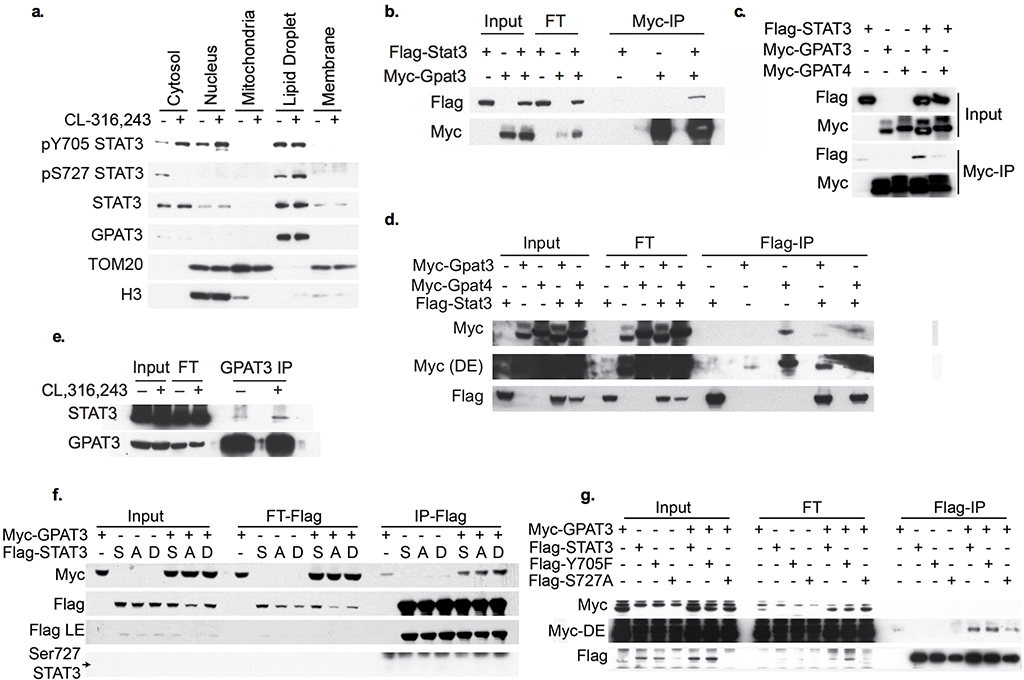
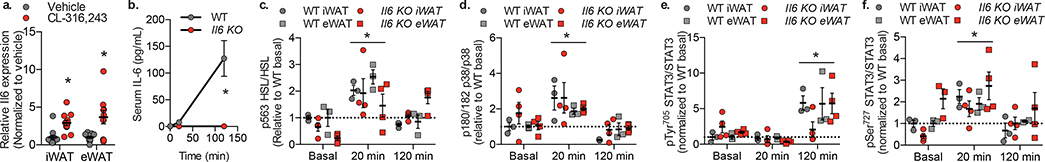
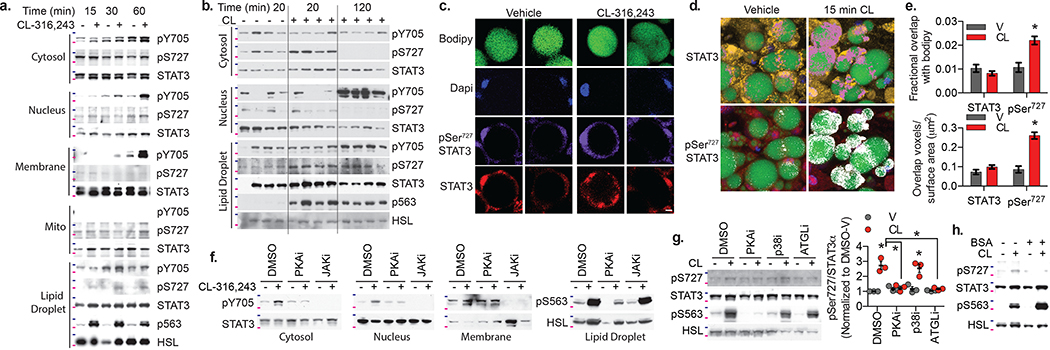
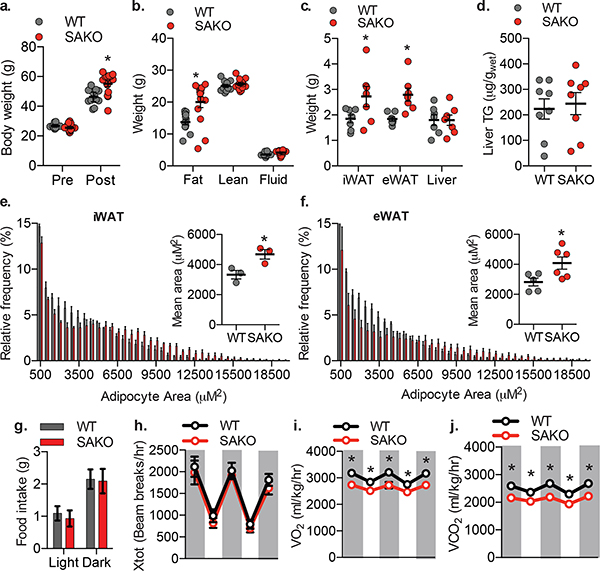
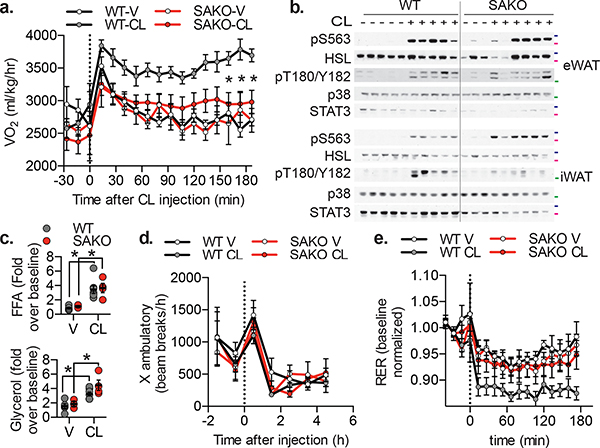
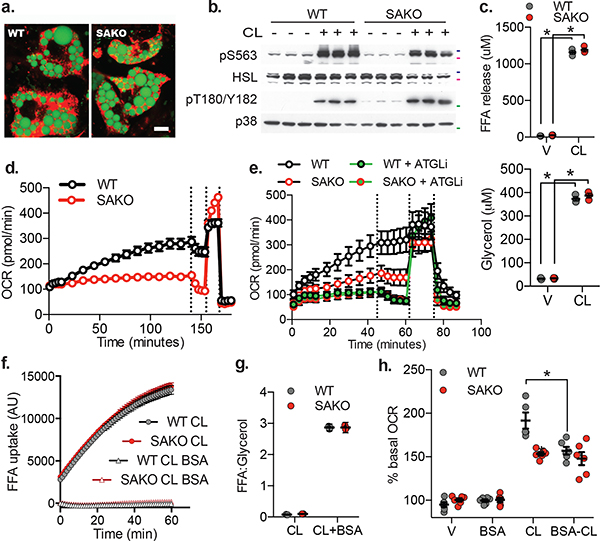
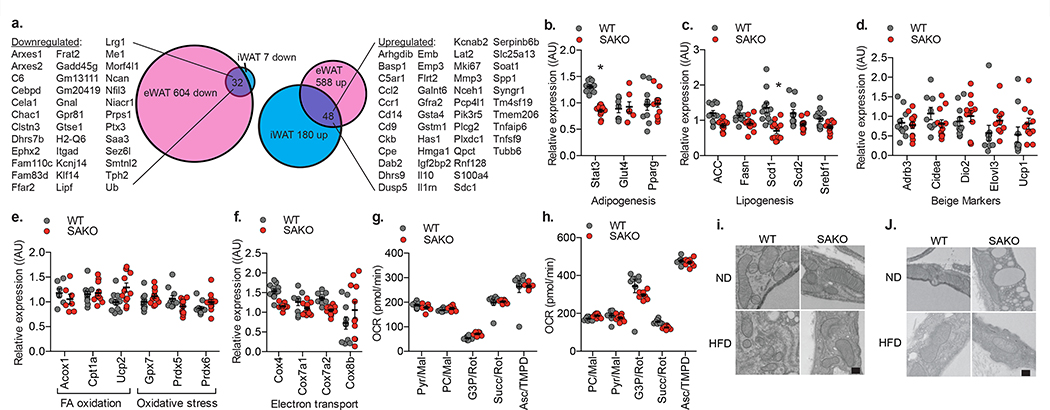
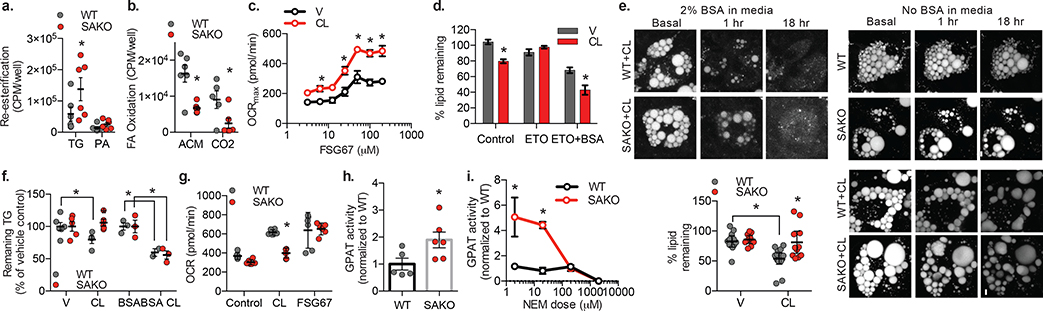
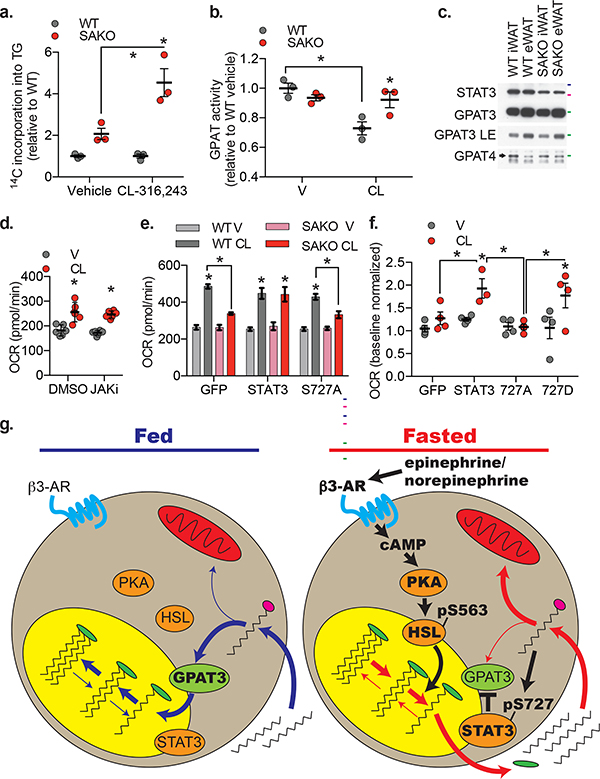
Catecholamines stimulate the mobilization of stored triglycerides in adipocytes to provide fatty acids (FAs) for other tissues. However, a large proportion is taken back up and either oxidized or re-esterified. What controls the disposition of these FAs in adipocytes remains unknown. Here, we report that catecholamines redirect FAs for oxidation through the phosphorylation of signal transducer and activator of transcription 3 (STAT3). Adipocyte STAT3 is phosphorylated upon activation of β-adrenergic receptors, and in turn suppresses FA re-esterification to promote FA oxidation. Adipocyte-specific Stat3 KO mice exhibit normal rates of lipolysis, but exhibit defective lipolysis-driven oxidative metabolism, resulting in reduced energy expenditure and increased adiposity when they are on a high-fat diet. This previously unappreciated, non-genomic role of STAT3 explains how sympathetic activation can increase both lipolysis and FA oxidation in adipocytes, revealing a new regulatory axis in metabolism.


Conflict of interest statement

Competing Interests Statement:

The authors declare no competing interests.

Figures

Extended Data Fig. 1:
Extended Data Fig. 1:. Catecholamine signaling in white and brown adipose tissue.
Western blot analysis of WT and SAKO mice fed a HFD for 12 weeks, then treated with 1 mg/kg CL-316,243 or vehicle control for indicated time before sacrifice and tissue collection. a. Epididymal white adipose tissue. b. Inguinal white adipose tissue. Outlier detected with Grubs outlier test removed. c. Brown adipose tissue. Blots are representative of results from three independent experiments
Extended Data Fig. 2:
Extended Data Fig. 2:. Fractionation of 3T3-L1 differentiated adipocytes
Relative levels of β-tubulin (cytosol marker), H3 (nuclear marker), Calnexin (ER/membrane marker), TOM20 (mitochondrial marker) and Perilipin1 (lipid droplet marker) in fractionated samples from time course analysis in Fig. 2a. Cytosol, nucleus, membrane and mitochondria run on the same gel. These experiments were repeated independently four times with similar results.
Extended Data Fig. 3:
Extended Data Fig. 3:. Metabolic phenotype of SAKO mice on a normal diet (ND)
a. Left panel: Western blot of mature adipocytes isolated from 12-week old WT and SAKO mice. Right panel: Quantification of STAT3 protein relative to RalA loading control. Individual data points plotted ± SEM (n = 3 iWAT, 2 eWAT). b. Body weight of 12-week old ND fed WT and SAKO mice. Individual data points plotted ± SEM (n = 6 per genotype). c. Oxygen consumption rate in ND fed WT and SAKO mice at 16-weeks of age. Data are represented as mean ± SEM (n = 16). d. Adipocyte size distribution from ND-fed 12-week old WT and SAKO eWAT (n = 2 WT and 3 SAKO). e. Adipocyte size distribution from ND-fed 12-week old WT and SAKO iWAT (n = 2 WT and 3 SAKO). f. Body composition of ND fed WT and SAKO mice at 12 weeks of age. Individual data points plotted ± SEM (n =6 WT and 4 SAKO).
Extended Data Fig. 4:
Extended Data Fig. 4:. Histology from HFD-fed WT and SAKO mice
From top to bottom, eWAT (scale bar = 100 μm), iWAT (scale bar = 100 μm), BAT (scale bar = 50 μm), and liver (scale bar = 100 μm). Results are representative of results from three independent experiments
Extended Data Fig. 5:
Extended Data Fig. 5:. Effect of CL-316,243 on metabolism
a. Oxygen consumption and b. RER before and after intraperitoneal injection with 1 mg/kg CL-316,243. Individual data points plotted ± SEM (n = 6 per treatment). * p value = 0.002 (VO2) and <0.0001 (RER) CL versus baseline (two-tailed paired t-test).
Extended Data Fig. 6:
Extended Data Fig. 6:. Mitochondria bioenergetics profiles
a.-e. Isolated mitochondria. Vertical lines indicate addition of oligomycin (2 μM), and FCCP (two sequential additions of 3 μM). a. 4 mM ADP + 5 mM pyruvate + 1 mM malate, b. 40 μM palmitoyl-carnitine + 1 mM malate, c. 5 mM succinate + 2 μM rotenone, d. 5 mM glycerol 3 phosphate + 2 μM rotenone 700 nM CaCl2, e. 20 mM ascorb-ate + 200 μM Tetramethyl-p-Phenylenediamine. f.-j. Permeabilized PPDIVs. Vertical lines indicate addition of oligomycin (2 μM), and FCCP (two sequential additions of 2 μM). f. 40 μM palmitoylcarnitine + 1 mM malate, g. 4 mM ADP + 5 mM pyruvate + 1 mM malate, h. 5 mM succinate + 2 μM rotenone, i. 5 mM glycerol 3 phosphate + 2 μM rotenone 700 nM CaCl2, j. 20 mM ascorbate + 200 μM Tetramethyl-p-Phenylenediamine. Data are represented as mean ± SEM (n = 8 per genotype).
Extended Data Fig. 7:
Extended Data Fig. 7:. STAT3/GPAT3 interaction
a. Western blot analysis of fractionated 3T3-L1 adipocytes treated with 10 μM CL-316,243 or vehicle control for 60 min. b.-d. and f. Western blot analysis of input, flow through and immunoprecipitation using Myc-antibody coated beads (b, c) or Flag-antibody coated beads (d, f) of HEK293T cell lysates overexpressing Flag-tagged STAT3 and/or Myc-tagged GPAT3/GPAT4. Blots are representative of three independent replicates. Dark exposure (D.E.). e. Western blot analysis of input and immunoprecipitation using GPAT3 antibody in 3T3-L1 differentiated adipocytes treated with 10 μM CL-316,243 or vehicle control for 15 min. f. Western blot analysis of input, flow through and immunoprecipitation using Flag antibody coated beads of HEK293T cell lysates overexpressing Flag-tagged STAT3 (WT/S727A/S727D) and/or Myc-tagged GPAT3. Blots are representative of three independent replicates. Arrow indicates expected size of Ser727 phosphorylated STAT3; the band observed in the IP samples is a larger non-specific band. g. Western blot analysis of input, flow through, and immunoprecipitation using Flag antibody coated beads from 3T3-L1 differentiated adipocytes with lentiviral overexpression of flag-tagged STAT3 (WT/Y705F/S727A) and/or Myc-tagged GPAT3, cells treated with 10 μM CL-316,243 or vehicle control for 60 min before harvest and IP. These experiments were repeated independently twice with similar results.
Fig. 1:
Fig. 1:. Stat3 is phosphorylated in response to β-adrenergic receptor activation in adipocytes.
a. Il6 expression in 12-week high fat diet (HFD) fed C57BL/6 mice treated with 1 mg/kg CL-316,243 or vehicle control for 30 minutes before sacrifice and tissue collection. Expression levels normalized to vehicle within each tissue. Individual data points plotted ± SEM (n = 12 mice per treatment group). p value = 0.0003 (iWAT) and 0.006 (eWAT) b. Serum IL-6 levels in 12-week HFD fed C57BL/6 mice treated with 1 mg/kg CL-316,243 or vehicle control before sacrifice and blood collection. Data are represented as mean ± SEM (n = 3 mice per genotype at each time point). p value < 0.0001 WT vs Il6 KO. Quantification of phosphorylation of c. HSL at serine 563 over total HSL (p value < 0.0001 20 min vs. basal) d. p38 at threonine 180 and tyrosine 182 over total p38 (p value = 0.003 20 min vs. basal) e. STAT3 at tyrosine 705 over total STAT3 (p value < 0.0001 120 min vs. basal) and f. STAT3 at serine 727 over total STAT3 (p value = 0.003 20 min vs. basal). c.-f. Western blots shown in Extended Data Fig. 1. Individual data points plotted ± SEM (n = 3 WT, 4 SAKO mice per time point). * p value < 0.05 from post hoc analysis after significant two-way ANOVA.
Fig. 2:
Fig. 2:. Localization and phosphorylation of Stat3 in catecholamine stimulated adipocytes.
a., f.-h. Western blot analysis of STAT3 phosphorylation in fractionated 3T3-L1 adipocytes treated with 10 μM CL-316,243; HSL phosphorylation in the lipid droplet fraction also shown to demonstrate effectiveness of CL-316,243 treatment. b. Western blot analysis of STAT3 phosphorylation in fractionated adipose tissue collected after intraperitoneal injection of 1 mg/kg CL-316,243 (20 or 120 min) or vehicle control (20 min after vehicle injection). c. Confocal images of PPDIVs stained with Bodipy, DAPI, STAT3 (Alex fluor 555 conjugated secondary) and pSer727 STAT3 (Alex fluor 647 conjugated secondary). Individual channels of two representative vehicle and CL treated cells shown. Scale bar = 10 μm. d. 3-D representation of z-stack images of PPDIVs stained with bodipy (green), Dapi (blue) STAT3 (yellow) or pSer727 STAT3 (red) are shown with colocalization of Bodipy and STAT3 shown in pink, and colocalization of Bodipy pSer727 STAT3 shown in white. e. Quantification of colocalization of STAT3 and pSer727 STAT3 with bodipy, normalized to lipid droplet volume (top) or lipid droplet surface area (bottom). Data are represented as mean ± SEM (n = 61 V and 64 CL lipids droplets) p value < 0.0001 WT versus SAKO pSer727. f. Cells pretreated with H89 (PKA inhibitor) or JAK inhibitor I for 30 min, before Cl-316,243 treatment for 60 min. g. Cells pretreated with H89, SB-303,580 or atglistatin for 30 min, before Cl-316,243 treatment for 15 min. Right panel: Quantification of Ser727 STAT3 phosphorylation in three independent experiments, data are represented as mean ± SEM. p value < 0.0001 DMSO v vs CL, CL DMSO vs. PKAi/ATGLi and = 0,003 p38i V vs CL. h. Cl-316,243 treatment performed in the presence or absence of 2% BSA in the media. Blots are representative of results from three independent experiments, 75 kDa and 100 kDa protein marker locations indicated in pink and blue respectively. Results in c-e were replicated in an independent experiment. * p value < 0.05 from post hoc analysis after significant two-way ANOVA.
Fig. 3:
Fig. 3:. Adipocyte Stat3 protects against diet-induced obesity.
a. Body weight of WT and SAKO mice before and after 12-weeks HFD. Individual data points plotted ± SEM (n = 12 WT and 14 SAKO mice). p value < 0.0001 WT vs. SAKO post HFD. b. Body composition by NMR after 12-weeks HFD. Individual data points plotted ± SEM (n = 12 WT and 14 SAKO mice). p value < 0.0001 WT vs. SAKO body fat. c. Tissue weights after 12-weeks HFD. Individual data points plotted ± SEM (n = 7 per genotype). d. Quantification of liver triglycerides, normalized to wet liver weight. Individual data points plotted ± SEM (n = 8 per genotype). p value = 0.02 WT vs. SAKO iWAT and eWAT. e. Histogram showing adipocyte size in iWAT 12-weeks HFD. Inset: bar graph showing mean adipocyte size. Individual data points plotted ± SEM (n = 3 per genotype) p value = 0.033. f. Histogram showing adipocyte size in eWAT 12-week HFD feeding. Inset: bar graph showing mean adipocyte size. Individual data points plotted ± SEM (n = 5 per genotype) p value = 0.033. g.-j. Metabolic cage experiment in WT and SAKO mice after 12-weeks HFD, dark cycle indicated by grey shading. Data are represented as mean ± SEM (n = 6 per genotype). g. Food intake. h. Ambulatory activity (x-axis). i. Oxygen consumption, p values = 0.012, 0.048, 0.006, 0.046, 0.012. j. Carbon dioxide production p values = 0.001, 0.005, 0.0003, 0.005, 0.0008. * p value < 0.05 from post hoc analysis after significant two-way ANOVA (a-c, i, j) or two sided student’s t-test (e and f).
Fig. 4:
Fig. 4:. Loss of adipocyte STAT3 causes a defect in oxidative metabolism in vivo.
a. Oxygen consumption in 12 week HFD-fed mice, injected with 1 mg/kg CL-316,243 or vehicle control. p values = 0.002, 0.0003, 0.002. b. Western blot analysis of 12-week HFD fed mice injected with 1 mg/kg CL-316,243 or vehicle control 20 min before sacrifice and tissue collection. 50 kDa, 75 kDa and 100 kDa protein marker locations indicated in green, pink and blue respectively, blots are representative of three independent experiments. c. Serum free fatty acid (top panelp value = 0.006 WT and 0.028 SAKO V vs CL) and glycerol (bottom panelp value = 0.027 WT and 0.010 SAKO V vs CL) levels in 12-week HFD fed mice injected with 1 mg/kg CL-316,243 or vehicle control for 20 min, normalized to the value in each animal prior to injection. Individual data points plotted ± SEM (n = 8 vehicle, 10 CL-316,243). d. Ambulatory activity and e. RER in 12 week HFD-fed mice, injected with 1 mg/kg CL-316,243 or vehicle control at time zero. p value < 0.0001 WT V vs. CL, and WT vs. SAKO CL. a., d. and e. Data are represented as mean ± SEM (n = 20). * p value < 0.05 from post hoc analysis after significant two-way ANOVA.
Fig. 5:
Fig. 5:. Loss of adipocyte STAT3 causes a cell autonomous defect in lipolysis driven oxidative metabolism.
a. Differentiated WT and SAKO PPDIVs, results are representative of dozens of independent experiments. Lipid droplet stained with Bodipy (shown in green). Mitochondria stained with MitoTracker (shown in red). Scale bar = 10 μm. b. Western blot analysis of WT and SAKO PPDIVs treated with 1 μM CL-316,243 for 20 min, results are representative of three independent experiments. 50 kDa, 75 kDa and 100 kDa protein marker locations indicated in green, pink and blue respectively. c. FA (top panel) and glycerol (bottom panel) secreted into the media from WT and SAKO PPDIV treated with 1 μM CL-316,243 or vehicle control for 20 min. Individual data points plotted ± SEM (n = 3 per treatment per genotype, p values < 0.0001). d., e., and h. Basal oxygen consumption rate in PPDIVs. Vertical lines indicate injection times for oligomycin, FCCP and Rotenone/Antimycin A. d. Data are represented as mean ± SEM (n = 8 wells per condition). e. Atglistatin pretreated for 15 min. e. Data are represented as mean ± SEM (n = 6 wells per condition). f. FA uptake in WT and SAKO PPDIV in the presence and absence of 2% BSA. Data are represented as mean ± SEM (n = 8 wells per condition). g. Ratio of FA to glycerol released into the media from WT and SAKO PPDIV in the presence and absence of 2% BSA. Data are represented as mean ± SEM h. Assay performed in the presence and absence of 0.2% BSA in the culture media. Oxygen consumption rates after 30 min vehicle or CL-316,243 shown as a percentage of the basal OCR prior to treatment is shown. Individual data points plotted ± SEM. (n = 6 wells per condition, p value = 0.0008). * p value < 0.05 from post hoc analysis after significant two-way ANOVA.
Fig. 6:
Fig. 6:. The effect of STAT3 on adipocyte oxidative metabolism is non-genomic and non-mitochondrial.
a. Venn diagram showing number of differentially regulated genes in inguinal and epididymal mature adipocytes from WT and SAKO mice after 12-weeks HFD feeding (n = 3 mice per genotype). b.-f. Q-PCR analysis of gene expression in iWAT from WT and SAKO mice after 12-weeks HFD feeding. Individual data points plotted ± SEM (n = 12 mice per genotype, p value < 0.0001). g. Phosphorylating (State 3) respiration rates of oxygen consumption in mitochondria isolated from iWAT in the presence of different substrates. Individual data points plotted ± SEM (n = 8 wells per group). h. State 3 oxygen consumption rate in permeabilized PPDIV in the presence of different substrates. Individual data points plotted ± SEM (n = 8 wells per group). d.-h. No statistically significant results WT vs. SAKO. Experiments in g and h were repeated in 4 independent experiments, all with similar results; no significant difference between WT and SAKO OCR found by two-way ANOVA with post hoc analysis. Electron micrograph of iWAT (i) and eWAT (j), showing mitochondrial structure. This experiment was repeated independently with similar results. Scale bar = 200 nm. * p value < 0.05 versus WT two-sided student’s t-test.
Fig. 7:
Fig. 7:. STAT3 suppresses FA re-esterification in adipocytes.
a. Incorporation of 14C-palmitic acid into triglycerides and phosphatidic acid (p value = 0.018), b. Oxidation of 14C-palmitic acid to form acid metabolites (ACM) and CO2 by WT and SAKO PPDIV (p values = 0.002 ACM and 0.022 CO2). Individual data points plotted ± SEM (n = 6 per genotype). Data in a. and b. are from the same experiment. c. Dose response of FSG67 impact on maximal OCR in 3T3-L1 adipocytes ± 10 μM CL-316,243 (n = 5 per treatment, p values = 0.016, 0.021 and < 0.0001 at FSG67 = 6.25, 12.5 and ≥ 25 μM respectively) d. Quantification of Bodipy stained area at 5 h relative to basal. BSA and etomoxir pretreated for 15 min (n = 20 cells per condition, p values < 0.0001). e. Representative micrographs (confocal, collapsed z-stack) of bodipy staining in WT and SAKO PPDIVs ± 2% BSA/1 μM CL-316,243. Lower-left panel: Quantification of Bodipy stained area at 18 h relative to basal. Individual data points plotted ± SEM (n = 12 vehicle and 16 CL cells per genotype, p value = 0.001 WT V vs. CL and 0.002 WT vs. SAKO CL). f. Triglyceride content in WT and SAKO PPDIVs after 24 h ± 2% BSA/1 μM CL-316,243, percent vehicle. Individual data points plotted ± SEM (n = 3 +BSA, 6 -BSA wells per genotype, p value = 0.046 V vs. CL WT, 0.035 WT vs. SAKO CL, 0.018 BSA vs. BSA-CL WT, 0.002 BSA vs. BSA-CL SAKO). g. WT and SAKO PPDIV OCR at 30 min ± 100 μM FSG67/1 μM CL-316,243. Individual data points plotted ± SEM (n = 6 per treatment, p value = 0.0002). h. and i. GPAT activity assay in homogenates from WT and SAKO PPDIV. Individual data points plotted ± SEM h. (n = 5 WT and 6 SAKO, p value = 0.042). i. NEM preincubation for 15 min. Data are represented as mean ± SEM (n = 3 per genotype, p values = 0.0002). * p value < 0.05 post hoc analysis after significant two-way ANOVA.
Fig. 8:
Fig. 8:. Regulation of FA disposition by STAT3.
a. Incorporation of 14C-palmitic acid into triglycerides by SAKO PPDIV relative to WT control cells ± 1 μM CL-316,243. Individual data points plotted ± SEM (n = 3 wells per condition, p values = 0.0008). b. GPAT activity in iWAT homogenates from WT and SAKO mice treated with 1 mg/kg CL-316,243 or vehicle control for 20 minutes. Individual data points plotted ± SEM (n = 3 mice per condition, p value =0.002 WT V vs. CL, 0.019 WT vs. SAKO CL). c. Western blot analysis of GPAT3 and GPAT4 protein levels in lysates from WT and SAKO iWAT and eWAT. Results are representative of three independent experiments, 50, 75 and 100 kDa protein markers indicated in green, pink and blue respectively. d. OCR at 30 min ± 10 μM CL-316,243 in 3T3-L1 adipocytes ± JAK inhibitor I pretreatment for 30 min, normalized to baseline. Individual data points plotted ± SEM (n = 8 wells per condition, p values < 0.0001). e. and f. OCR at 30 min ± 0.5 μM CL-316,243 in WT and SAKO PPDIV with lentiviral STAT3 (WT, S727A or S727D) or GFP overexpression. e. Data are represented as mean ± SEM (n = 12 wells per over expression construct in each genotype, p value < 0.0001 V vs. CL, 0.002 WT CL vs. SAKO CL GFP, and 0.046 WT CL vs. SAKO CL S727A ). f. Individual data points plotted ± SEM (n = 4 wells per condition, p value = 0.029 V vs. CL STAT3, 0.016 V vs. CL 727D, 0.047 GFP vs. STAT3 CL, 0.011 727A vs. STAT3 CL, and 0.024 727A vs. 727D CL). g. Model of FA handling in the fed state (blue arrows) versus the fasted stated (red arrows) and the signaling regulating lipolysis-driven oxidative metabolism (black arrows) in the fasted state. * p value < 0.05 from post hoc analysis after significant two-way ANOVA.

References

    1. James PT, Leach R, Kalamara E & Shayeghi M The worldwide obesity epidemic. Obes Res 9 Suppl 4, 228S–233S, doi: 10.1038/oby.2001.123 (2001). - DOI - PubMed
    1. Obesity: preventing and managing the global epidemic. Report of a WHO consultation. World Health Organ Tech Rep Ser 894, i–xii, 1–253 (2000). - PubMed
    1. Swinburn BA et al. The global obesity pandemic: shaped by global drivers and local environments. Lancet 378, 804–814, doi: 10.1016/S0140-6736(11)60813-1 (2011). - DOI - PubMed
    1. Kennedy EP Biosynthesis of complex lipids. Fed Proc 20, 934–940 (1961). - PubMed
    1. Weiss SB, Kennedy EP & Kiyasu JY The enzymatic synthesis of triglycerides. J Biol Chem 235, 40–44 (1960). - PubMed

Publication types