. 2020 Jul;2(7):603-611.
doi: 10.1038/s42255-020-0224-7. Epub 2020 Jul 6.

Selenium detoxification is required for cancer-cell survival

Affiliations

Selenium detoxification is required for cancer-cell survival

Anne E Carlisle et al. Nat Metab. 2020 Jul.

Abstract

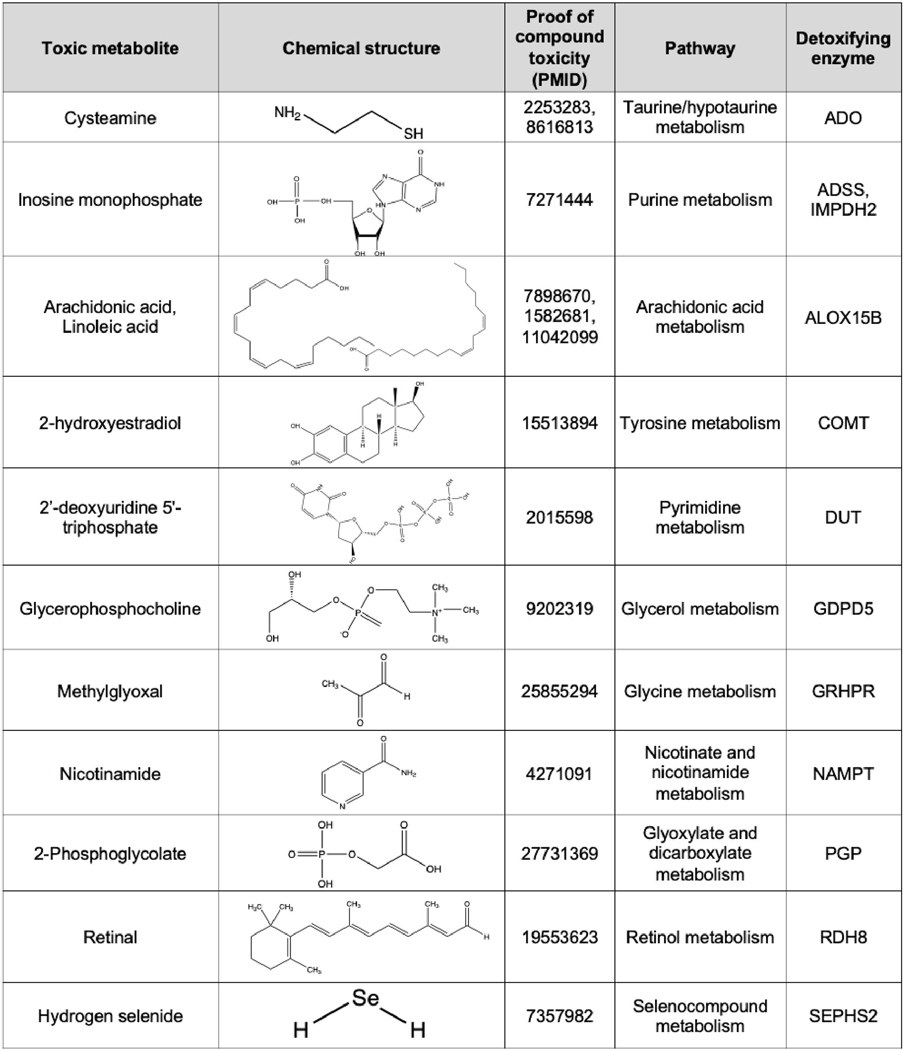
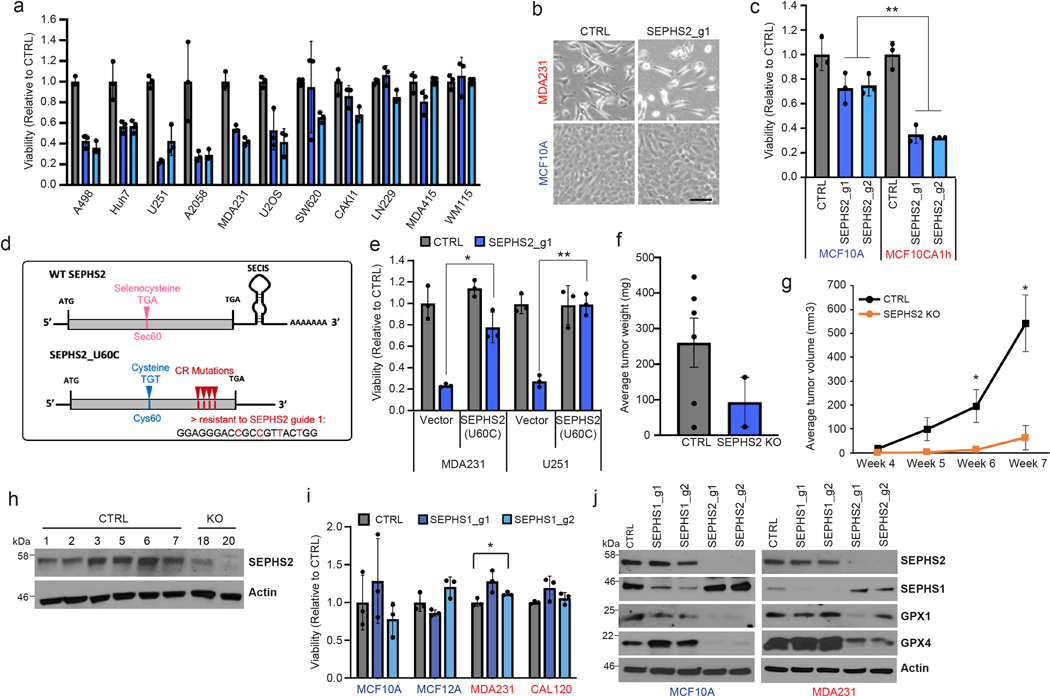
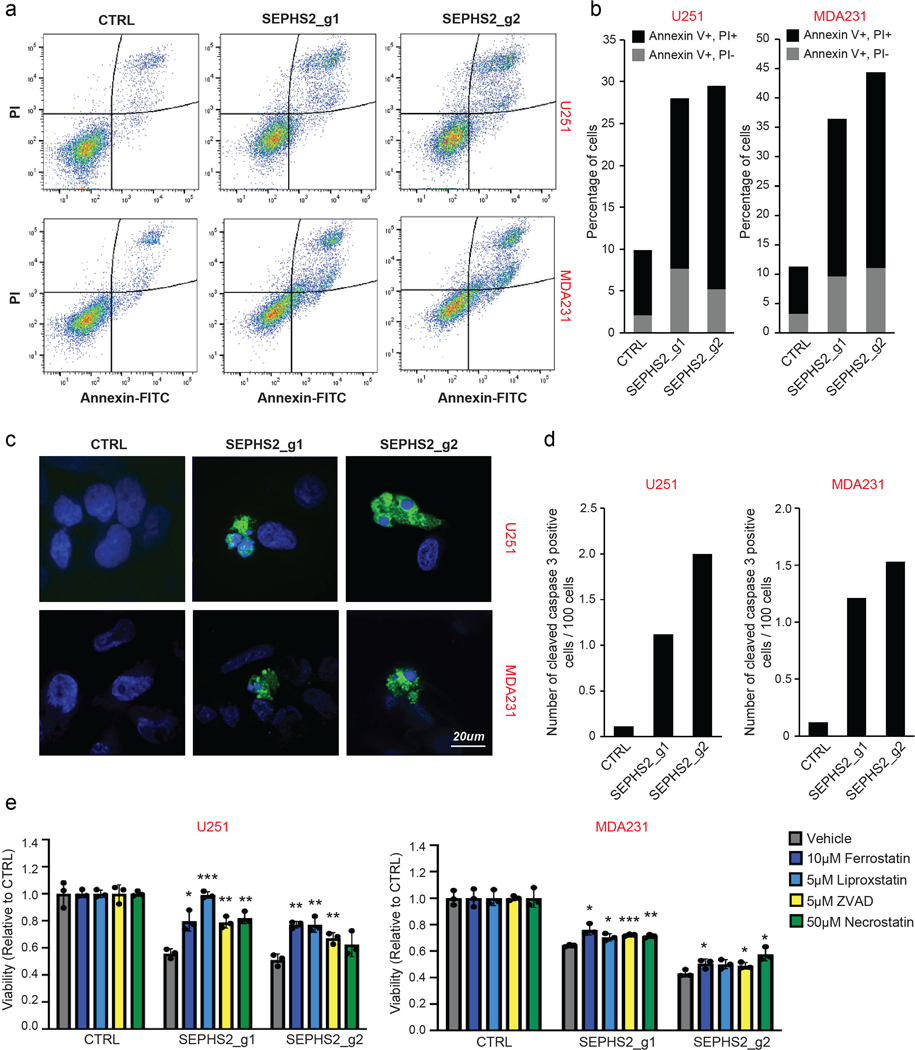
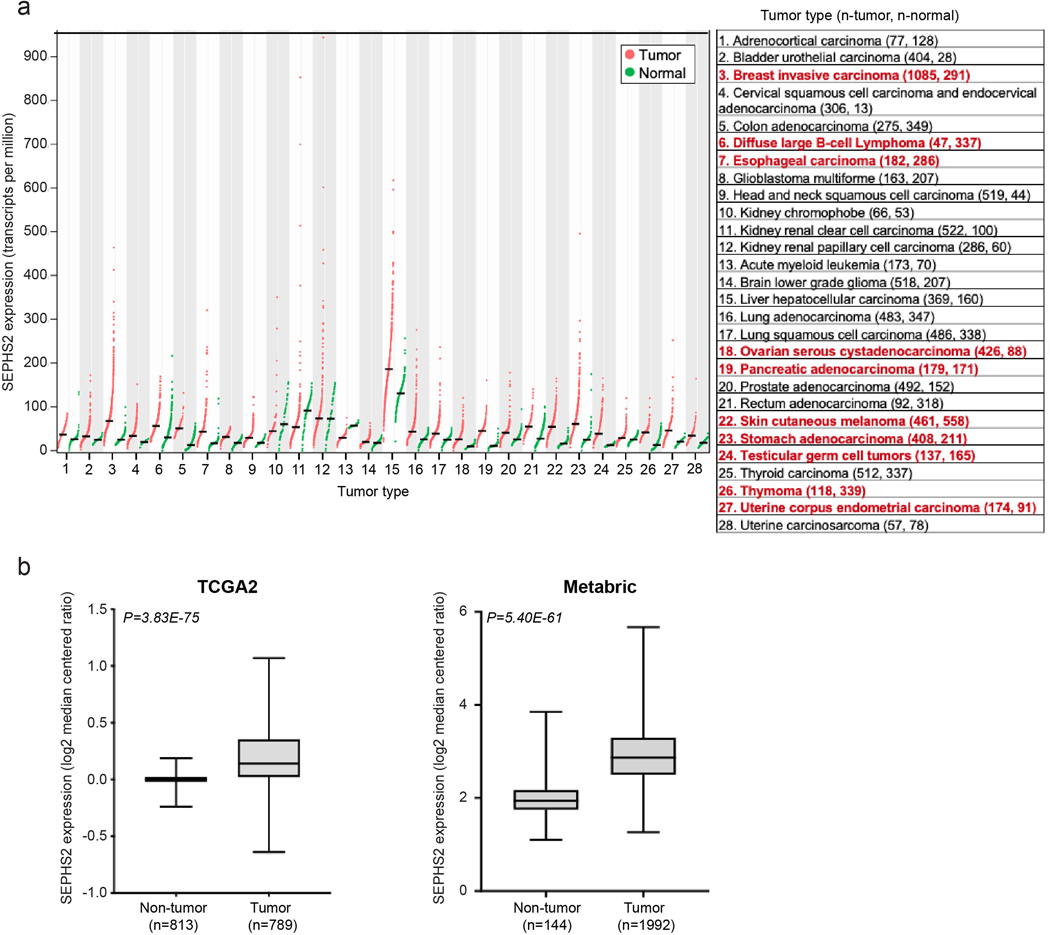
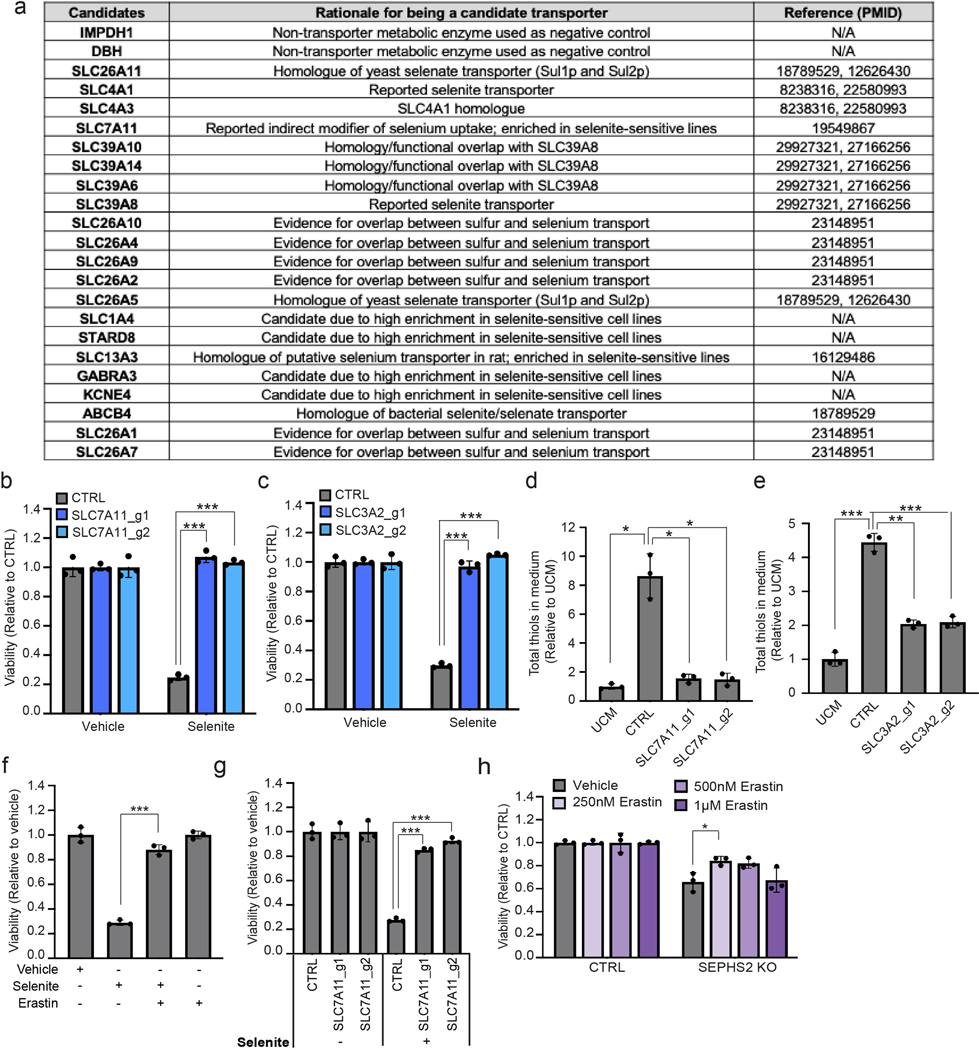
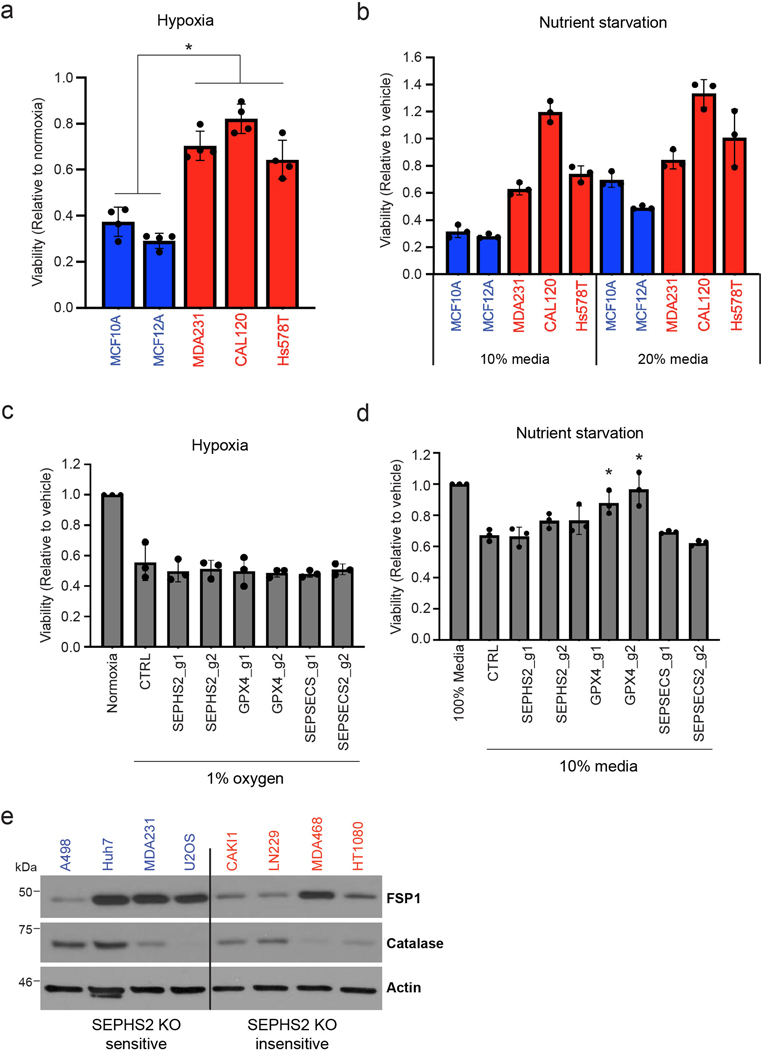
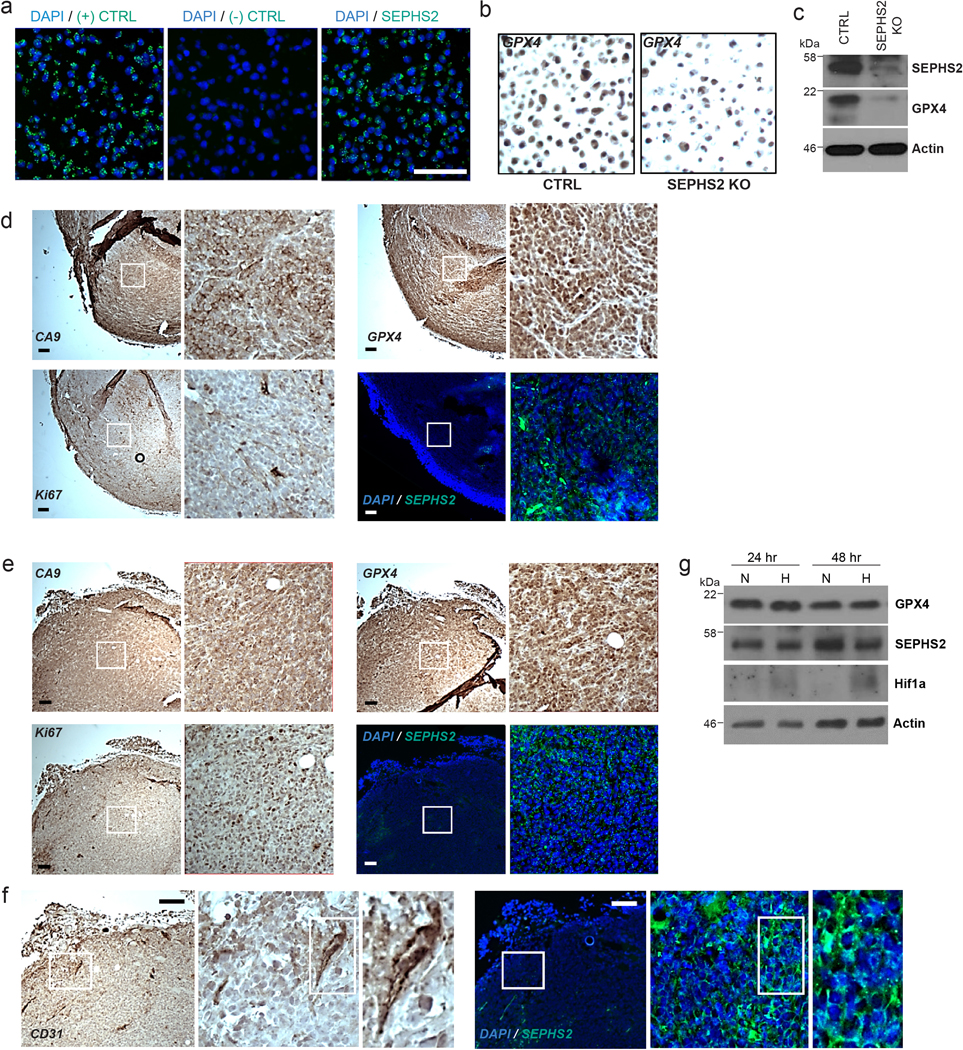
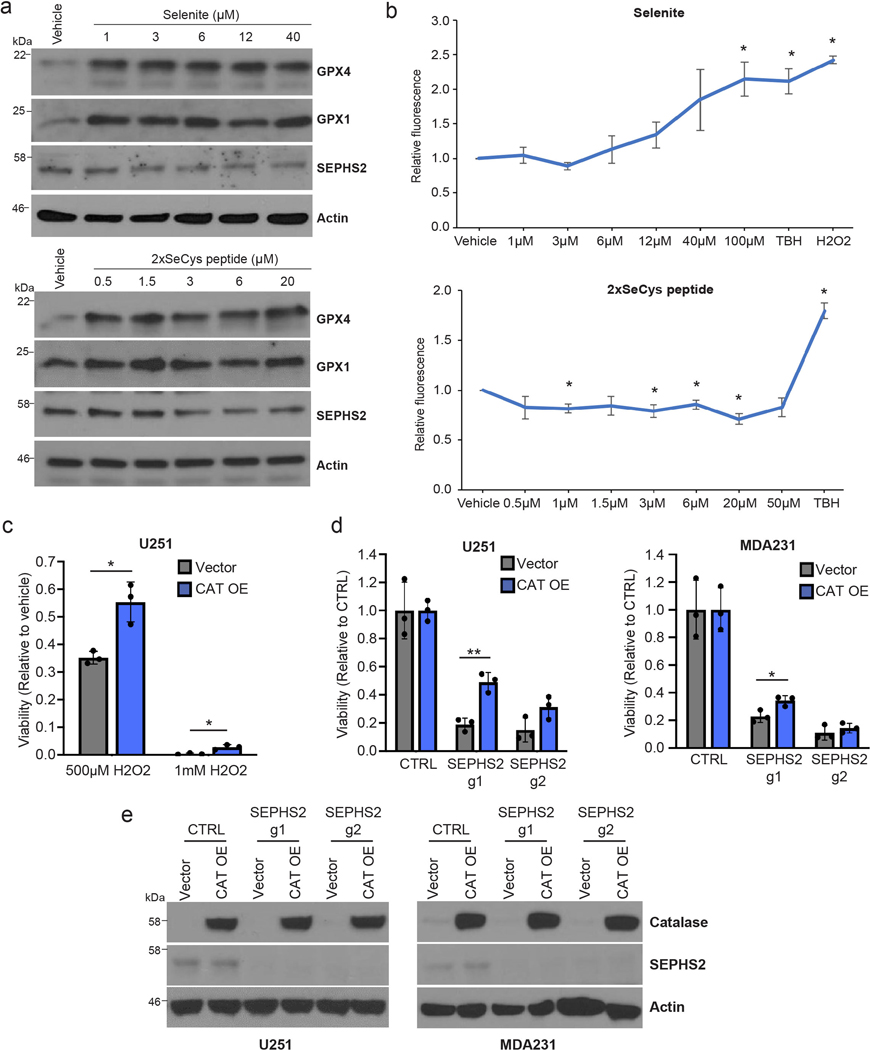
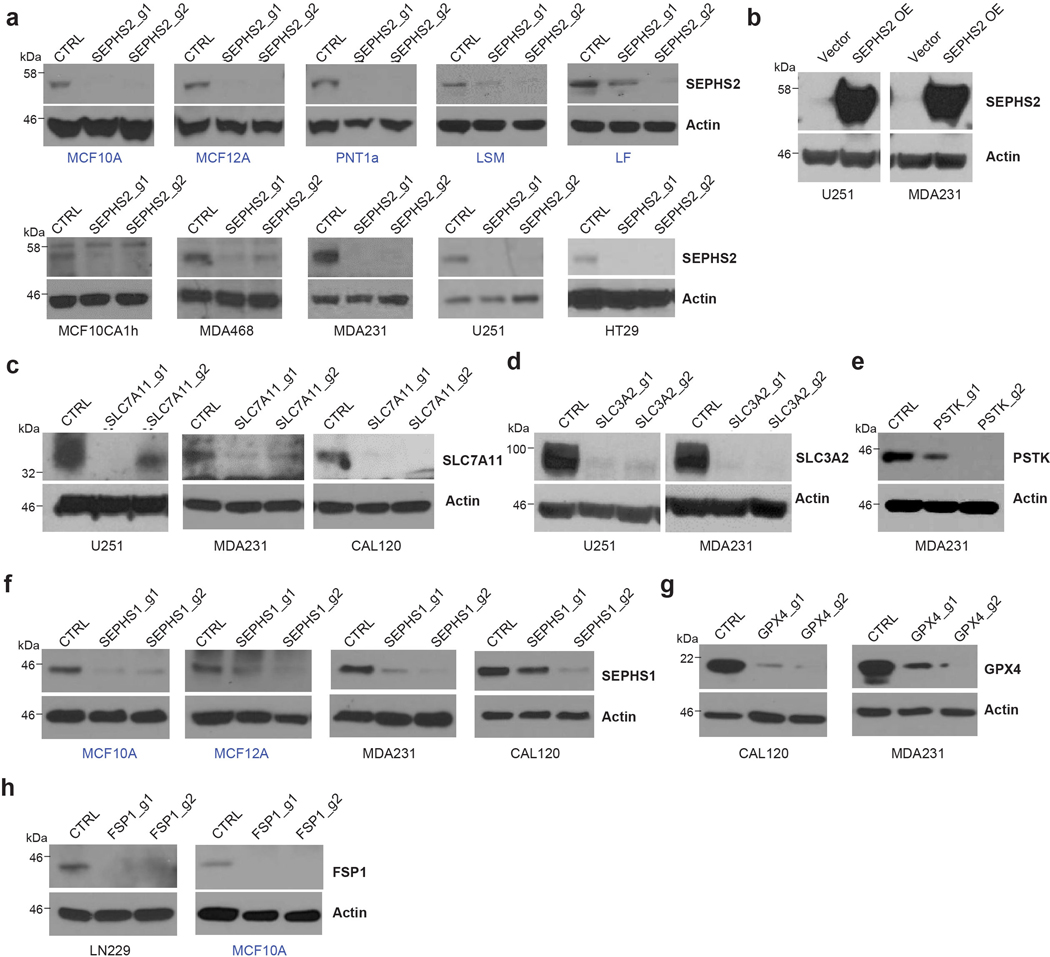
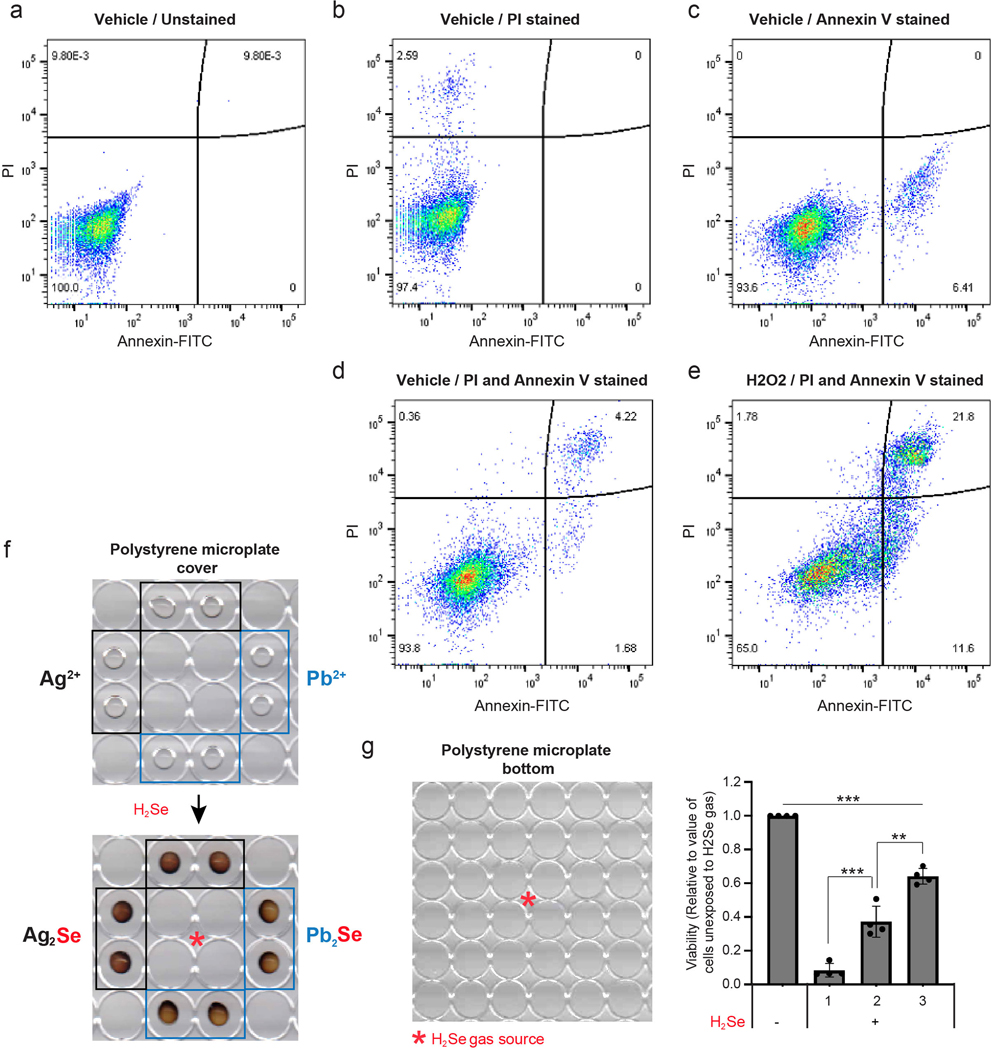
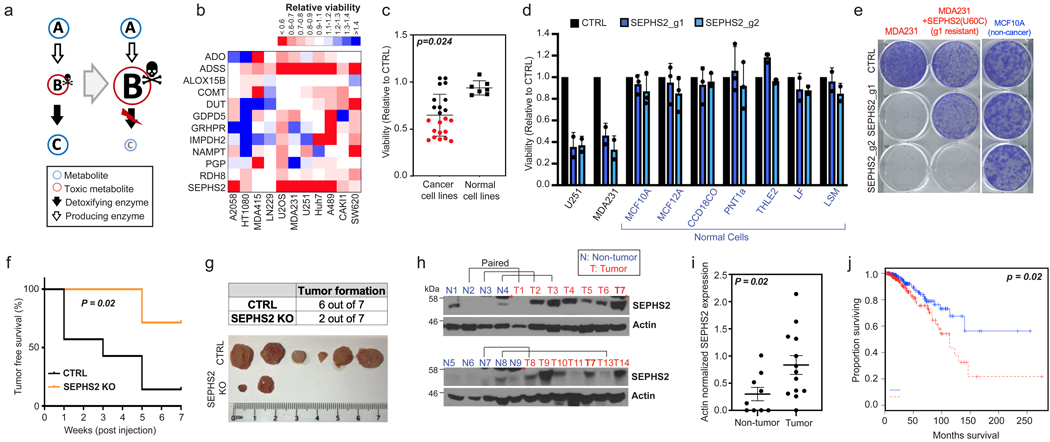
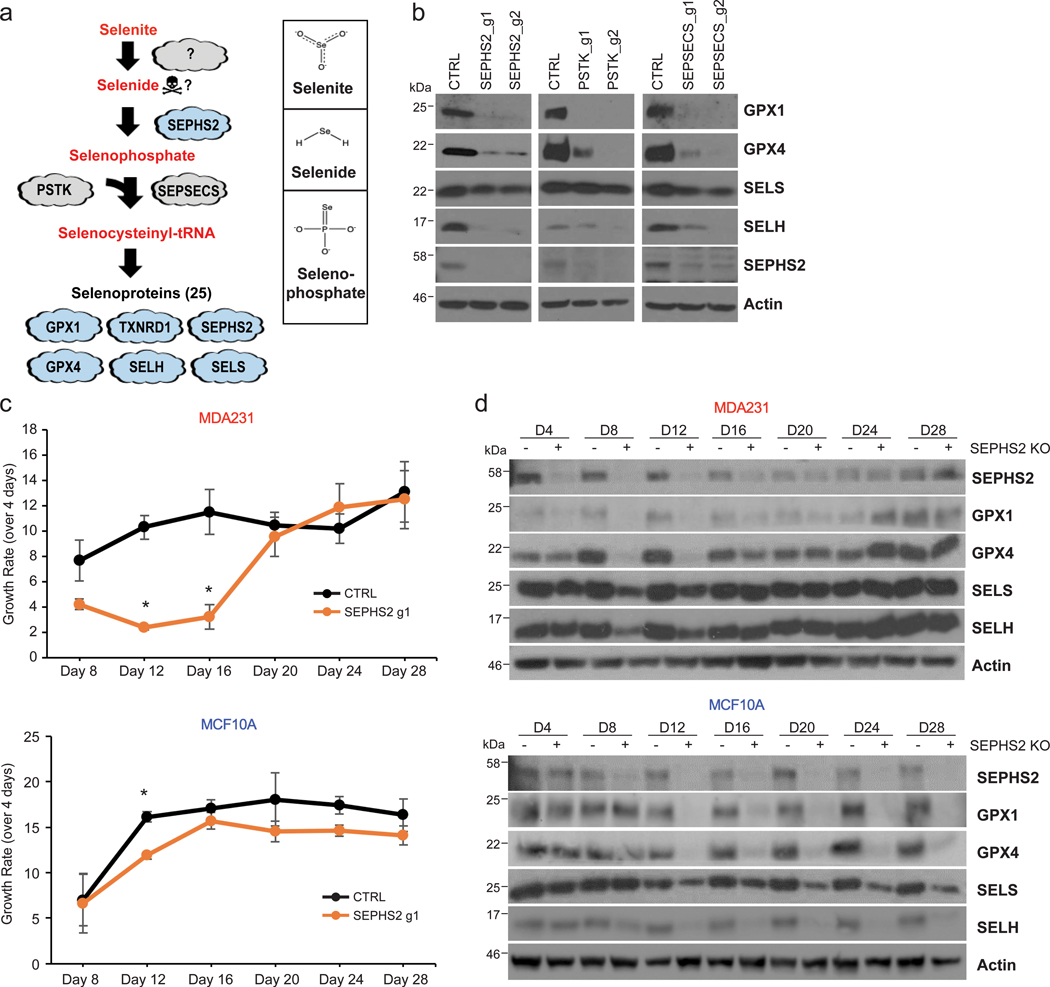
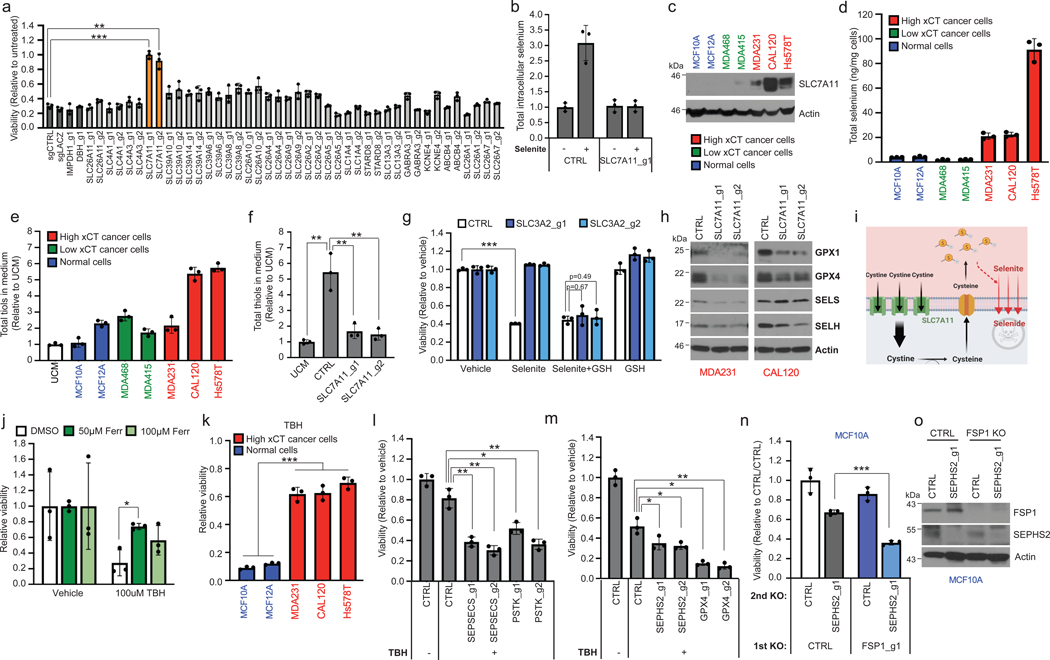
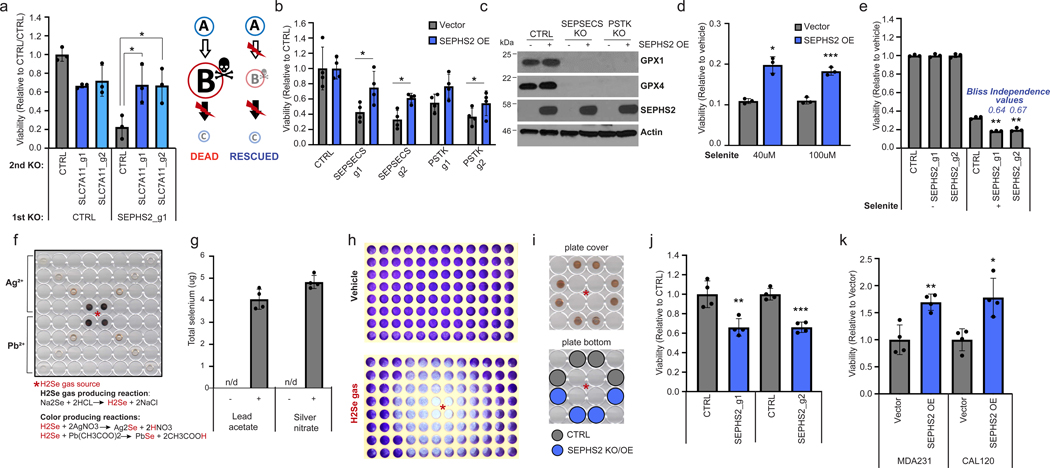
The micronutrient selenium is incorporated via the selenocysteine biosynthesis pathway into the rare amino acid selenocysteine, which is required in selenoproteins such as glutathione peroxidases and thioredoxin reductases1,2. Here, we show that selenophosphate synthetase 2 (SEPHS2), an enzyme in the selenocysteine biosynthesis pathway, is essential for survival of cancer, but not normal, cells. SEPHS2 is required in cancer cells to detoxify selenide, an intermediate that is formed during selenocysteine biosynthesis. Breast and other cancer cells are selenophilic, owing to a secondary function of the cystine/glutamate antiporter SLC7A11 that promotes selenium uptake and selenocysteine biosynthesis, which, by allowing production of selenoproteins such as GPX4, protects cells against ferroptosis. However, this activity also becomes a liability for cancer cells because selenide is poisonous and must be processed by SEPHS2. Accordingly, we find that SEPHS2 protein levels are elevated in samples from people with breast cancer, and that loss of SEPHS2 impairs growth of orthotopic mammary-tumour xenografts in mice. Collectively, our results identify a vulnerability of cancer cells and define the role of selenium metabolism in cancer.


Figures

Extended Data Figure 1.
Extended Data Figure 1.. Panel of toxic metabolites and putative detoxifying enzymes tested.
A panel of metabolites that have documented toxic properties, and the downstream enzymes which use them as substrates, designated as ‘detoxifiers’, are listed. Chemical structures and PMID of references which document the toxicity of each metabolite as a compound are shown.
Extended Data Figure 2.
Extended Data Figure 2.. Further details of effects of SEPHS2 KO and overexpression in cells and in the MDA231 orthotopic xenograft.
(a) Viability of cell lines following KO with guides against SEPHS2 for 9 days. Values are relative to the same cell lines expressing nontargeting (CTRL) guide (=1.0), (b) Light microscope images of MDAMB231 and MCF10A cells subjected to CTRL or SEPSECS KO. Scale bar=25μm. (c) Viability of cell lines following KO with guides against SEPHS2 for 11 days. Values are relative to the same cell lines expressing nontargeting guide (=1.0). (d) Map of wild type SEPHS2 and CRISPR resistant mutant SEPHS2_U60C. Details of features are provided in Methods. (e) Viability of vector and SEPHS2_U60C overexpressing cell lines subjected to CTRL and SEPHS2 g1 KO. (f) Weight measurements for ex vivo CTRL and SEPHS2 KO MDAMB231 orthotopic xenograft tumors. (g) In vivo tumor volume measurements for CTRL and SEPHS2 KO MDAMB231 orthotopic xenograft tumors. For f and g, if no tumor has formed, tumor weight and volume was designated 0 for CTRL, n=6 and for SEPHS2 KO n=2. (h) Immunoblot of SEPHS2 in CTRL and SEPHS2 KO MDAMB231 orthotopic xenograft tumors. Number is an animal identifier number. For a,c,e, n=3 biological replicates; error bars are S.D. Number is an animal identifier number. (i) Viabilities of noncancer (immortalized) and cancer lines following KO with guides against SEPHS1 (blue bars) for 9 days. Values are relative to the same cell lines expressing nontargeting guide (black bars), set at 1.0. (j) Immunoblots of selenoprotein expression in MCF10A and MDAMB231 cells subjected to (CRISPR/Cas9-induced) KO with guides against SEPHS1, SEPHS2, or control guides for 11 days. For a,c,e and i, n=3 biological replicates; error bars are S.D. For all panels, the measure of center is mean. *p>0.05, **p<0.01 (student’s two-tailed t test).
Extended Data Figure 3.
Extended Data Figure 3.. Induction of cell death by SEPHS2 KO in cancer cells.
(a) Raw flow cytometry of PI and Annexin V double-stained U251 and MDAMB231 cells following KO with guides against SEPHS2 at 10 days after viral infection. Gating strategy is outlined in Extended Data Figure 10a-e (b) Percentages of Annexin V+/PI- and Annexin V+/PI+ cells. (c) Cleaved caspase 3 (CC3) staining in MDAMB231 and U251cells following KO with guides against SEPHS2 at 10 days after viral transduction. Scale bar=20μm. (d) Quantification of CC3 positive cells over total cells in CTRL and SEPHS2 deficient MDAMB231 and U251. Counts are from random fields. (e) Viability of control and SEPHS2 deficient U251 and MDAMB231 cells treated with vehicle or the indicated drugs for 4 days. Values are relative to the cell lines expressing nontargeting (CTRL) guide, set at 1.0. For e, n=3 biological replicates; error bars are S.D. For all panels, the measure of center is mean. For all panels, *p<0.05, **p<0.01, and ***p<0.001 (student’s two-tailed t test).
Extended Data Figure 4.
Extended Data Figure 4.. Expression of SEPHS2 in various types of tumor and normal tissues.
(a) Expression profiles of SEPHS2 in 28 types of normal and tumor tissues. Normalized mRNA-Seq expression profile data from patient tumor tissues and normal tissues was obtained from GEPIA (Tang, Z. et al. (2017) GEPIA: a web server for cancer and normal gene expression profiling and interactive analyses. Nucleic Acids Res, 10.1093/nar/gkx247). Tumor subtypes having over 2-fold SEPHS2 expression in tumor than normal and q-value less than 0.01 indicated with red. q values are have been determined by ANOVA and adjusted for FDR (false discovery rate). (b and c) Box plots of SEPHS2 mRNA expression levels in patient tumors and normal breast tissue. SEPHS2 expression was compared in tumor and normal breast samples from TCGA (b) and METABRIC (c) datasets. For panel b, minimum is non-tumor (−0.239), tumor (−0.6386), maximum is non-tumor (0.1874), tumor (1.0702) and median is non-tumor (0.0014), tumor (0.1402). For panel c, minimum is non-tumor (1.10097), tumor (1.26305), maximum is non-tumor (3.85158), tumor (5.67272), and median is non-tumor (1.941515), tumor (2.86621).
Extended Data Figure 5.
Extended Data Figure 5.. Candidate transporters tested and xCT functional characterization.
(a) A list of selenium transporter candidates examined in the focused screen, rationale for candidacy, and references. (b) Viability of control and SLC7A11 KO U251 cells treated with 12 μM of sodium selenite for 48 hr. Values are relative to that of the same cells treated with vehicle (=1.0). (c) Viability of control and SLC3A2 KO U251 cells treated with 12 μM of sodium selenite for 48 hr. Values are relative to that of the same cells treated with vehicle (=1.0). (d) Total thiol quantification of 24 hr conditioned media from control and SLC7A11 KO U251 cells. (e) Total thiol quantification of 24 hr conditioned media from control and SLC3A2 KO U251 cells. Each value was normalized to that of unconditioned medium. (f) Viability of U251 cells treated with vehicle, 12 μM sodium selenite, and/or 10 μM Erastin for 72 hr. Values are relative to the cells treated with vehicle (=1.0). (g) Viability of control and SLC7A11 KO U251 cells treated with vehicle or 12 μM sodium selenite for 72 hr. Values are relative to the control cells treated with vehicle (=1.0). (h) Viability of control and SEPHS2 KO CAL120 cells treated with vehicle or indicated doses of Erastin for 4 days. Values are relative to each untreated cells (=1.0). For b-h, n=3 biological replicates; error bars are S.D. For all panels, the measure of center is mean. For all panels, *p<0.05, **p<0.01, and ***p<0.001 (student’s two-tailed t test).
Extended Data Figure 6.
Extended Data Figure 6.. Effects of hypoxia or nutrient-starved stresses on normal and selenophilic cancer cells.
(a) Viability of non-transformed (blue bars) and selenophilic cancer (red bars) cells under hypoxia (1% O2) for 48hr. Values are relative to cells cultured under normoxic condition (20% O2), set at 1.0. (b) Viability of non-transformed (blue bars) and selenophilic cancer (red bars) cells under nutrient starved conditions (10% or 20% growth media) for 48hr. Values are relative to cells cultured in 100% growth media, set at 1.0. (c) Viability of control, SEPHS2, GPX4, and SEPSECS deficient MDAMB231 cells after being cultured in hypoxic condition (1% O2) for 48hr. Values are relative to the cells cultured in normoxic condition (20% O2), set at 1.0. (d) Viability of control, SEPHS2, GPX4, and SEPSECS deficient MDAMB231 cells under nutrient starved conditions (10% growth media) for 48hr. Values are relative to the cells cultured in 100% growth media, set at 1.0. (e) Immunoblot of FPS1 and catalase in SEPHS2 KO sensitive and in sensitive cell lines. For a,b, n=3 biological replicates; error bars are S.D. For c,d n=3 independent experiments; error bars are S.D. For b, while trends can be seen, statistical comparisons were not carried out due to variability between cell lines. For all panels, the measure of center is mean. For all panels, *p<0.05 (student’s two-tailed t test).
Extended Data Figure 7.
Extended Data Figure 7.. SEPHS2 and GPX4 expression in tumor microenvironments.
(a) Validation of SEPHS2 RNA probe by RNAscope in situ hybridization in MDA231 cell pellet block samples. Scale bar=100μm. (b) Validation of specificity of GPX4 antibody in CTRL and SEPHS2 KO MDAMB231 cell pellet block by immunohistochemistry. (c) SEPHS2 immunoblots from the cells used in b. (d and e) Micrographs of serial xenograft tumor sections stained with CA9, GPX4, KI67 antibodies and in situ hybridized with SEPHS2 RNA probe. The right hand panels are magnifications of the regions outlined by the white square. (d) shows a hypoxic region as indicated by membrane staining of CA9, and with a low Ki67 index. (e) shows a nonhypoxic region (as indicated by only background nonspecific stain in CA9) with a high Ki67 index. Scale bar is 100μm. (f) Micrographs of serial human tumor sections stained with CD31 antibody and in situ hybridized with SEPHS2 RNA probe, showing vasculature. Scale bar is 100μm. (g) Immunoblots of GPX4, SEPHS2 and Hif1a in MDAMB231 cells subjected to hypoxia (1% O2) for 48hrs.
Extended Data Figure 8.
Extended Data Figure 8.. Reactive oxygen species production by excess selenium, and implications in SEPHS2 KO toxicity.
(a) Selenoprotein immunoblots of MDAMB231 cells at 24hr recovery after 2 hr sodium selenite treatment or treated with 2-selenocysteine-containing peptide for 24hr. (b) ROS quantification of cells treated with indicated concentrations of sodium selenite or 2xselenocysteine containing peptide, 250 μM TBH, or 500μM H2O2 for 45 mins. (c) Viability of U251 cells overexpressing vector or CAT treated with vehicle or H2O2 for 48 hr. (d)Viability of U251, and MDAMB231 cells overexpressing blank vector or CAT and subjected to KO with guides against SEPHS2 for 9 days. (e) Immunoblots of CAT and SEPHS2 in U251 and MDAMB231 cells overexpressing blank vector or CAT and subjected to KO with guides against SEPHS2 for 9 days. For b, n=3 independent experiments; error bars are S.D. For c,d n=3 biological replicates; error bars are S.D. For all panels, the measure of center is mean. For all panels, *p<0.05 and **p<0.01 (student’s two-tailed t test).
Extended Data Figure 9.
Extended Data Figure 9.. Confirmation of gene knockout or overexpression after lentiviral transduction.
(a) Immunoblots of SEPHS2 in 5 non-transformed (blue) and 5 transformed (black) cell lines transduced with Cas9/sgRNAs against SEPHS2, and control (non-targeting sgRNA). (b) Immunoblots of SEPHS2 in cells transduced with CRISPR resistant SEPHS2_U60C and control (empty vector). (c) Immunoblots of SLC7A11 in cells transduced with Cas9/sgRNAs targeting SLC7A11 or non-targeting sgRNA. (d) Immunoblots of SLC3A2 in cells transduced as indicated (e) Immunoblots of PSTK in cells transduced as indicated. (f) Immunoblots of SEPHS1 in 2 non-transformed and 2 cancer cells transduced as indicated. (g) Immunoblots of GPX4 in cells transduced as indicated. (h) Immunoblots of FSP1 in cancer cells transduced as indicated. All samples were lysed between 7~8 days after viral transduction.
Extended Data Figure 10.
Extended Data Figure 10.. Supporting data for flow cytometry and gas toxicity system.
(a-e) Representative flow cytometry data to address gating and quadrant strategy for FACS measurement of dying/dead cells. MDAMB231 cells were stained with Annexin V-FITC and propidium iodide (PI). The X-axis and y-axis of Flow cytometry density plots were designated as Annexin V-FITC and PI, respectively. The left lower quadrant represents Annexin V negative and PI negative live cells. The right lower quadrant represents Annexin V positive and PI negative early dying cells. The right upper quadrant represents Annexin V positive and PI positive late dying/dead cells. Staining is as follows: (a) unlabeled, (b) PI, (c) Annexin V, (d) Annexin V and PI, (e) Annexin V and PI stained cells treated with 50 μM H2O2 for 24hr. (f) Scanned image of a polystyrene microplate cover with PVP spots embedded with silver nitrate or lead acetate. The plate cover was scanned before (upper panel) and after (lower panel) selenide gas exposure for one min. (g) Viability of MDAMB231 cells in the numbered spots outlined on the 96 well plate, exposed to selenide gas. For g, n=4 independent experiments; values are normalized to untreated cells (=1.0). For all panels, the measure of center is mean. For all panels **p<0.01, and ***p<0.001 (student’s two-tailed t test).
Figure 1.
Figure 1.. Identification of SEPHS2 as an enzyme that is selectively essential to cancer cells and is a potential therapeutic target.
(a) Toxic metabolite poisoning strategy. If B is a toxic metabolite, and the downstream (detoxifying) enzyme is disrupted, toxic accumulation of B rather than the loss of C may cause toxicity. (b) Heat map representing the impact of KO of each putative detoxifying enzyme (rows) on viability (measured as described in methods) of different cancer lines (columns). Values are relative to the same cells expressing nontargeting guide (= 1.0); red indicates a decrease and blue indicates an increase in viability. Detoxifying enzyme information is in Extended Data Figure 1. (c) Dot plot of effect of SEPHS2 KO on viability of 22 cancer cell lines and 7 noncancer (nontransformed and primary) cell lines of varying tissue origin, each dot representing one cell line. Values are relative to the same cells expressing nontargeting guide (= 1.0). Detailed information on cell lines and viability data for b and c are shown in Table S2. (d) Viabilities of noncancer lines following KO with guides against SEPHS2 (blue bars) for 9 days. Values are relative to the same cell lines expressing nontargeting guide (black bars) (=1.0). SEPHS2 KO efficiency for each line is shown in Extended Data Figure 9. (e) Crystal violet staining showing colony forming ability of MDAMB231 cells, MDAMB231 cells overexpressing guide1-resistant SEPHS2_U60C, and MCF10A cells, following SEPHS2 KO via guide 1 and guide 2. (f) Kaplan-Meier plot of tumor-free survival for mice orthotopically injected with SEPHS2 KO or CTRL KO MDAMB231 cells. n=7 mice for each condition. (g) Tumor formation data and ex vivo images of the tumors at endpoint. (h) SEPHS2 immunoblots from patient breast cancer tissue and normal breast tissues. Paired samples from the same patient are indicated. Red asterisk indicates a nonspecific band present in mammary tissue. (i) Quantification of SEPHS2 protein band intensities from h, normalized to that of actin; each dot represents one sample from h. (j) Overall survival estimates of human breast carcinoma patients from TCGA database based on SEPHS2 expression, SEPHS2 Low n=180 and SEPHS2 High n=191. For d, each point is an average from biological triplicates from an independent set; For c,d,i,; error bars are S.E. p values are calculated using student’s two-tailed t test.
Figure 2.
Figure 2.. SEPHS2 is dispensable to nontransformed cells despite being required to produce selenoproteins.
(a) Diagram of selenocysteine biosynthesis pathway and chemical structure of selenite, selenide and selenophosphate. (b) Immunoblots of selenoprotein expression in MDAMB231 cells subjected to (CRISPR/Cas9-induced) KO with guides against the selenocysteine biosynthesis pathway enzymes SEPHS2, PSTK, SEPSECS, or control guides for 11 days. (c) Long-term monitoring of growth rates of MDAMB231 cells and MCF10A cells subjected to (CRISPR/Cas9-induced) KO with guides against SEPHS2 or CTRL, over the course of 28 days. Each point represents the fold change of growth over the previous 4 days. (d) Immunoblots of selenoproteins of MDAMB231 and MCF10A cells taken at each timepoint from Figure 2c. For c, n=3 biological replicates; error bars are S.E. For all panels, *p<0.05 (student’s two tailed t test).
Figure 3.
Figure 3.. SLC7A11-mediated reduction of selenite is the initial step of the selenocysteine biosynthesis pathway in cancer cells, and protects against ferroptosis.
(a) Viability of U251 cells subjected to KO with guides against various control genes (dark gray bars) or against candidate selenium transporters, then 48h treatment with 12 μM sodium selenite. Values are relative to the same KO cells treated with vehicle (=1.0). (b) Selenium uptake in U251 cells either with or without SLC7A11 depletion. Total intracellular selenium was quantified following 12 μM selenite supplementation of for 2 hr in U251 cells. Values are relative to CTRL treated with vehicle (=1.0). (c) Immunoblots of SLC7A11 in a panel of breast cancer and normal breast lines. Non-cancer lines are in blue, low SLC7A11 expressing cancer lines are in green, and high SLC7A11 expressing cancer lines in red here and in subsequent histograms. (d) Selenium uptake in the same panel of lines. Total intracellular selenium levels were measured following treatment with 12 μM selenite for 2 hr. (e) Total thiol quantification of 24hr conditioned media from the panel. Each value was normalized to that of unconditioned media (UCM) for every thiol quantification assay. (f) Viability of control and SLC3A2 KO MDAMB231 cells treated with vehicle, 12 μM sodium selenite, and/or 75 μM reduced L-glutathione for 72 hr. Values are relative to the same cells treated with vehicle (=1.0). (g) Total thiol quantification of 24 hr conditioned media from CTRL KO and SLC7A11 KO MDAMB231 cells. (h) Immunoblots of selenoproteins in triple negative breast cancer cells subjected to KO with guides against SLC7A11 for 11 days. (i) Graphical summary of Figure 3. (j) Viability of MDA231 cells pretreated with ferrostatin for 3 hr and then treated with vehicle or 100μM TBH for 48 hr. Values are relative to the same cells treated with vehicle (=1.0). (k) Viability of selenophilic cancer cell lines (red) and nonselenophilic normal lines (blue) treated with 100μM TBH for 24 hr. Values are relative to the same cells treated with vehicle (=1.0). (l) Viability of MDA231 cells subjected to KO with guides against SEPSECS or PSTK for 5 days then treated with vehicle or 50μM TBH for 6 hr. Values are relative to the same cells treated with vehicle (=1.0). (m) Viability of MDA231 cells subjected to KO with guides against SEPHS2 or GPX4 for 5 days and then treated with vehicle or 250μM TBH for 24 hr. Values are relative to the same cells treated with vehicle (=1.0). (n) Viability of MCF10A cells subjected to sequential gene KO as shown. Values are relative to the cells subjected to CTRL KO then subjected to CTRL KO (=1.0). (o) Immunoblots of FSP1 and SEPHS2 from n. FSP1 expression did not significantly differ between SEPHS2 sensitive lines and insensitive lines (Extended Data Figs 6e). For a, d-g and j-n, n=3 biological replicates; for b, n=3 technical replicates; error bars are S.D. For d and e, while trends can be seen, statistical comparisons were not carried out due to variability between cell lines. For all panels, the measure of center is mean. For all panels, *p<0.05, **p<0.01, and ***p<0.001 (student’s two-tailed t test).
Figure 4.
Figure 4.. Essentiality of SEPHS2 in cancer cells is due to its role as a selenide detoxifying enzyme.
(a) Viability of MDAMB231 cells subjected to sequential gene KO as shown, demonstrating that preemptive loss of SLC7A11 renders SEPHS2 dispensable. Values were normalized to the cells subjected to CTRL KO and then subjected to CTRL KO (=1.0). (b) Viability of U251 cells overexpressing blank vector or SEPHS2_U60C and subjected to KO with guides against SEPSECS or PSTK for 11 days. (c) Immunoblot of selenoproteins in U251 cells overexpressing blank vector or SEPHS2_U60C and subjected to KO with guides against SEPSECS or PSTK for 11 days. (d) Viability of U251 cells overexpressing blank vector or SEPHS2_U60C and treated with sodium selenite for 48 hr. Values are relative to the same cells treated with vehicle (=1.0). (e) Viability of U251 cells subjected to KO with guides against SEPHS2 or CTRL and then treated with 12 μM sodium selenite for 72 hr. (f) Scanned image of the polystyrene microplate cover spotted with silver nitrate or lead acetate embedded PVP, used as a non-contact selenide gas indicator, after selenide gas exposure for one min. (g) Selenium quantification, measured by ICP-MS, of the silver nitrate and lead acetate embedded PVP spots demonstrating the capture of volatile selenide. 4 spots equidistant from the selenide source were measured. (h) Scanned image of crystal violet staining of remaining MDAMB231 cells following vehicle or selenide gas exposures for 24 hr. For f and h, asterisk indicates the location of selenide gas production. (i) Experimental layout for comparing sensitivity to selenide gas, via equidistant cell plating. Similar browning of silver nitrate/PVP spots indicate similar exposure levels to selenide gas. (j) Viability of SEPHS2 KO or control MDAMB231 cells under selenide gas exposures for 24 hr. Values were normalized to the viability of non-targeting sgRNA transduced cells (=1.0). (k) Cell viability of MDAMB231 cells overexpressing SEPHS_U60C or blank vector which under selenide gas exposure for 48 hr. Values were normalized to the viability of empty vector transduced cells (=1.0). For a,b and d,e n=3 biological replicates, for j,k n = 4 biological replicates, for g, n=4 technical replicates; error bars are S.D. For all panels, the measure of center is mean. For panels a and c-k, *p<0.05, **p<0.01, and ***p<0.001 (student’s two tailed t test). For b, *p<0.05 (student’s two tailed, paired t test).

References

    1. Labunskyy VM, Hatfield DL & Gladyshev VN Selenoproteins: molecular pathways and physiological roles. Physiol Rev 94, 739–777, doi:10.1152/physrev.00039.2013 (2014). - DOI - PMC - PubMed
    1. Burk RF & Hill KE Regulation of Selenium Metabolism and Transport. Annu Rev Nutr 35, 109–134, doi:10.1146/annurev-nutr-071714-034250 (2015). - DOI - PubMed
    1. Hanahan D & Weinberg R. Hallmarks of Cancer: The Next Generation. Cell 144, 646–674, doi:10.1016/j.cell.2011.02.013 (2011). - DOI - PubMed
    1. Amoedo ND, Obre E & Rossignol R. Drug discovery strategies in the field of tumor energy metabolism: Limitations by metabolic flexibility and metabolic resistance to chemotherapy. Biochim Biophys Acta Bioenerg 1858, 674–685, doi:10.1016/j.bbabio.2017.02.005 (2017). - DOI - PubMed
    1. Wexler P. TOXNET: an evolving web resource for toxicology and environmental health information. Toxicology 157, 3–10 (2001). - PubMed

Publication types

MeSH terms