. 2020 Aug;2(8):688-702.
doi: 10.1038/s42255-020-0228-3. Epub 2020 Jul 6.

Eosinophils regulate adipose tissue inflammation and sustain physical and immunological fitness in old age

Affiliations

Eosinophils regulate adipose tissue inflammation and sustain physical and immunological fitness in old age

Daniel Brigger et al. Nat Metab. 2020 Aug.

Abstract

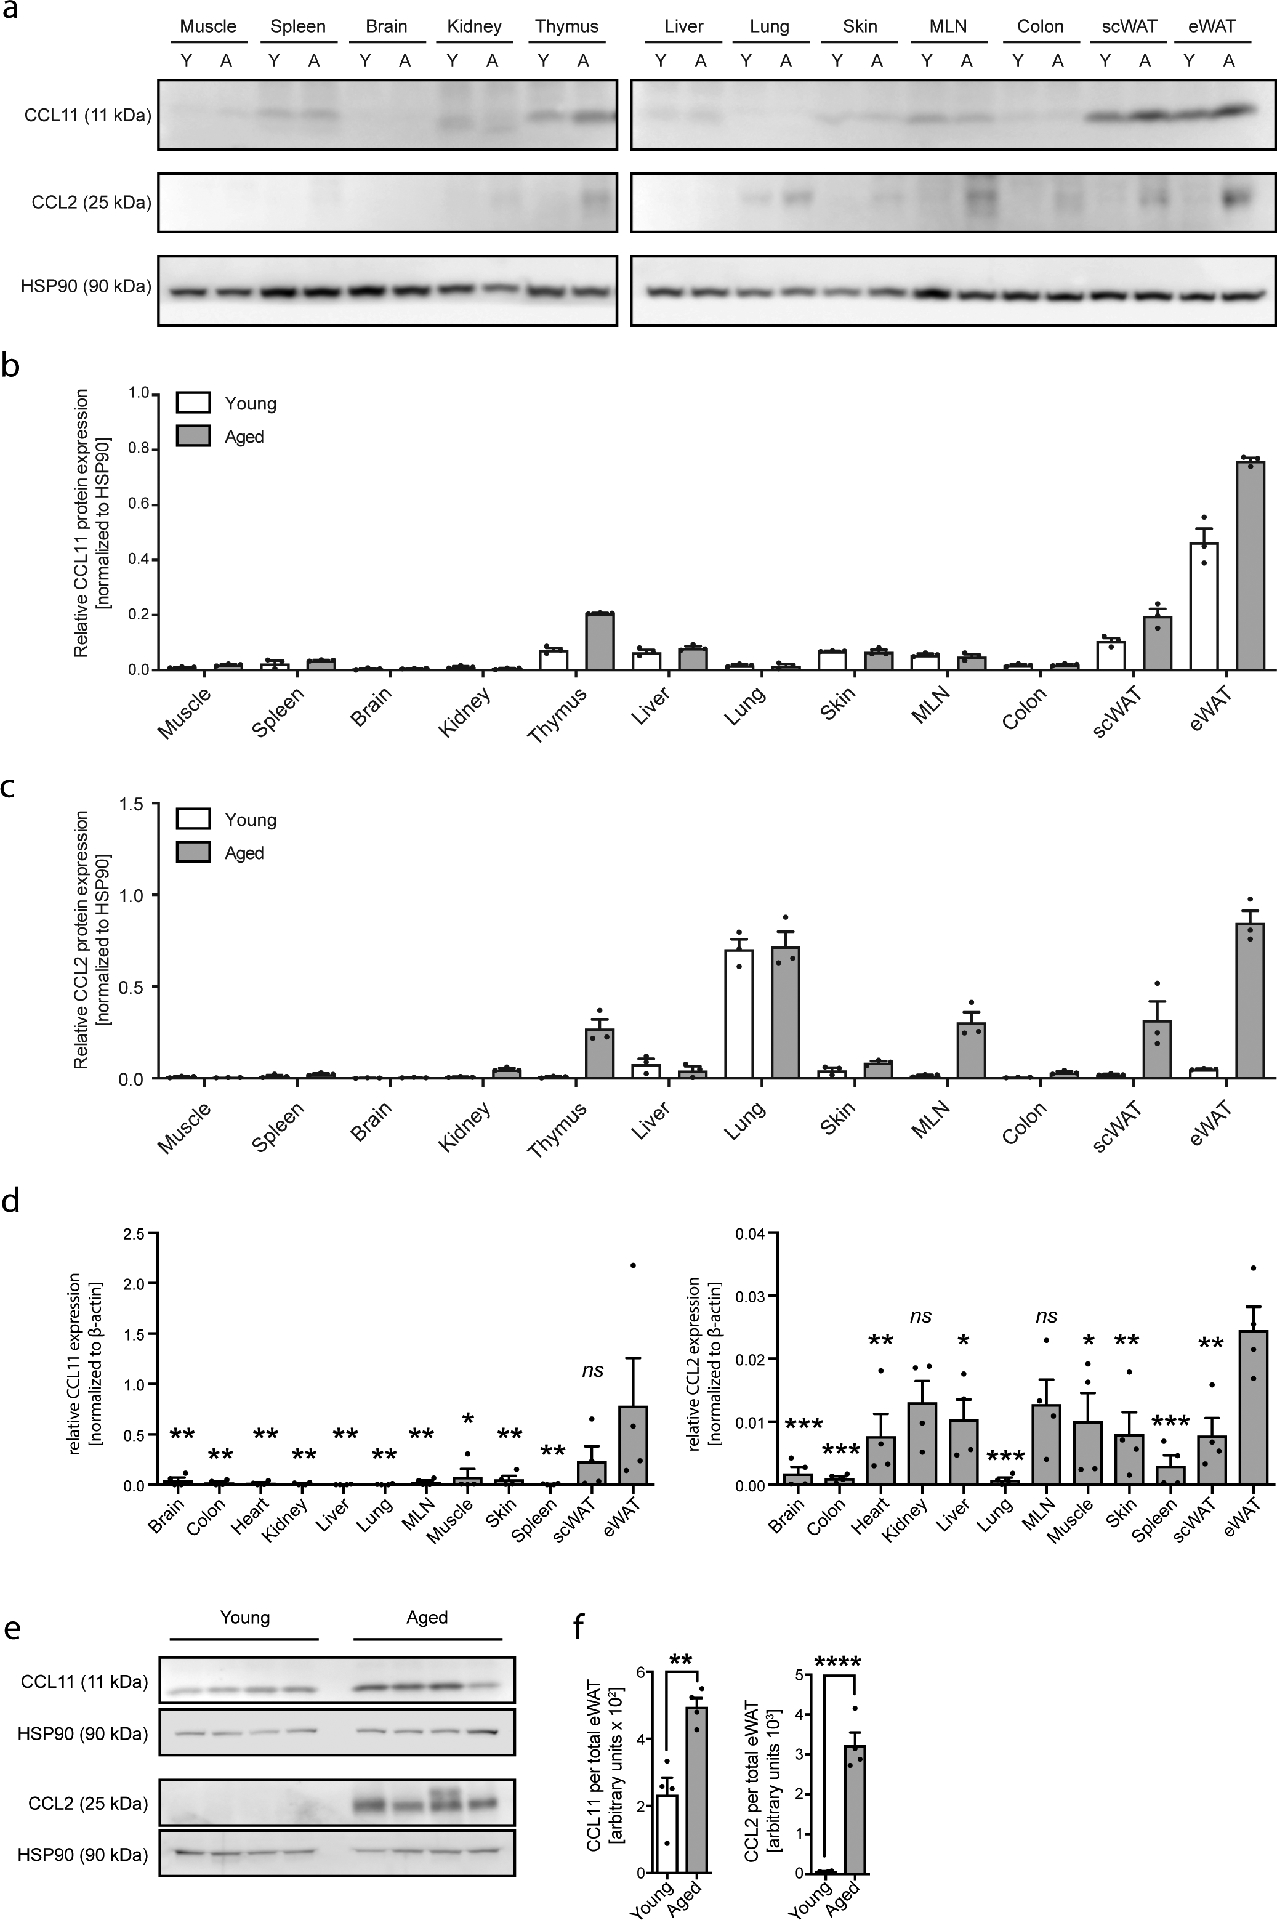
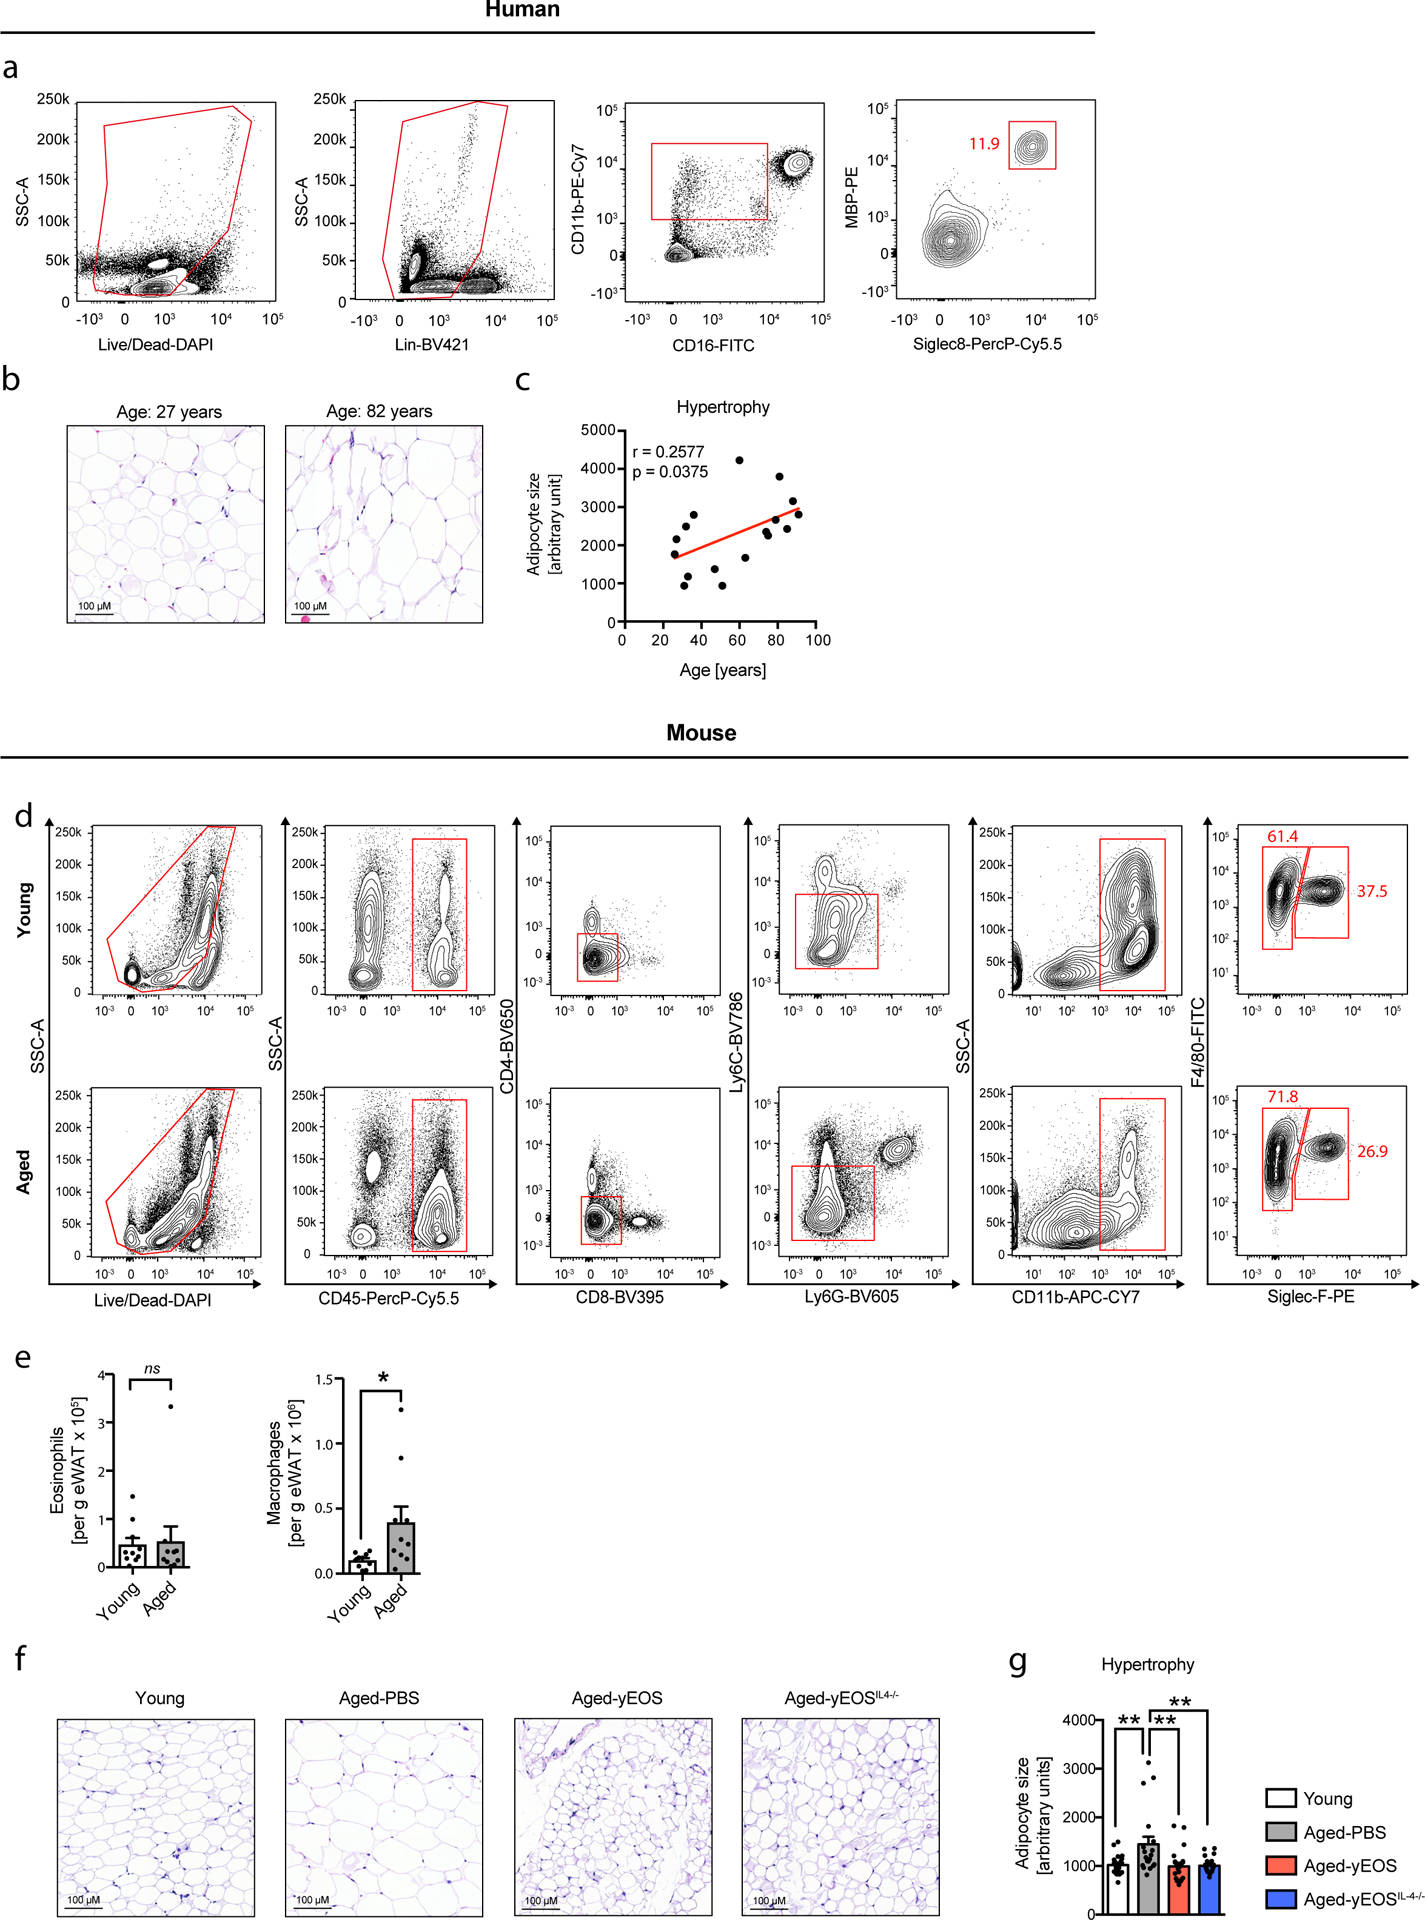
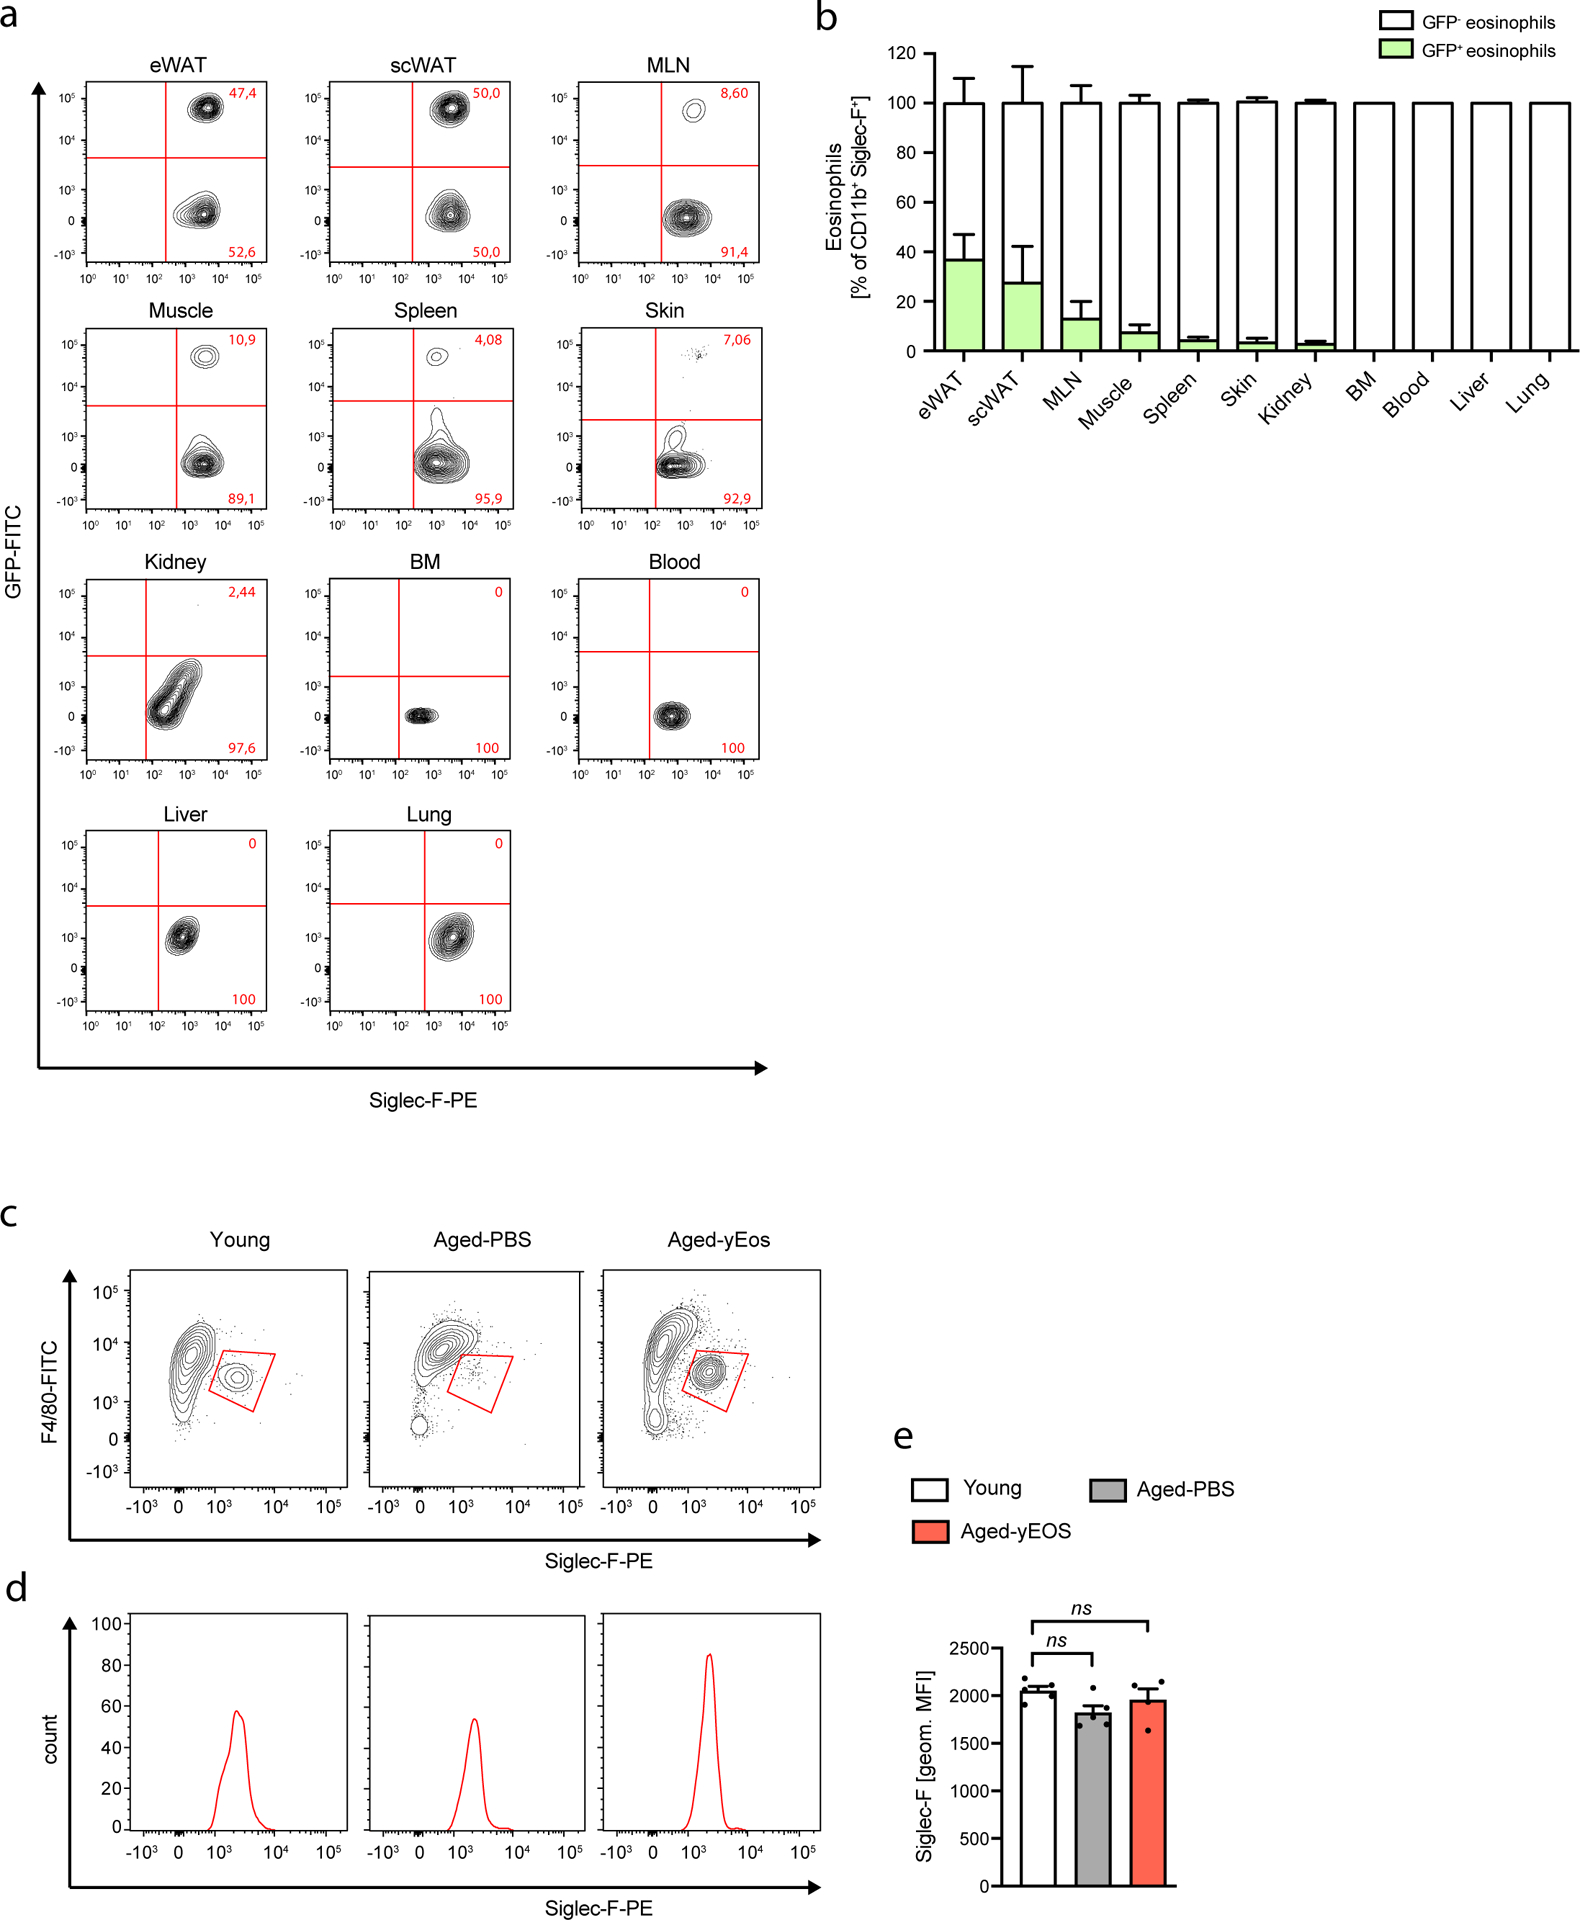
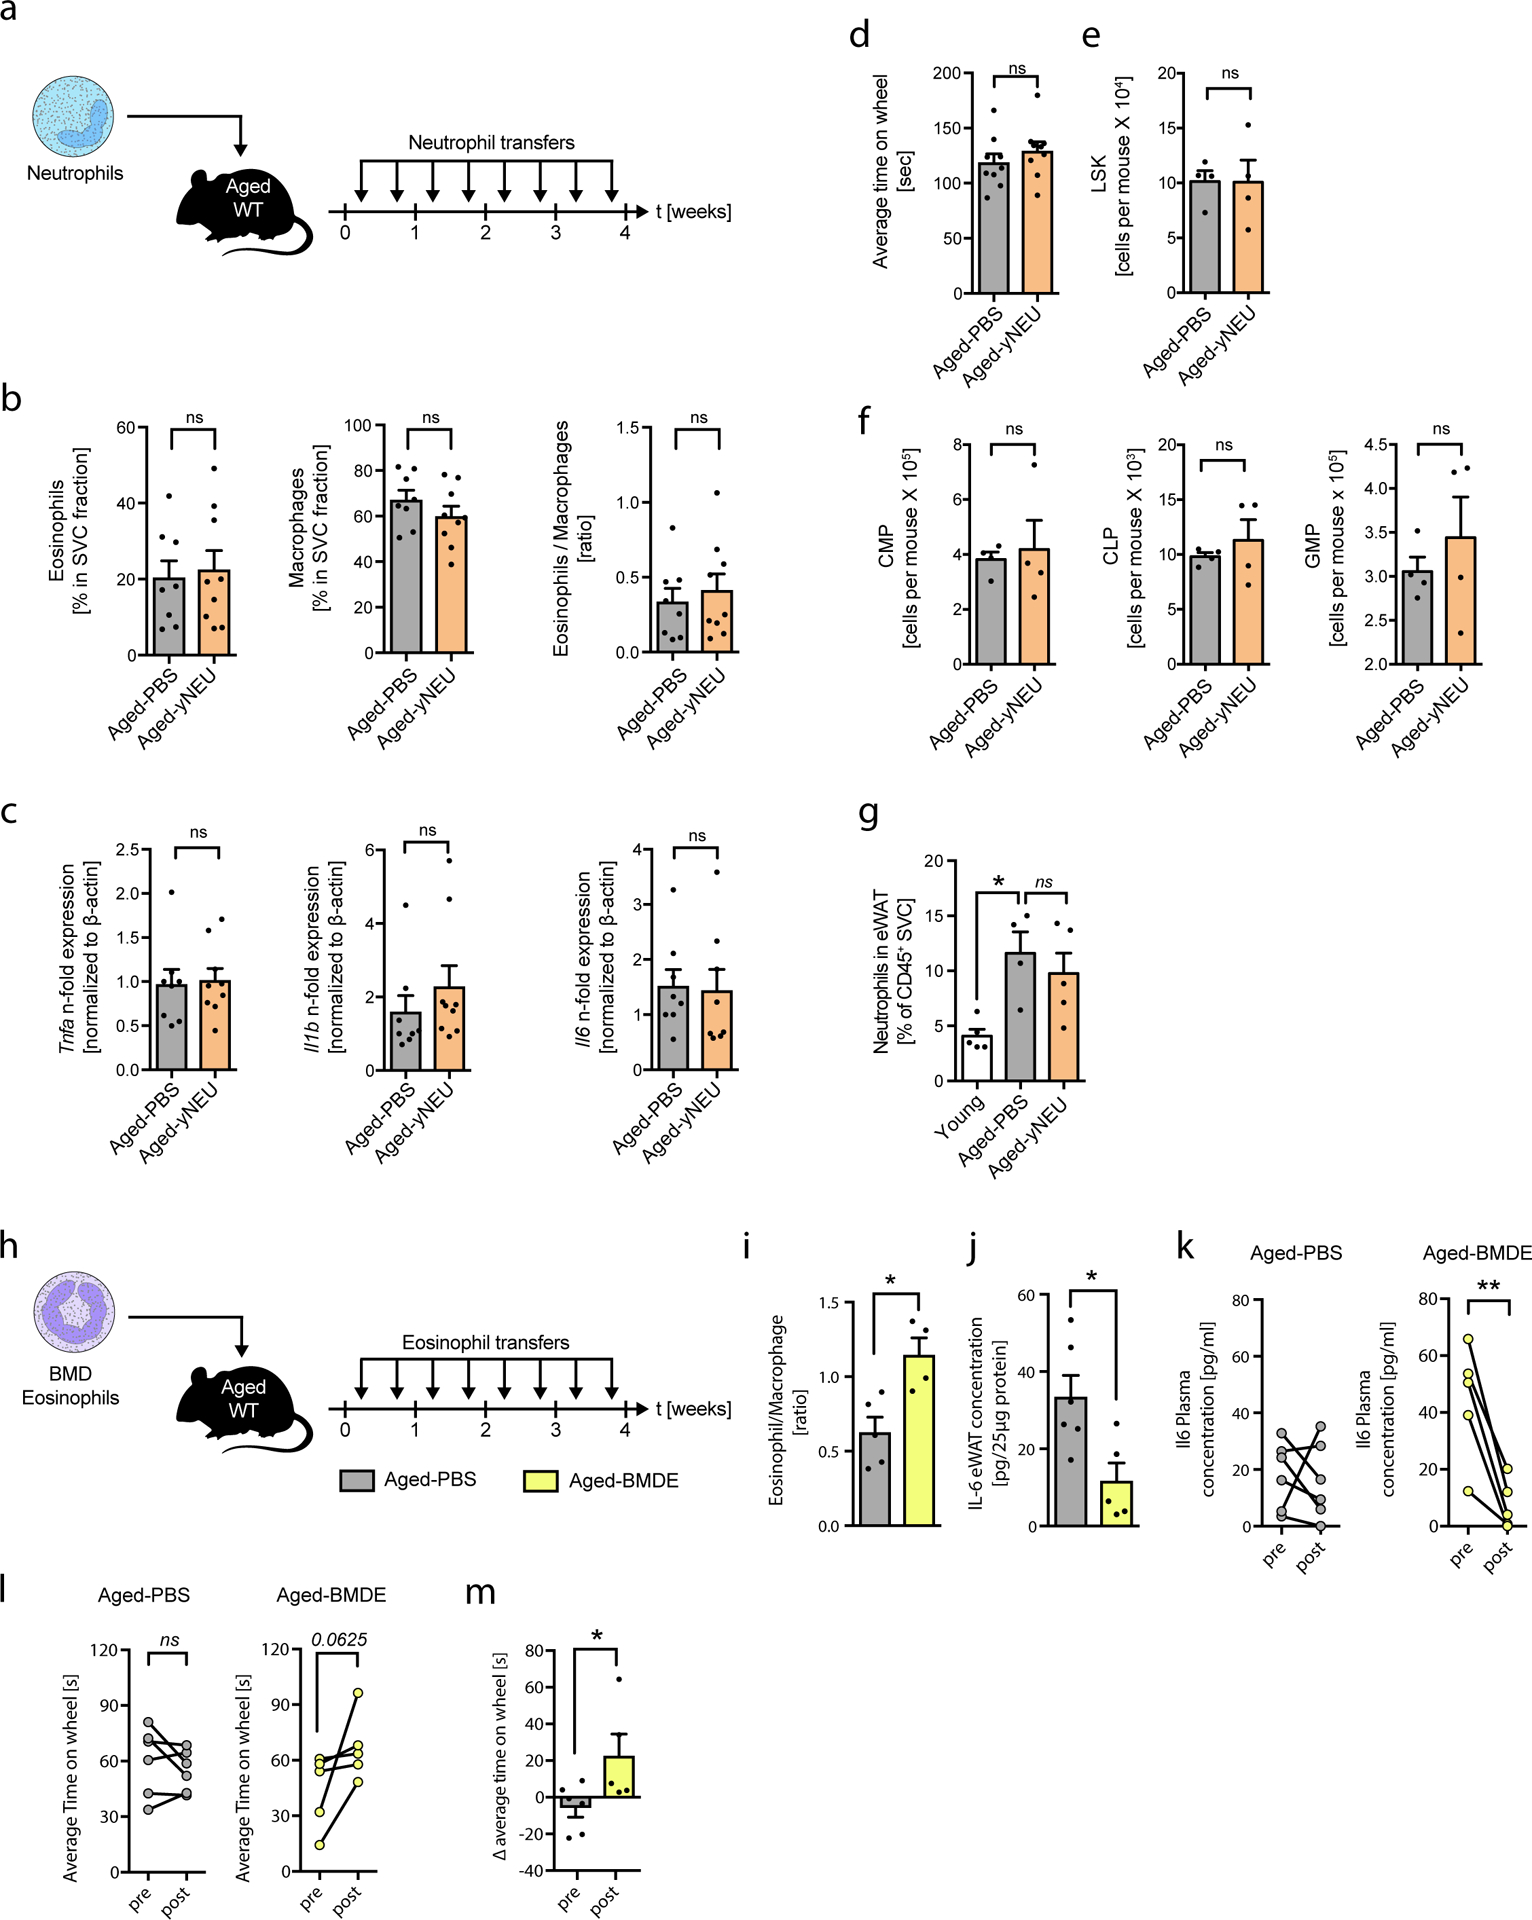
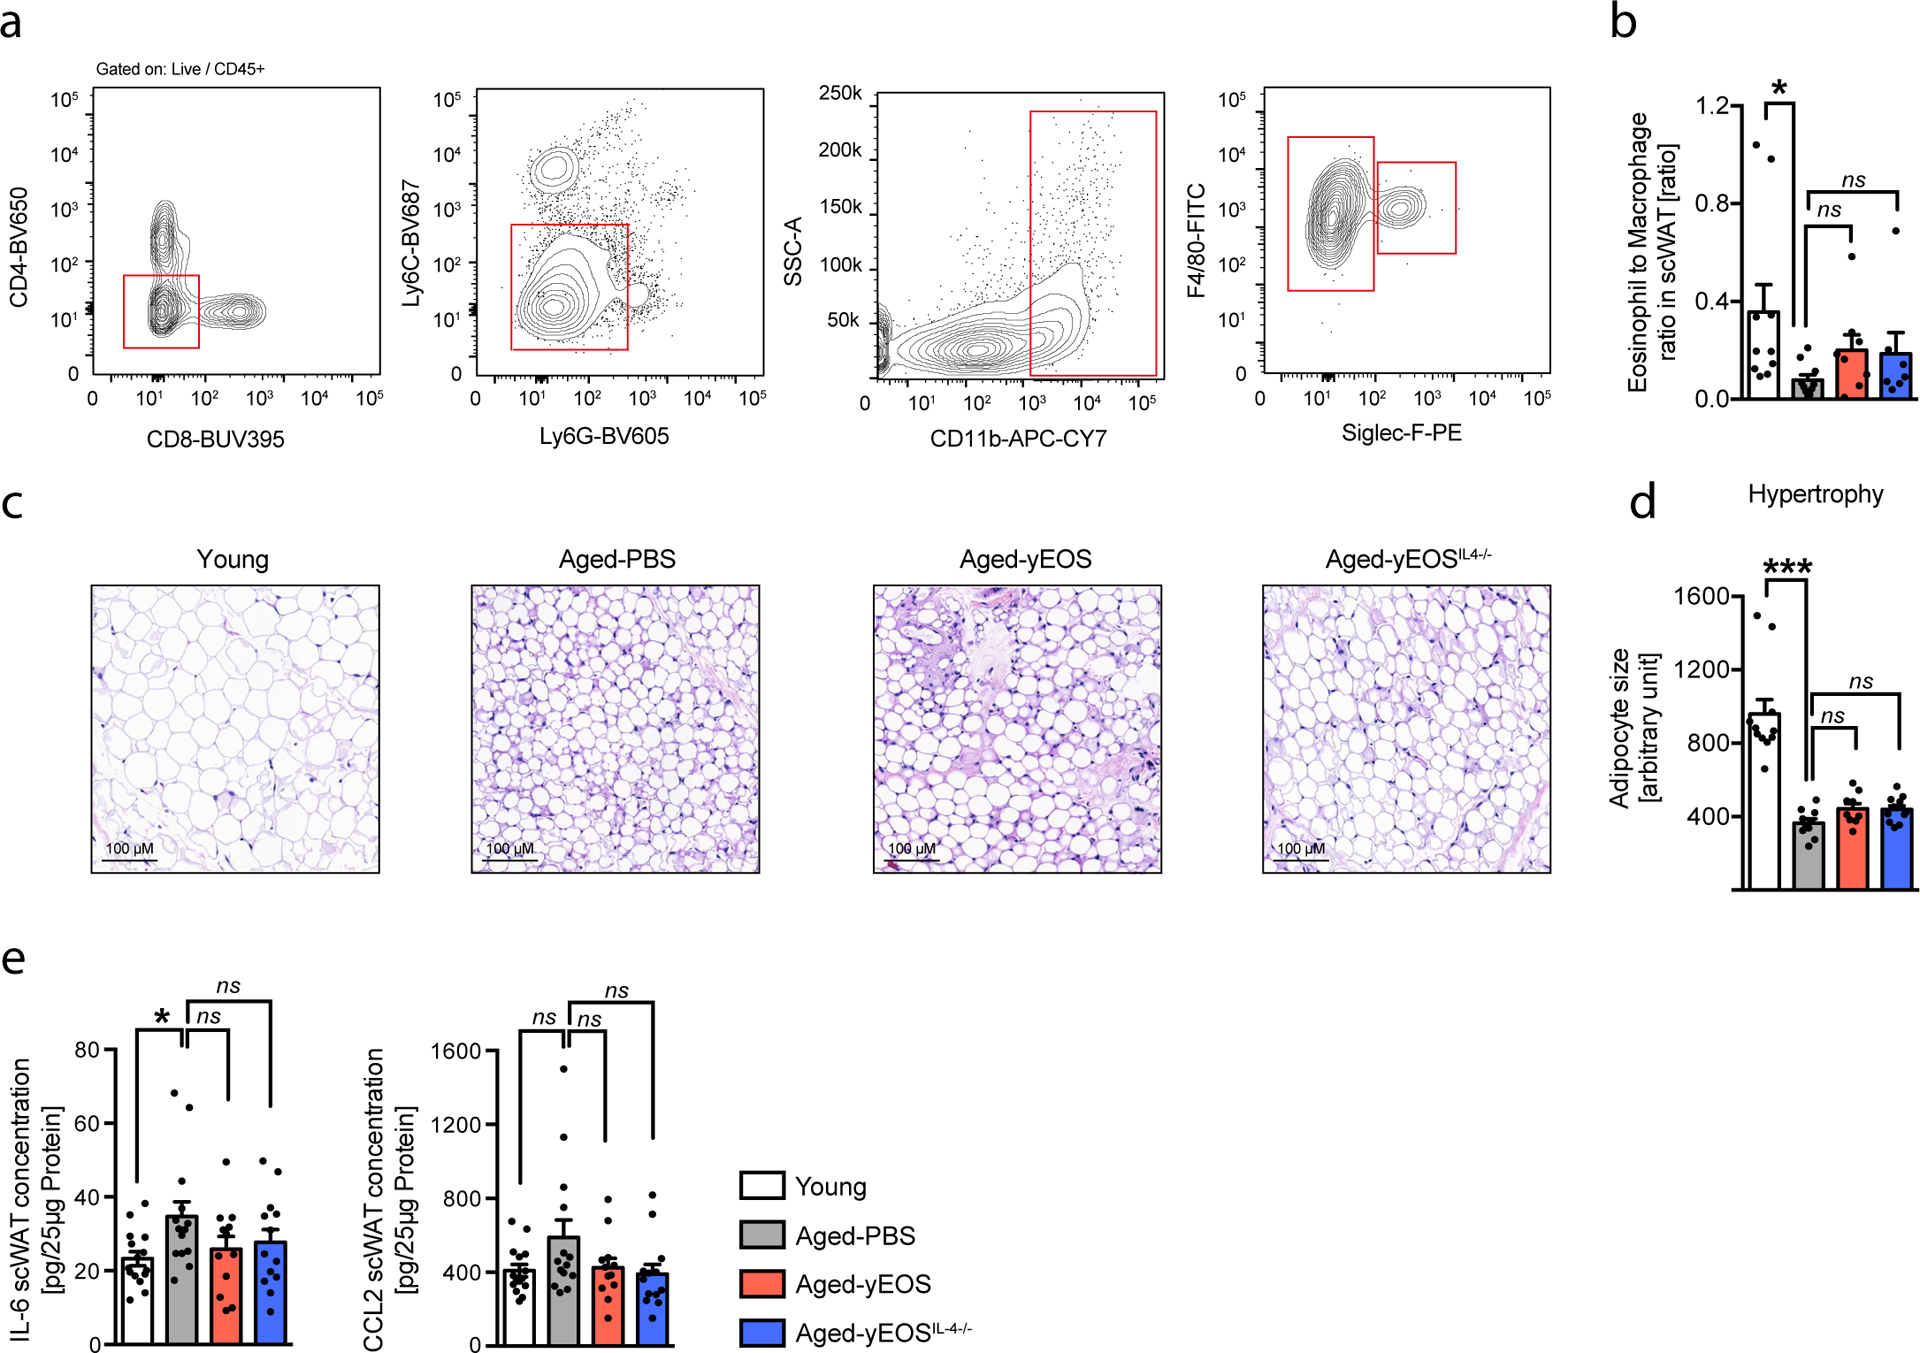
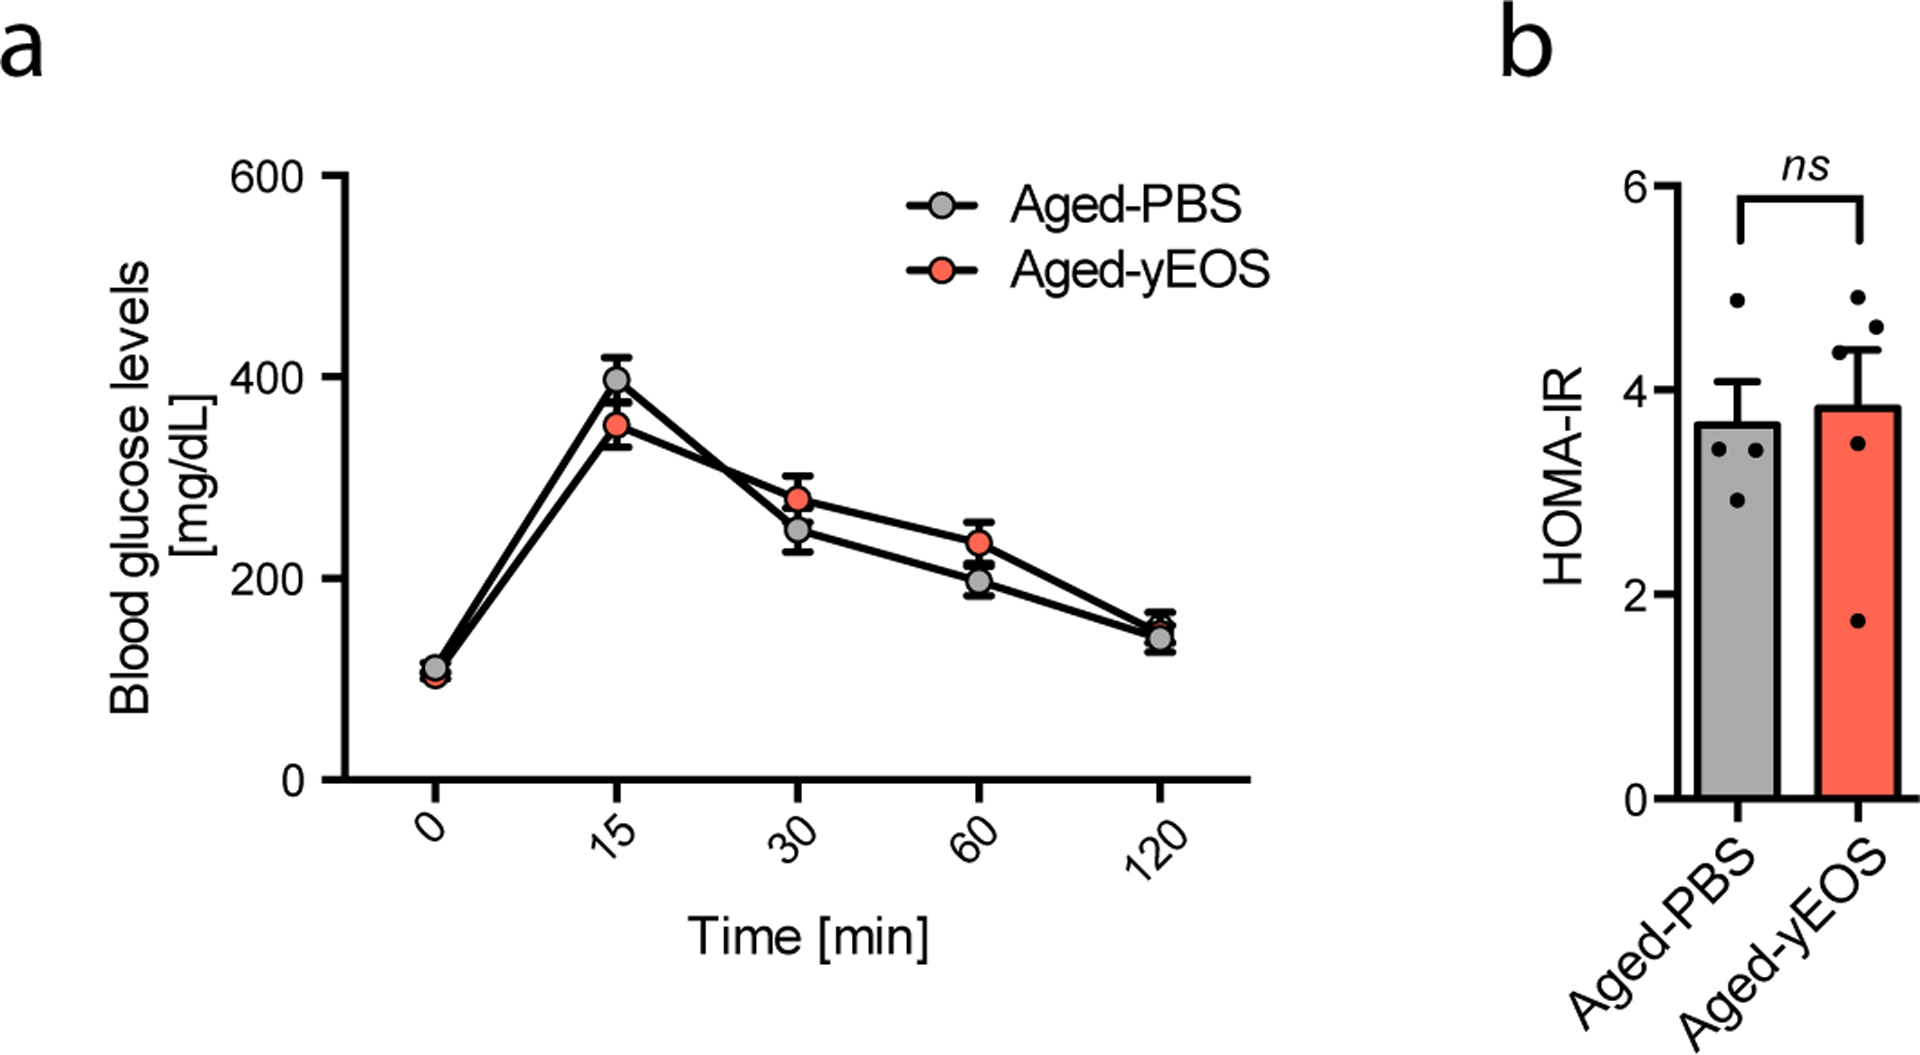
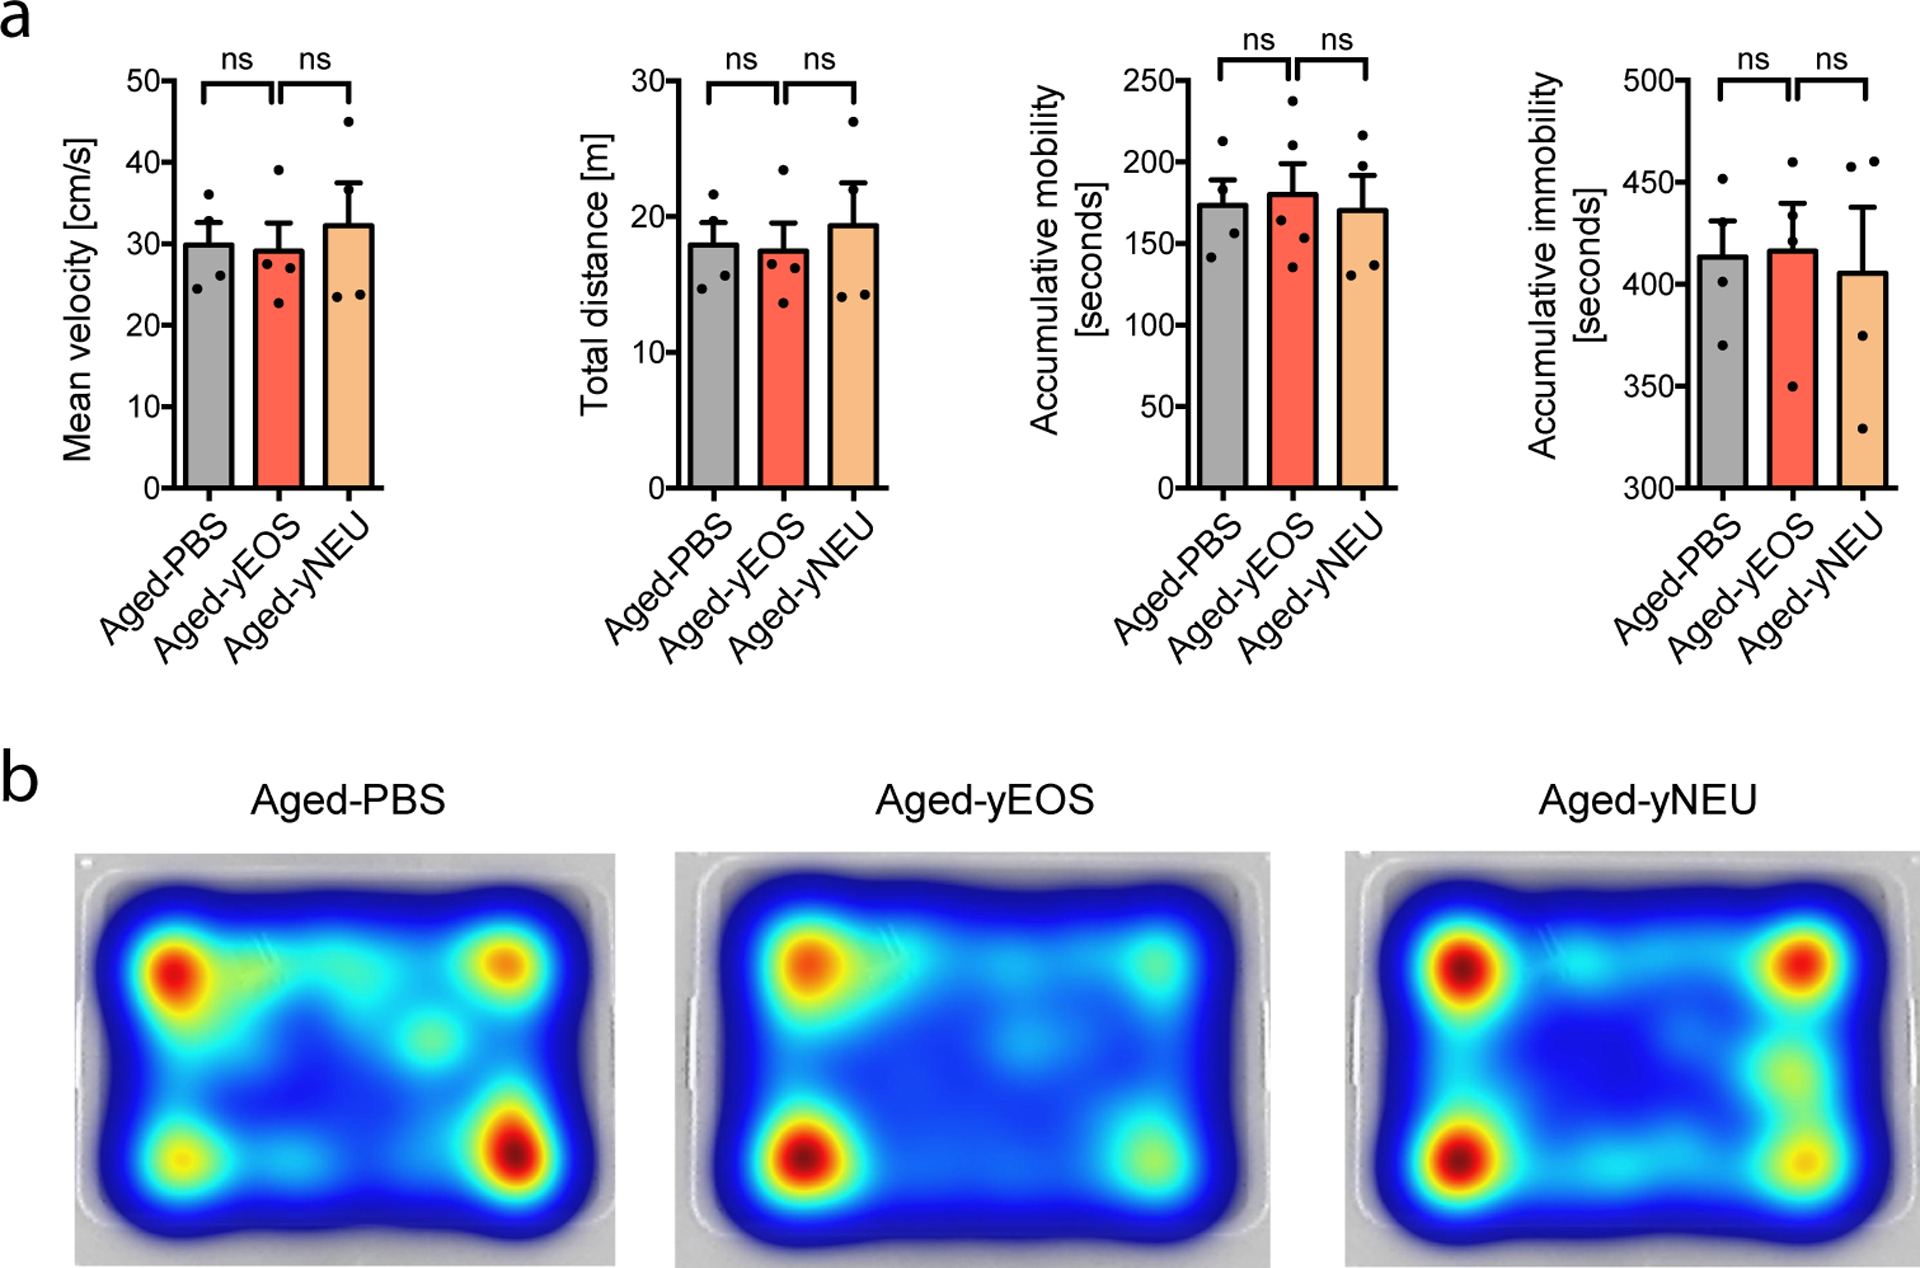
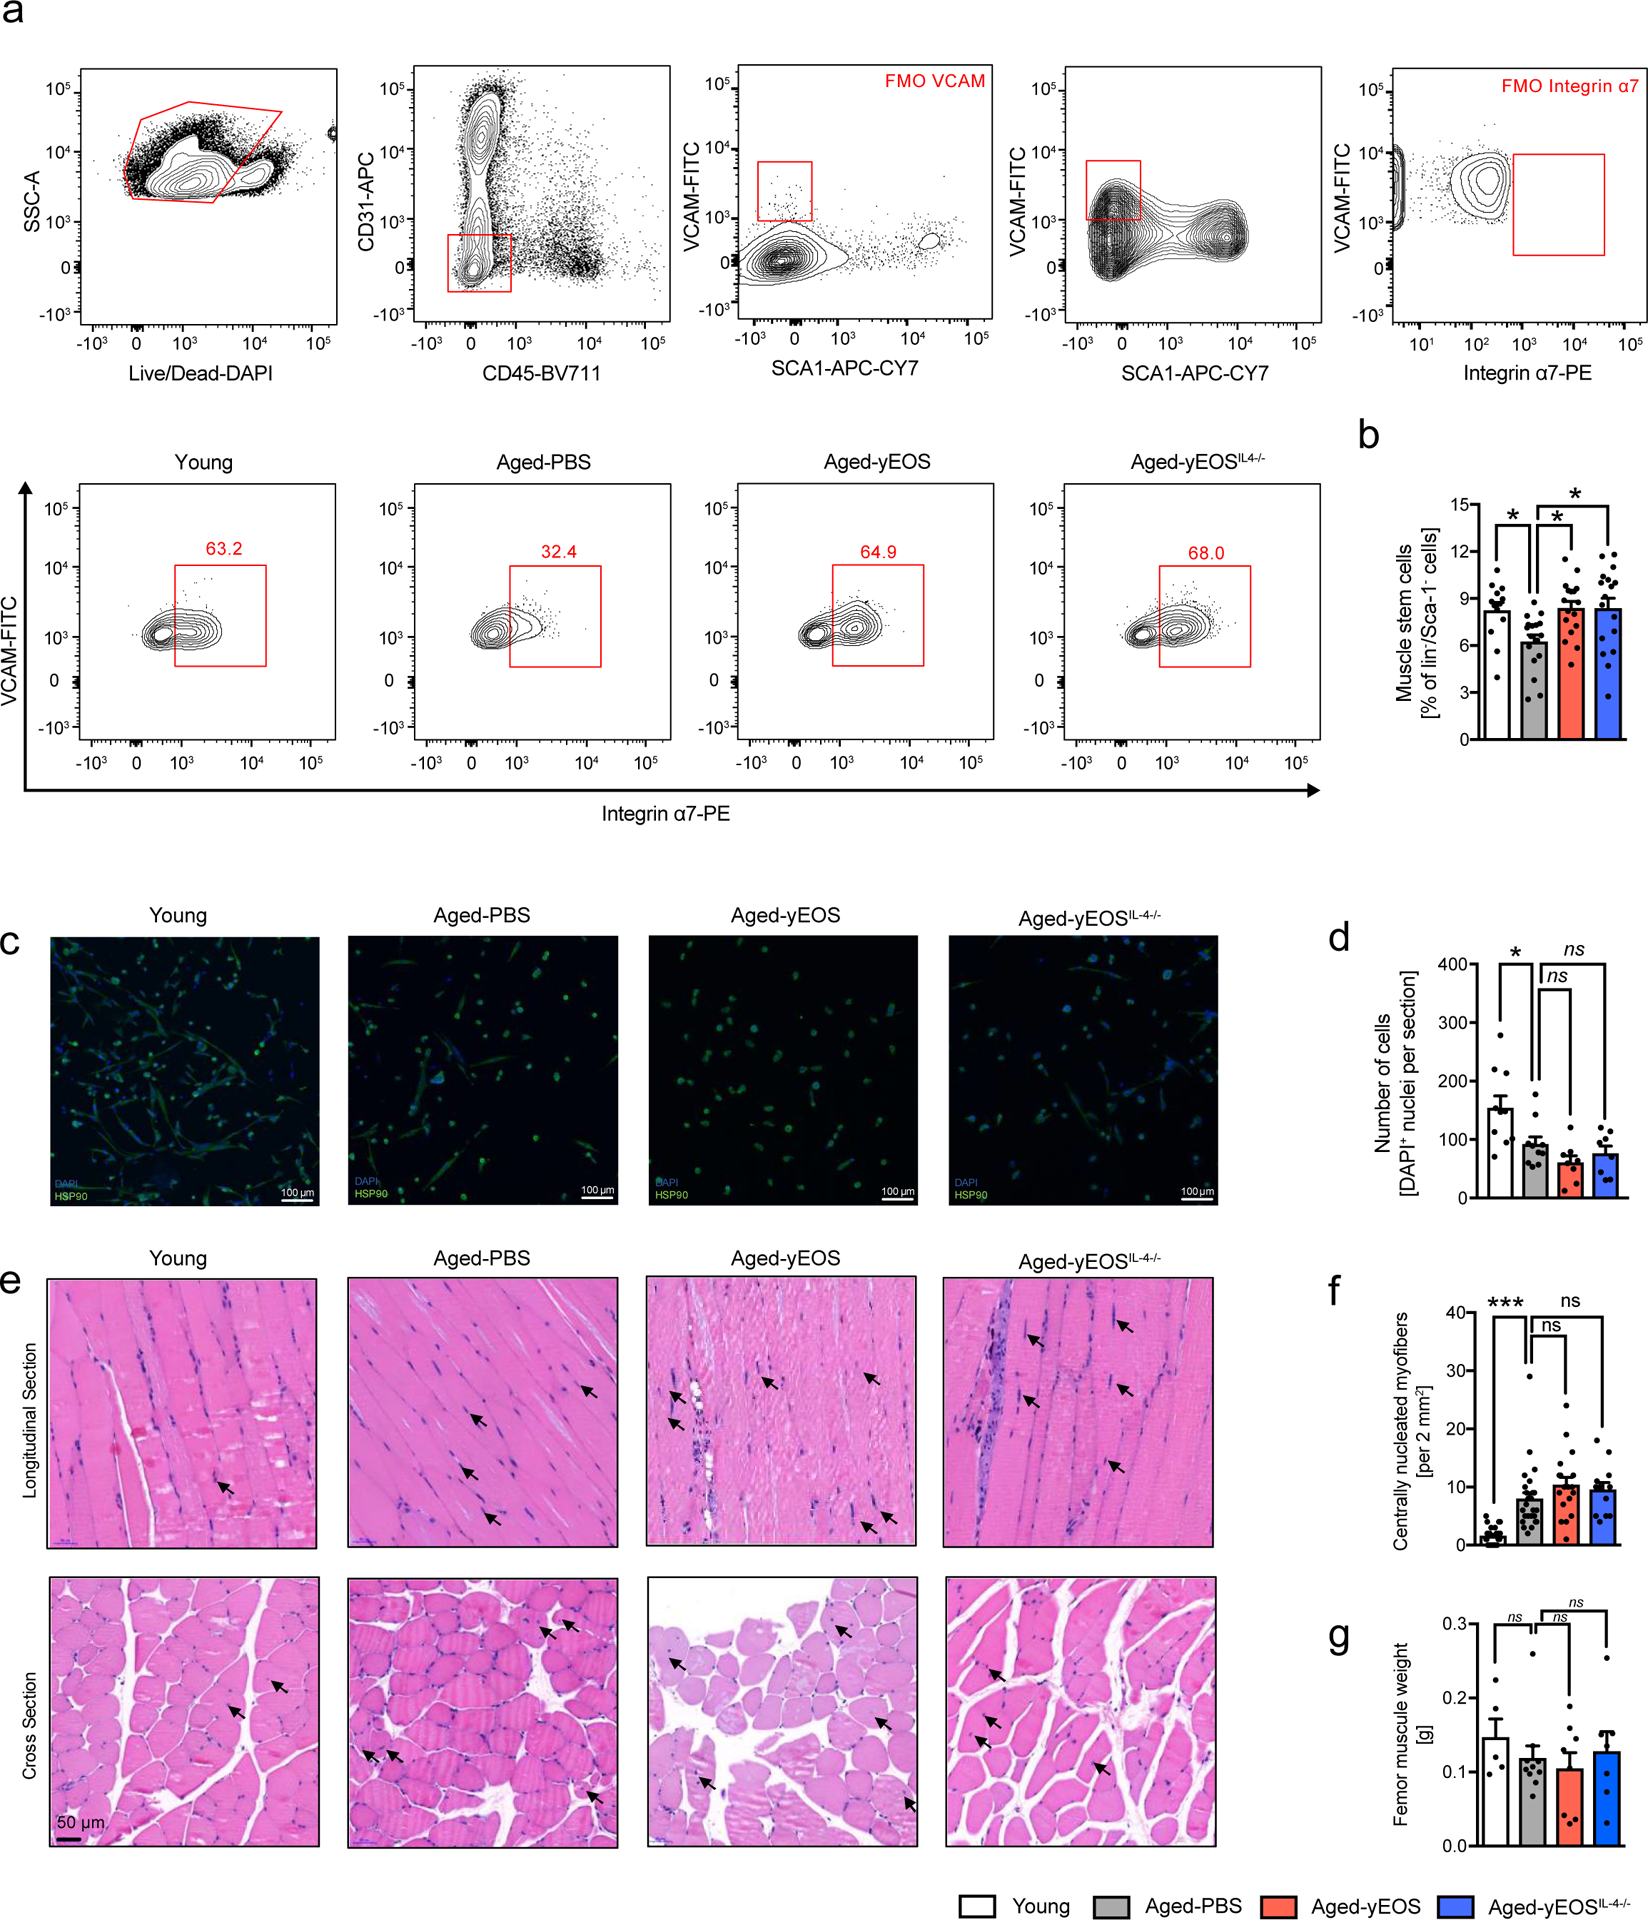
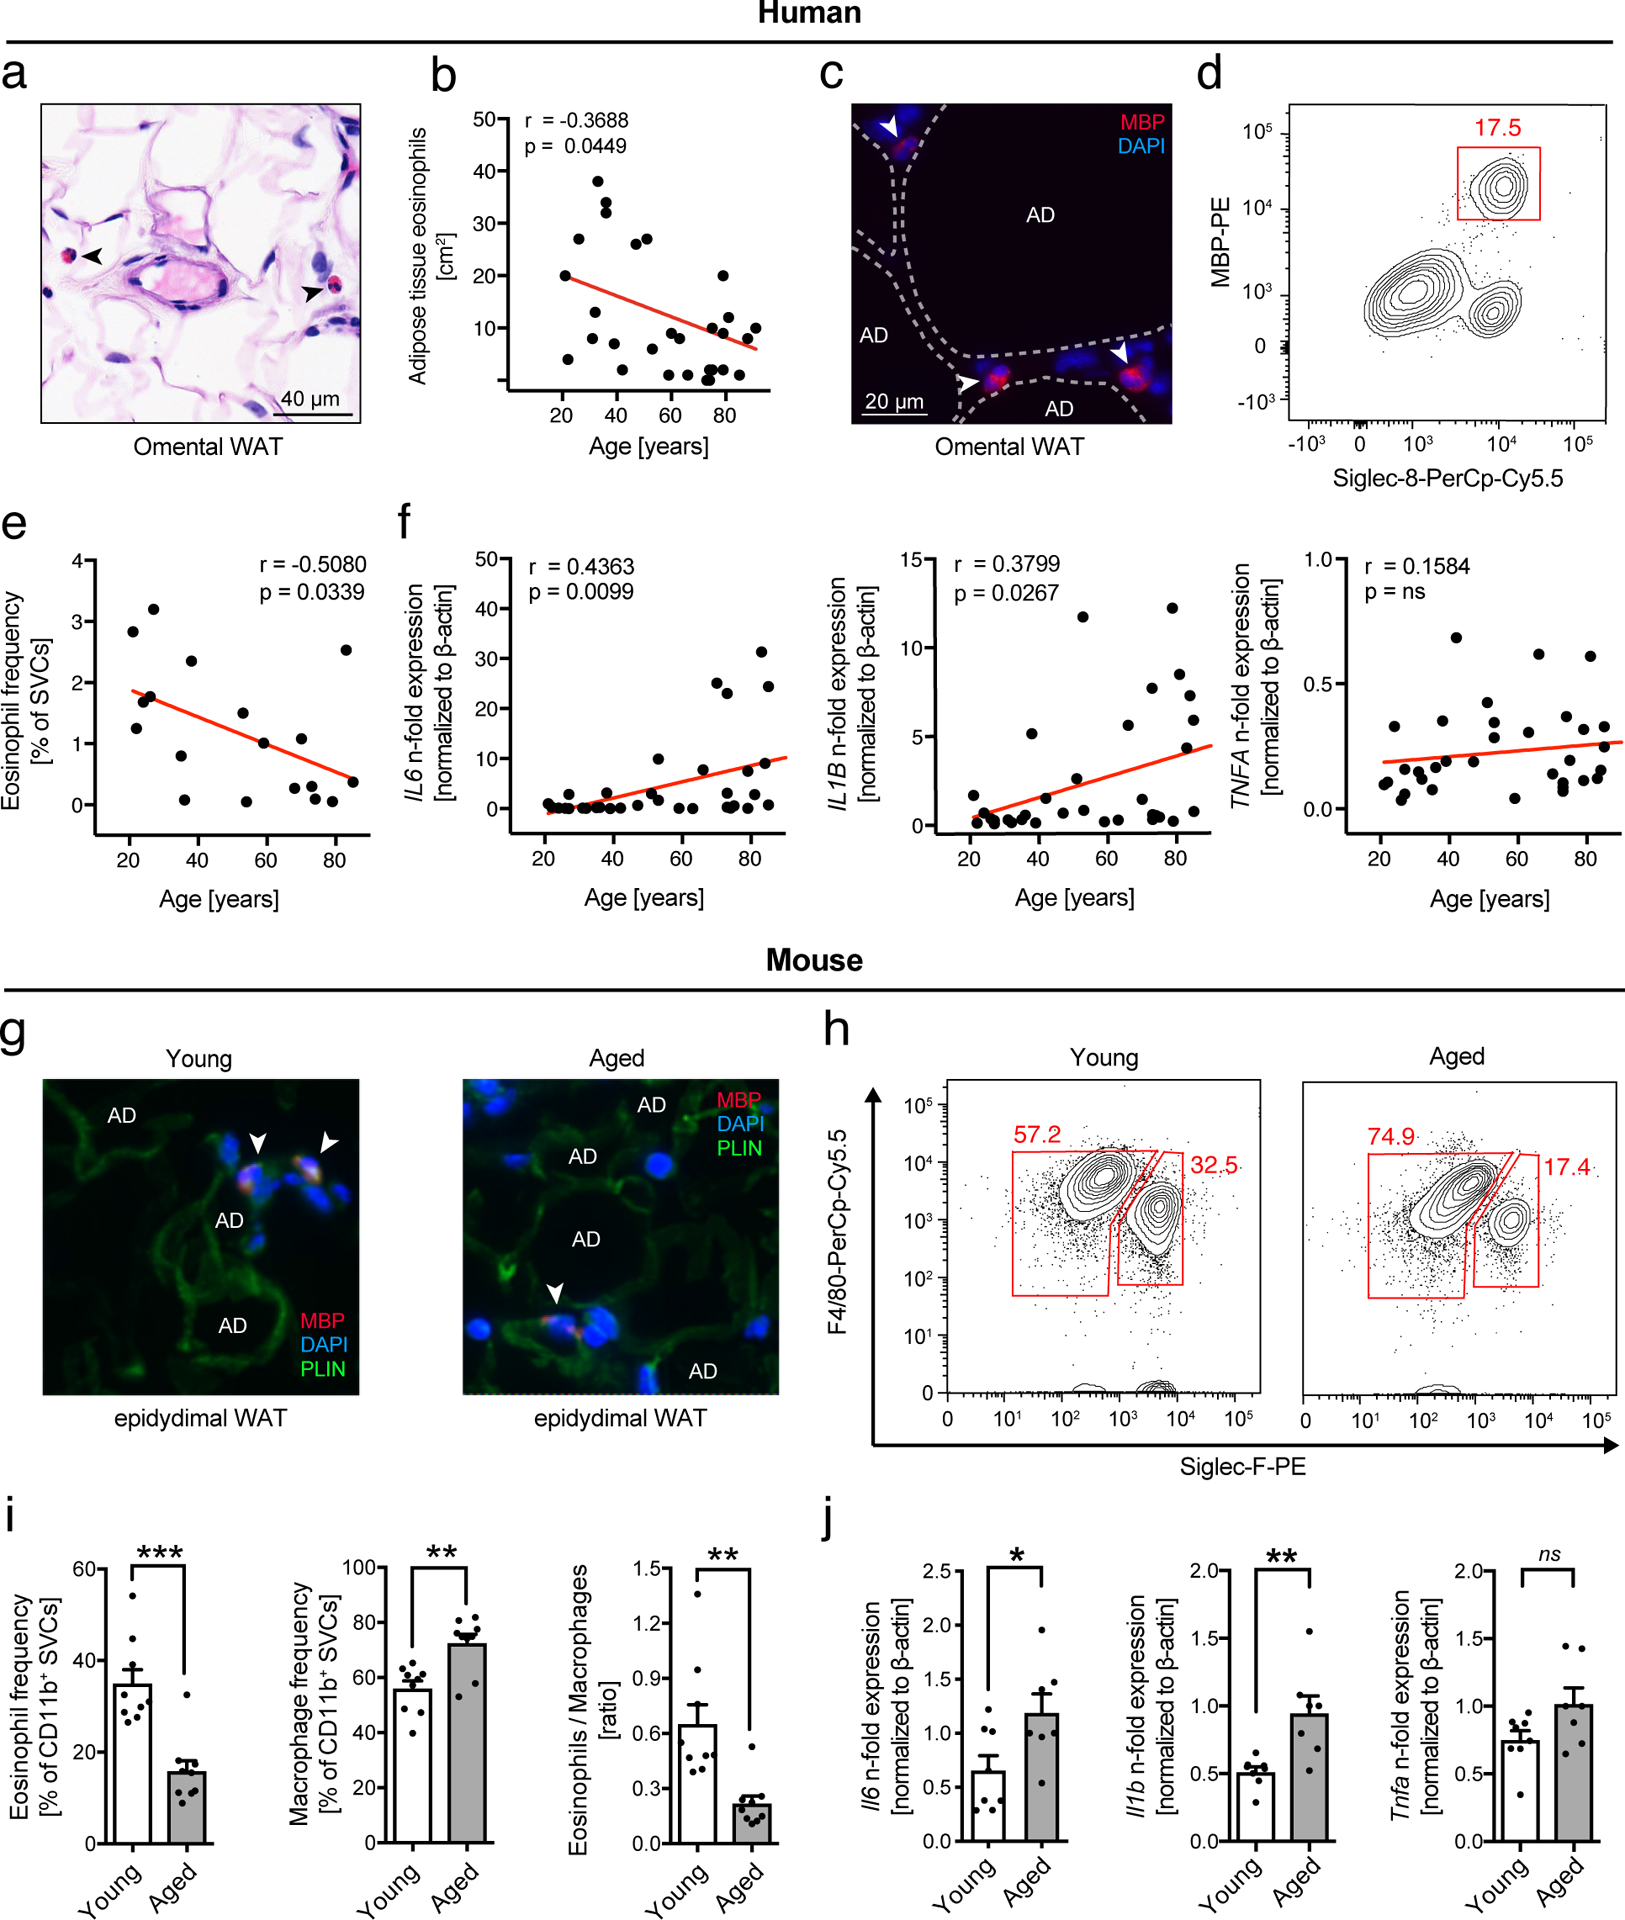
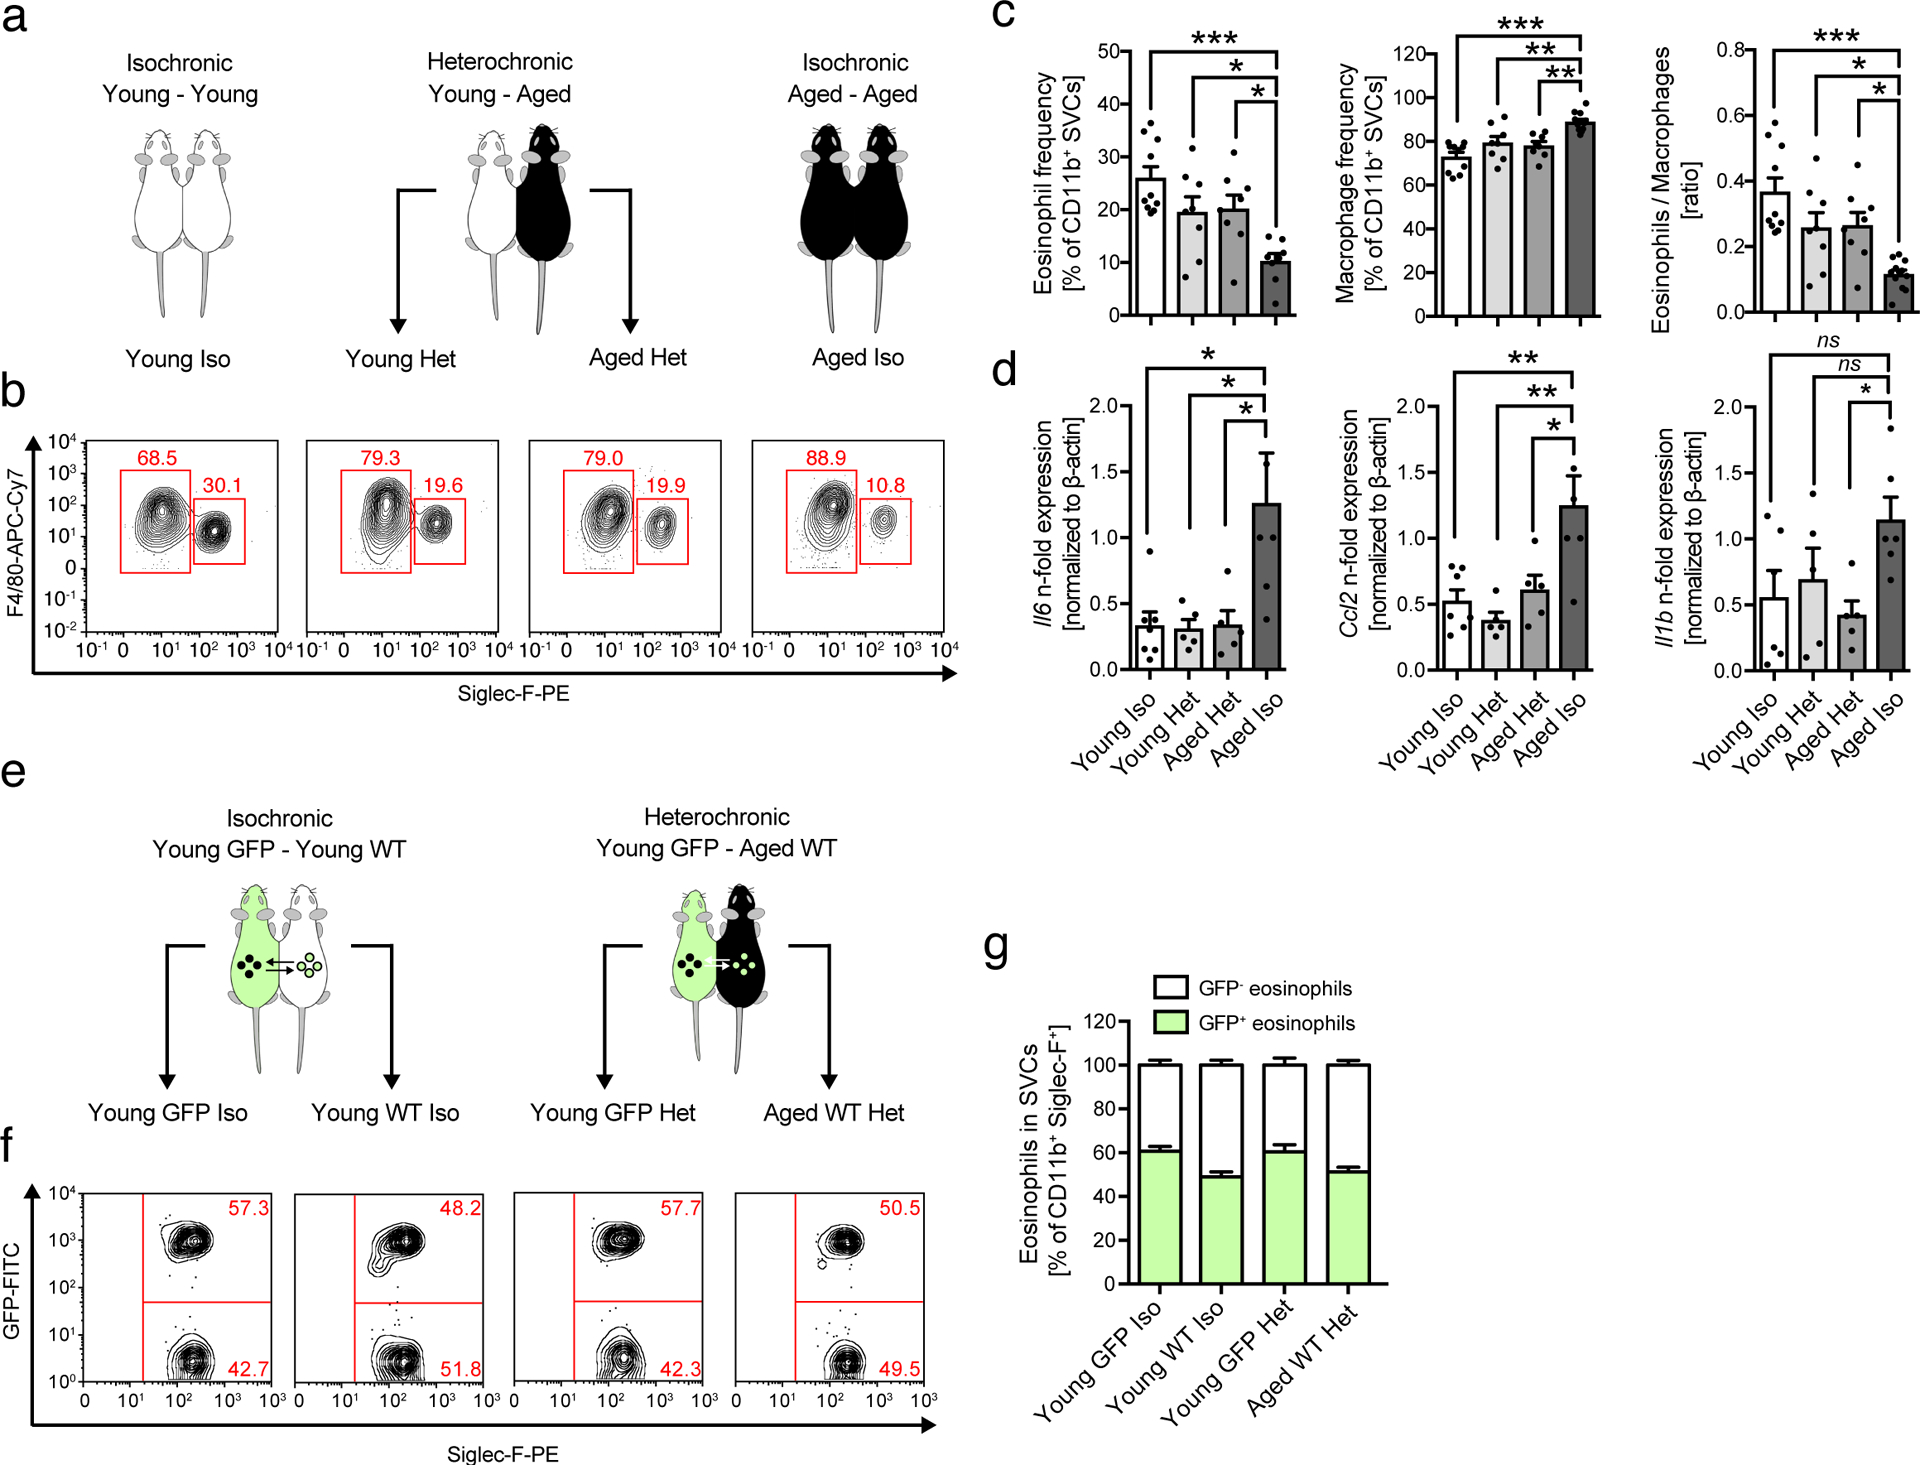
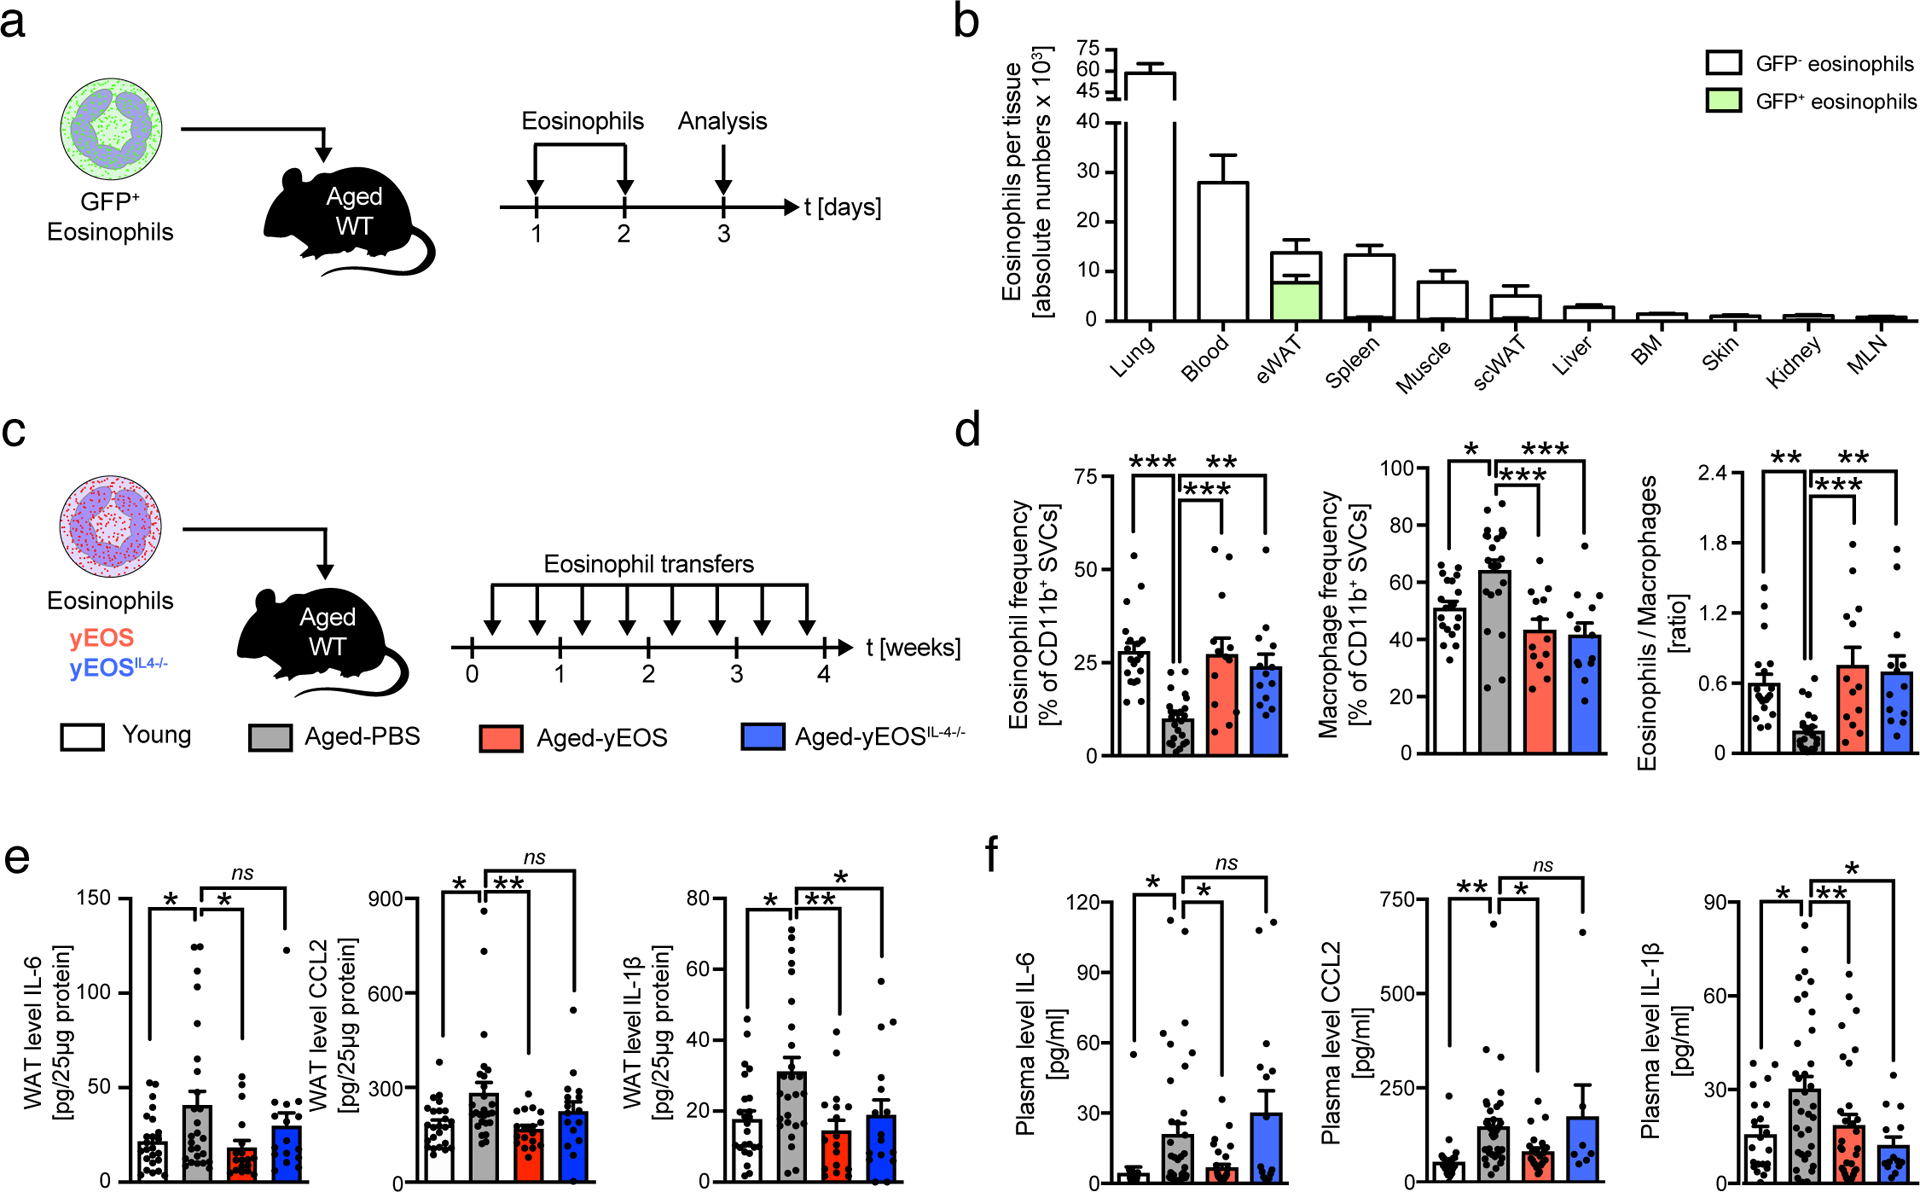
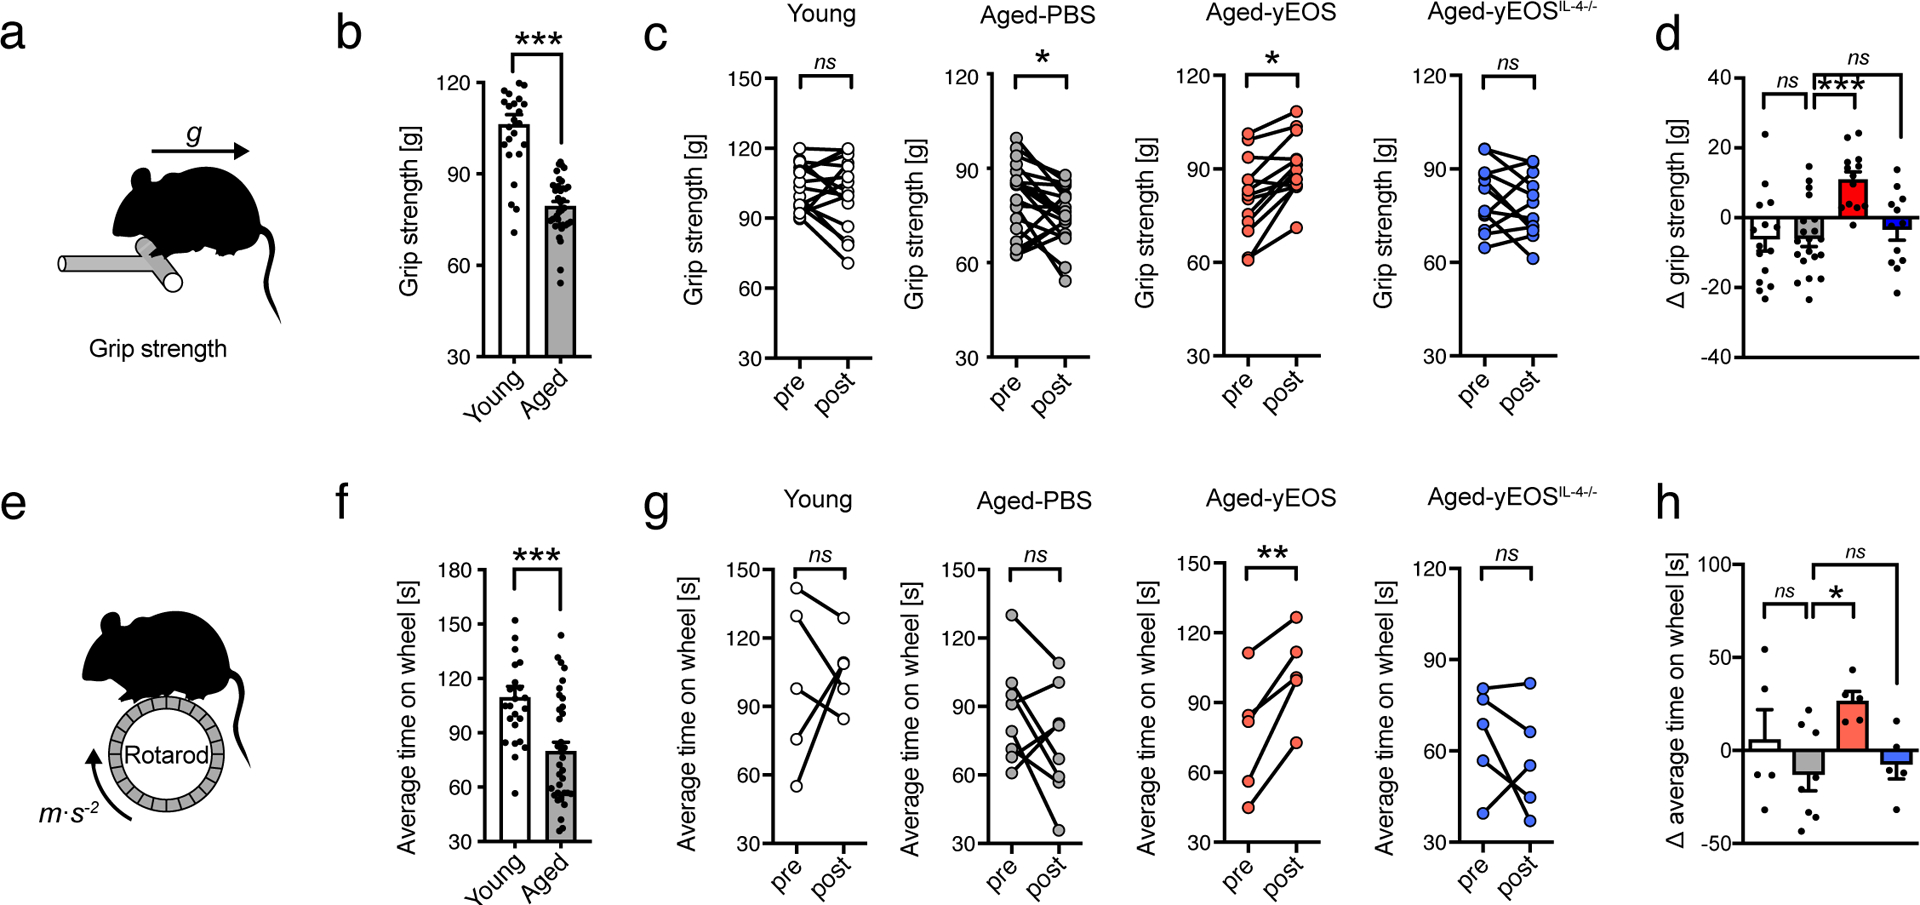
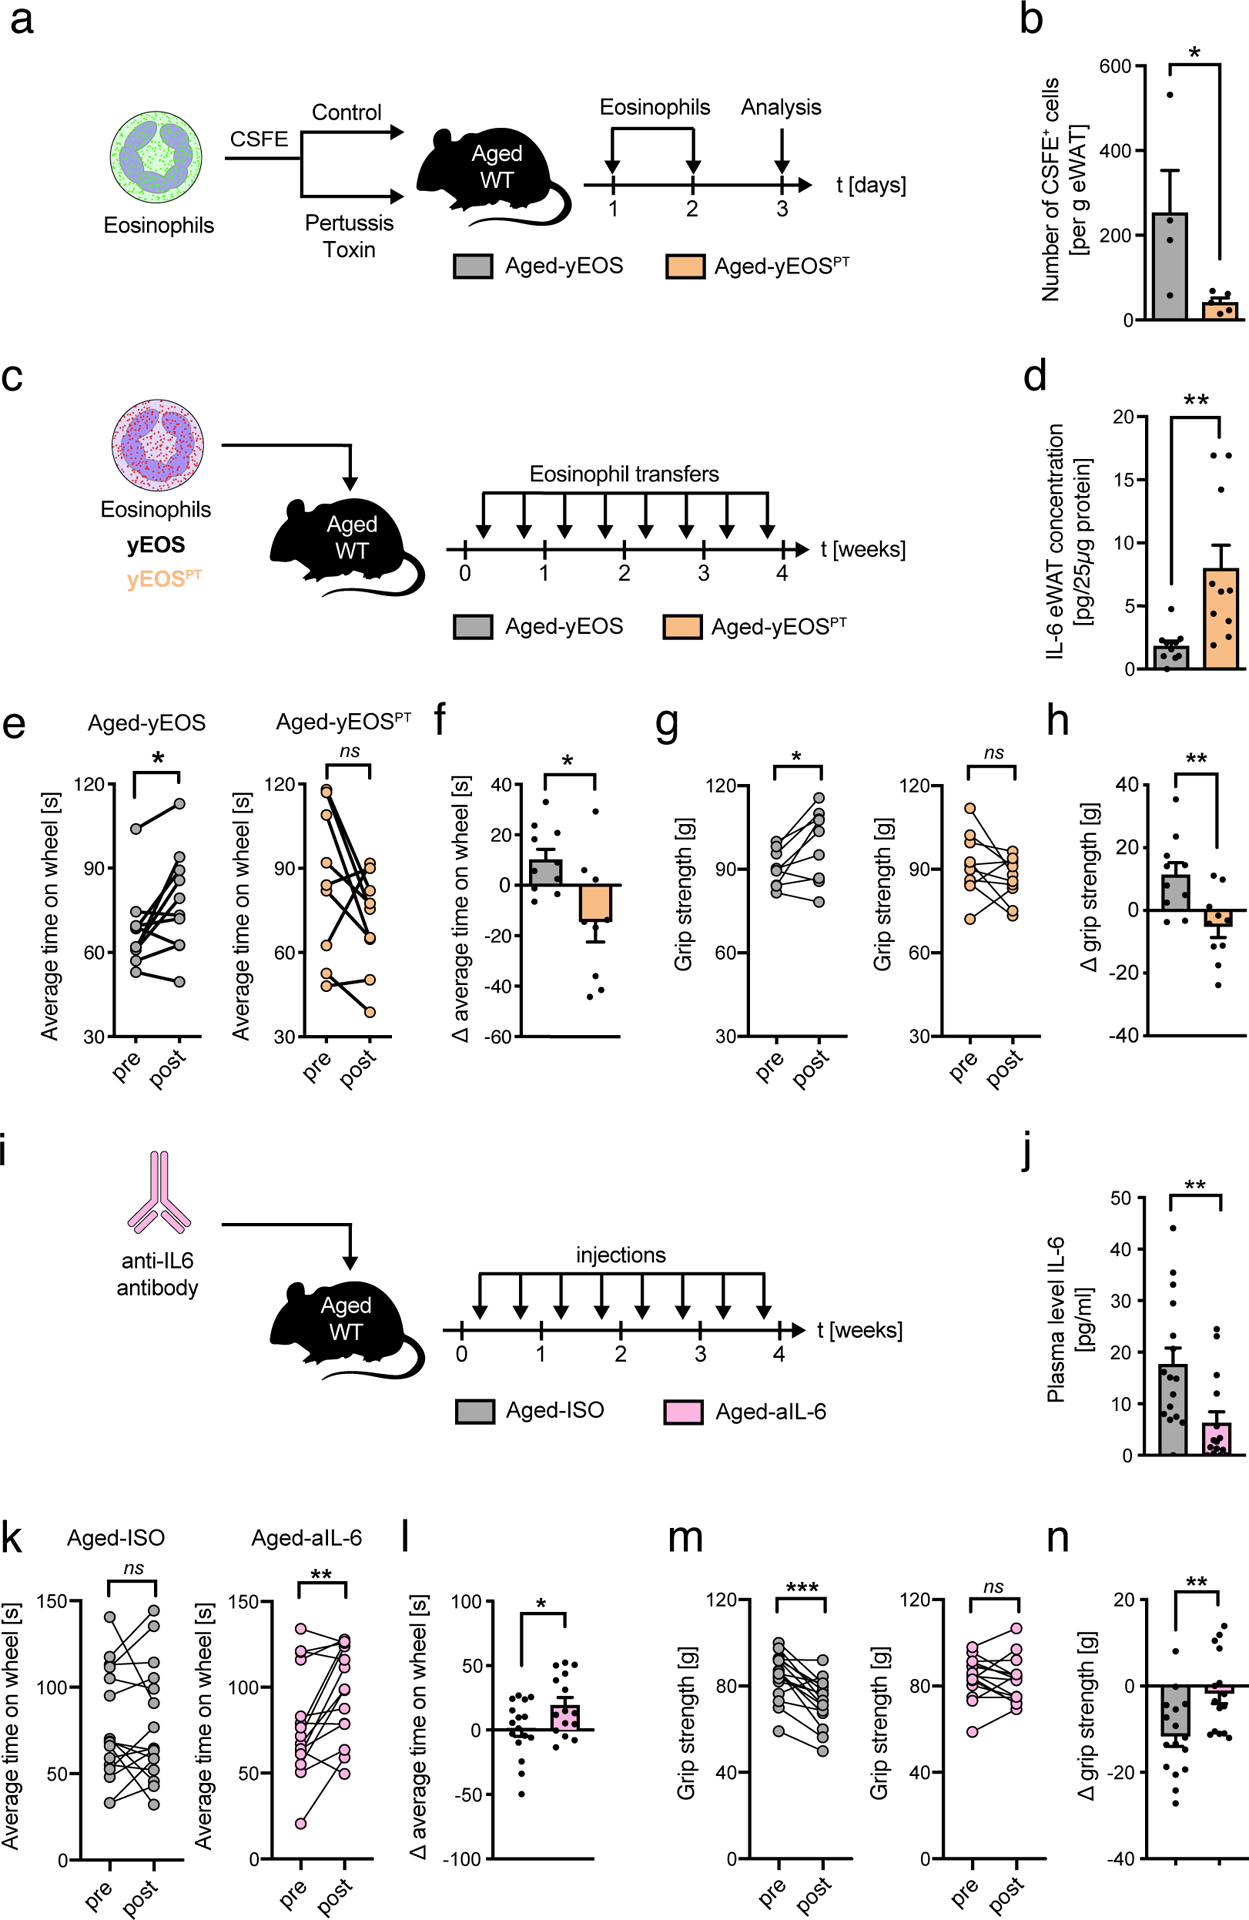
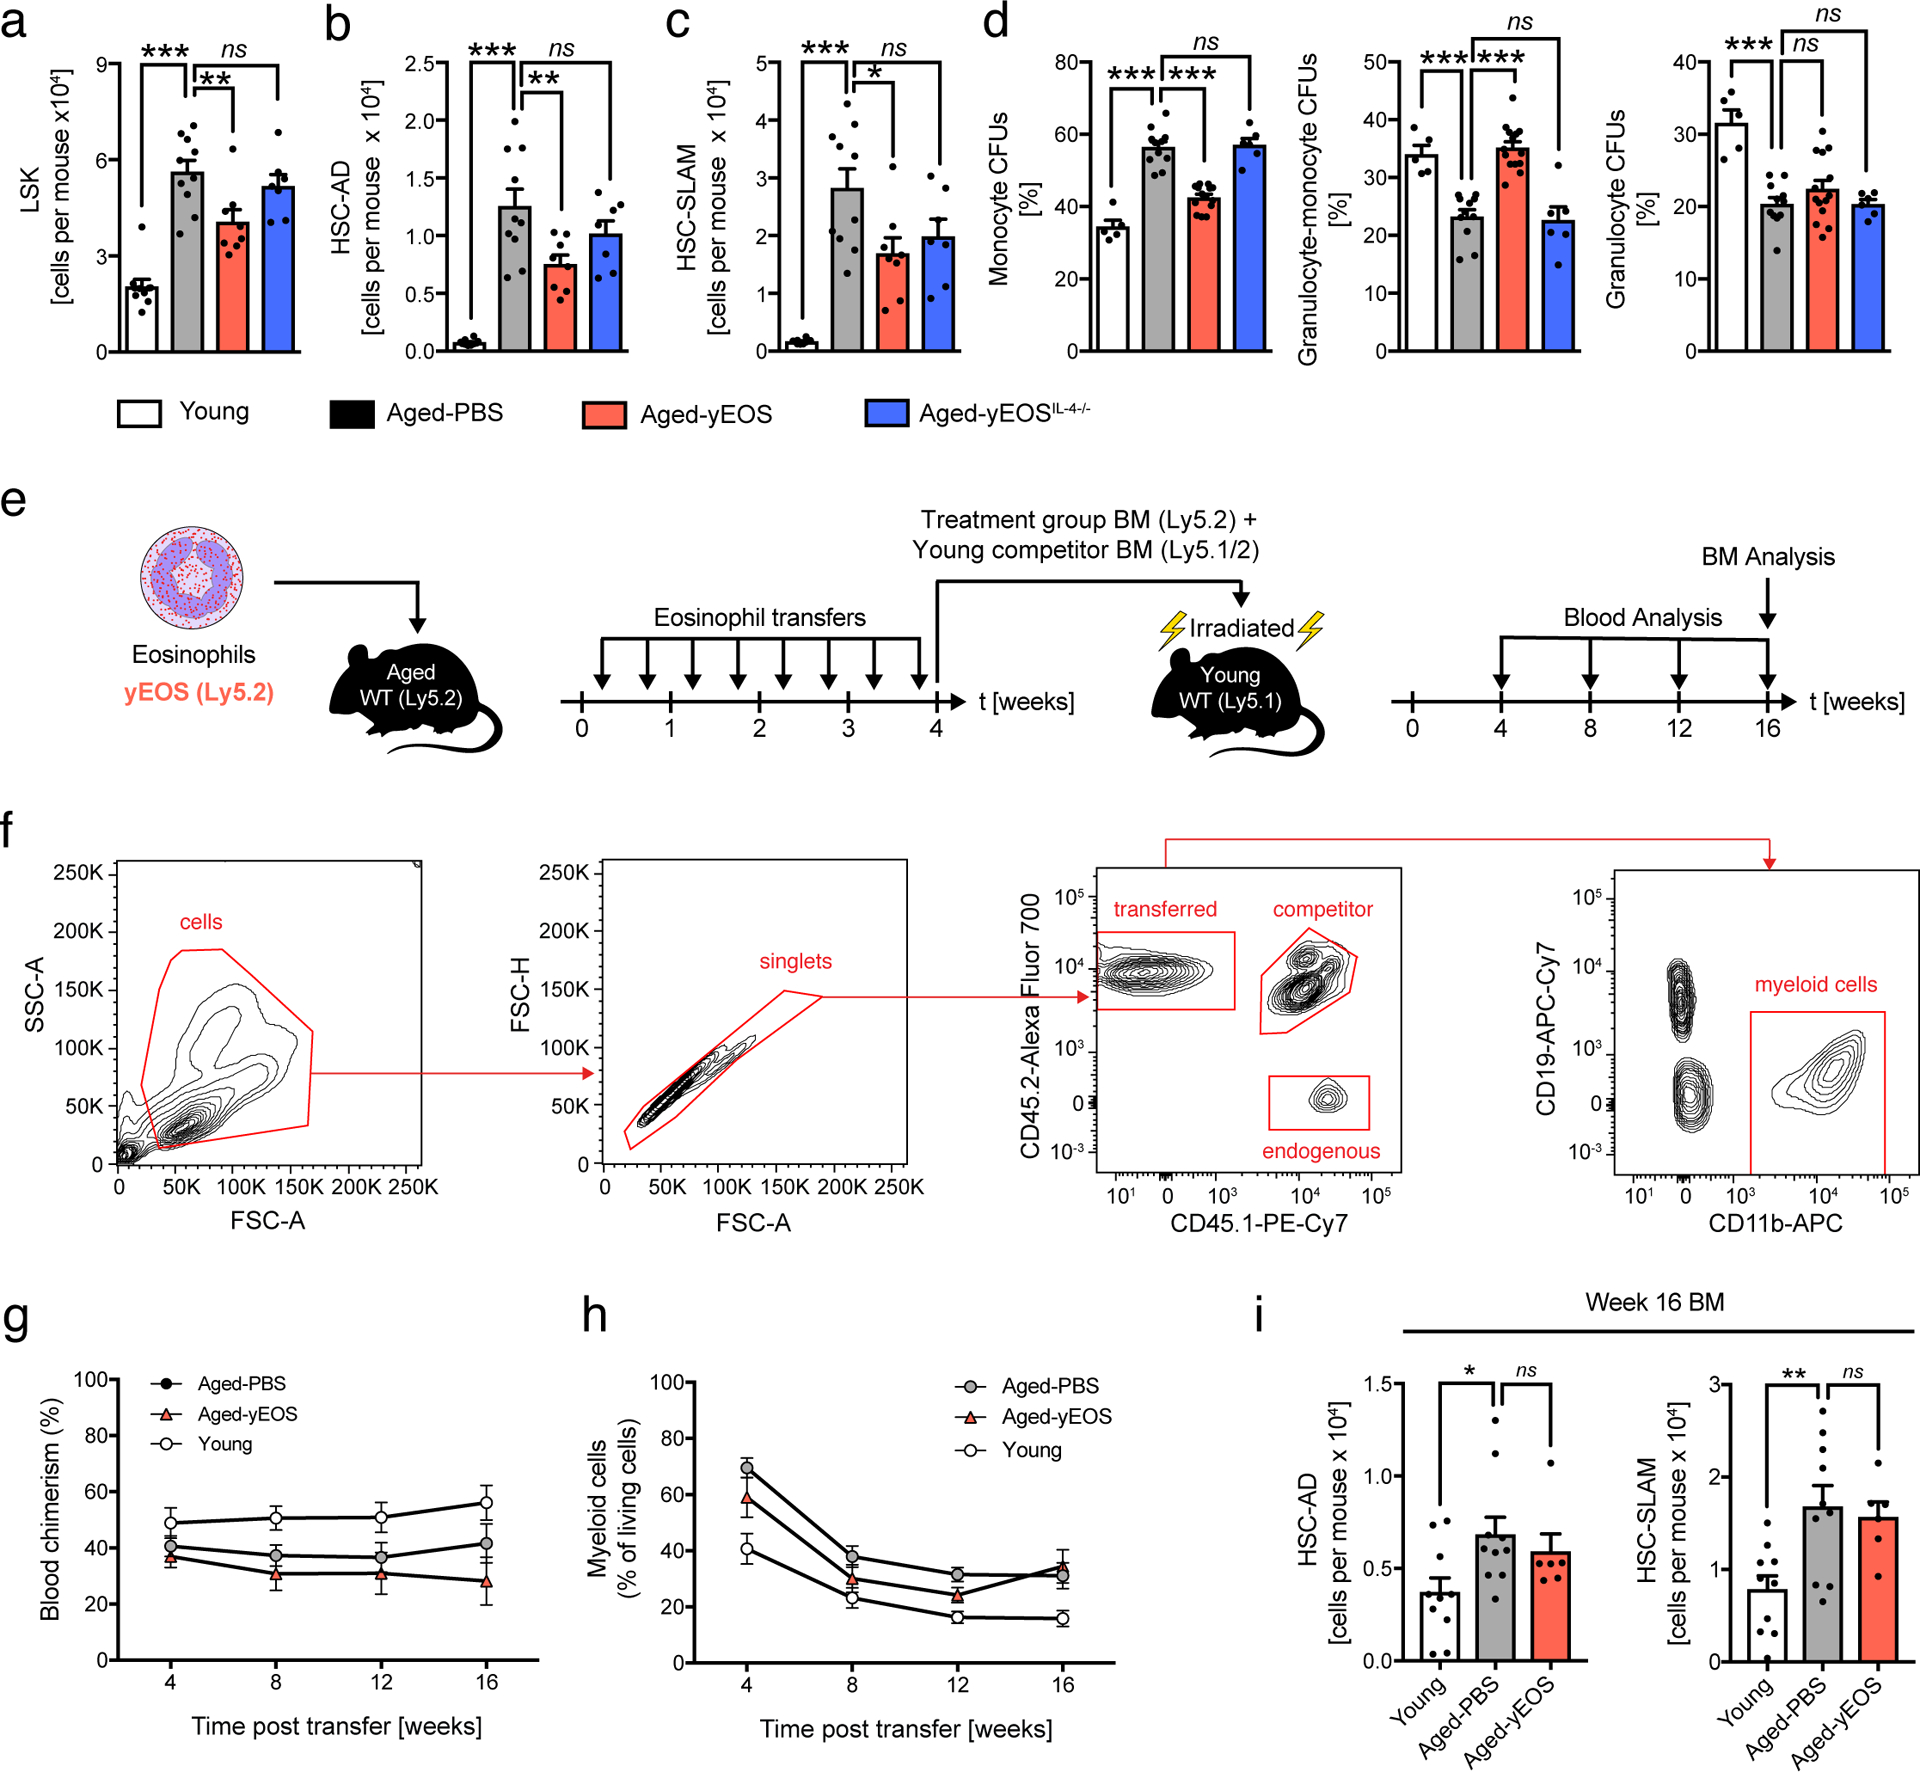
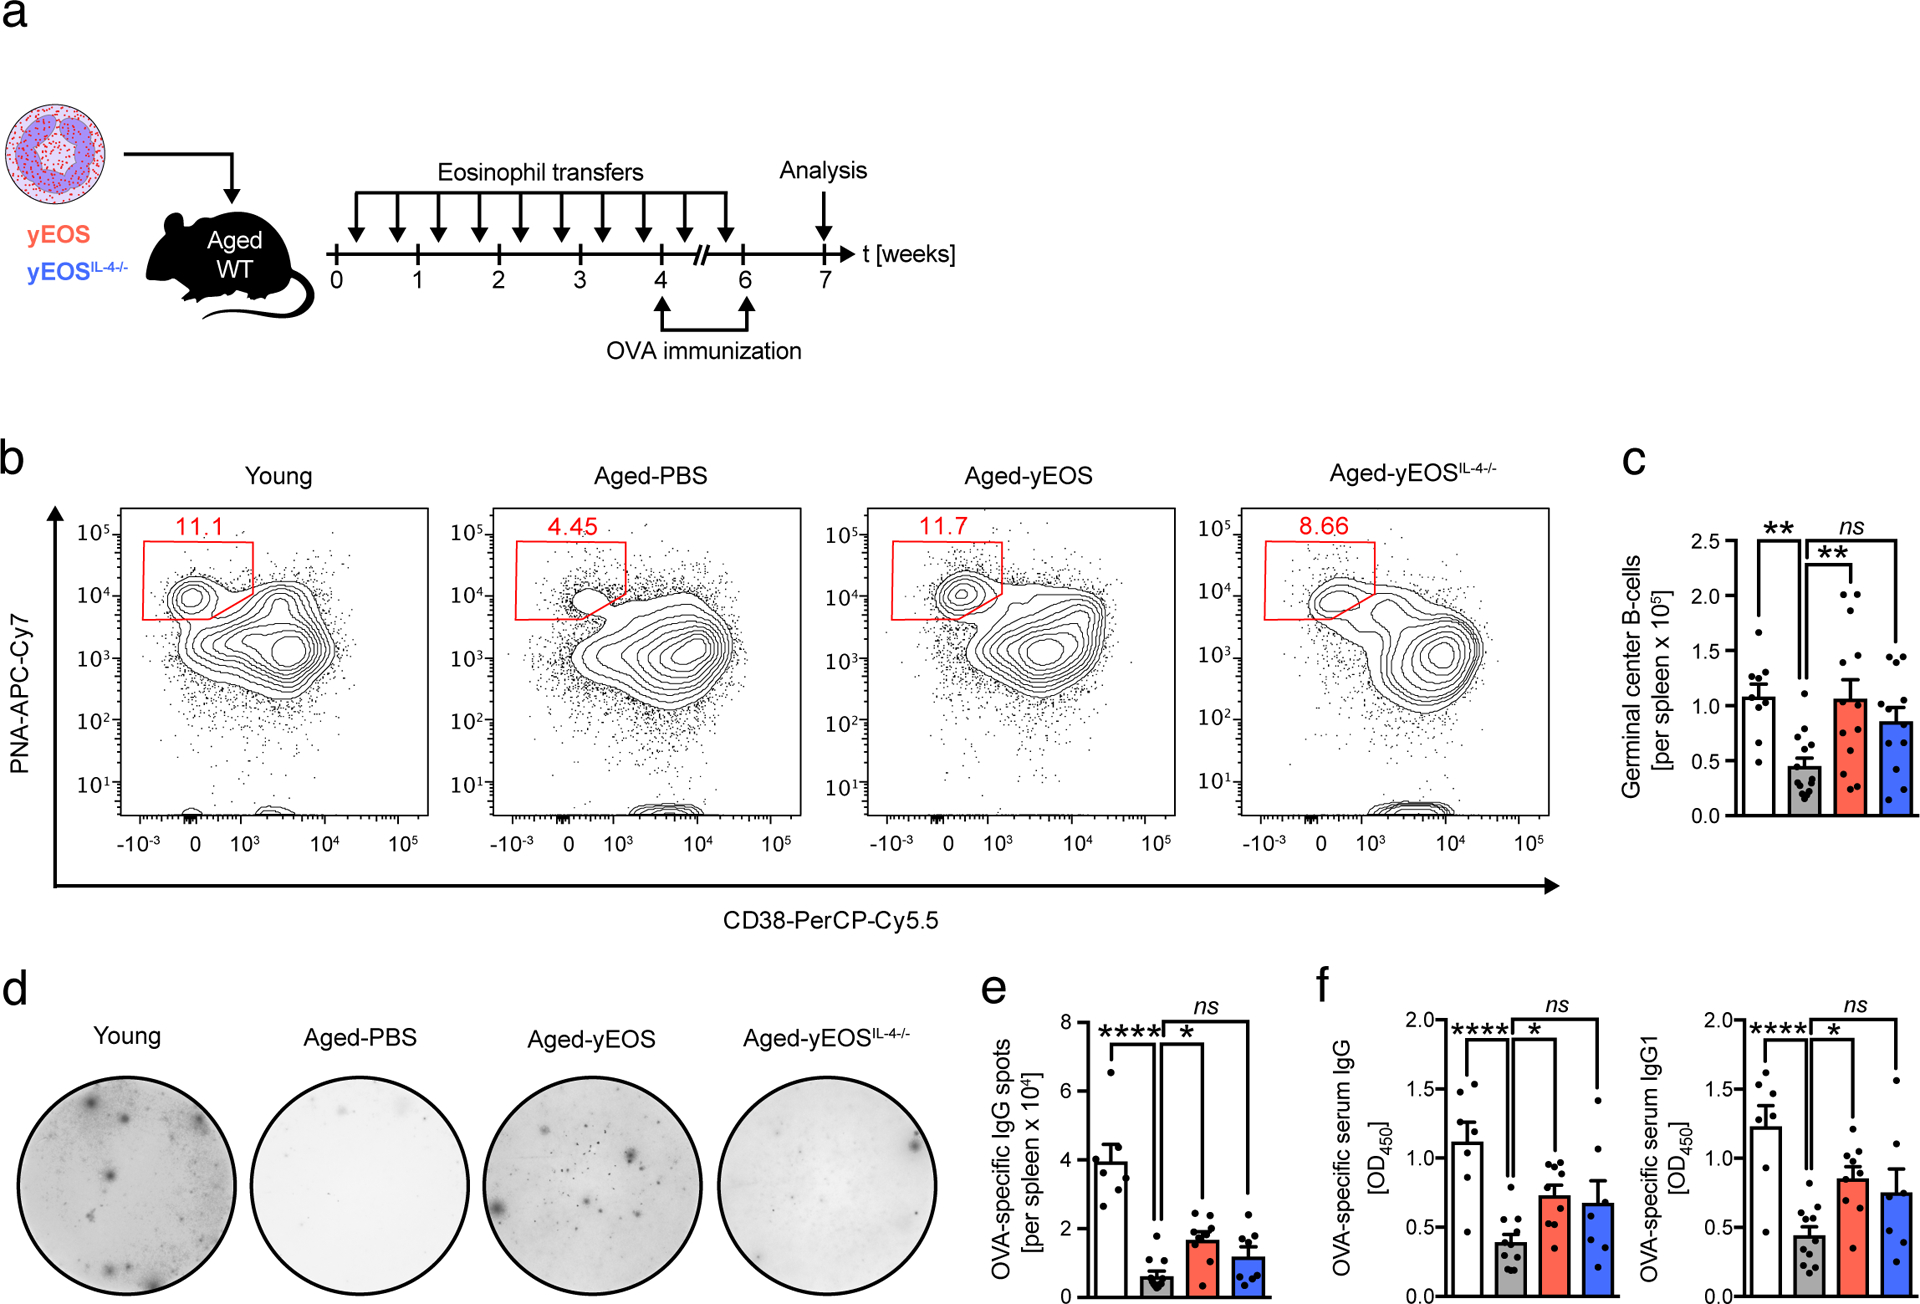
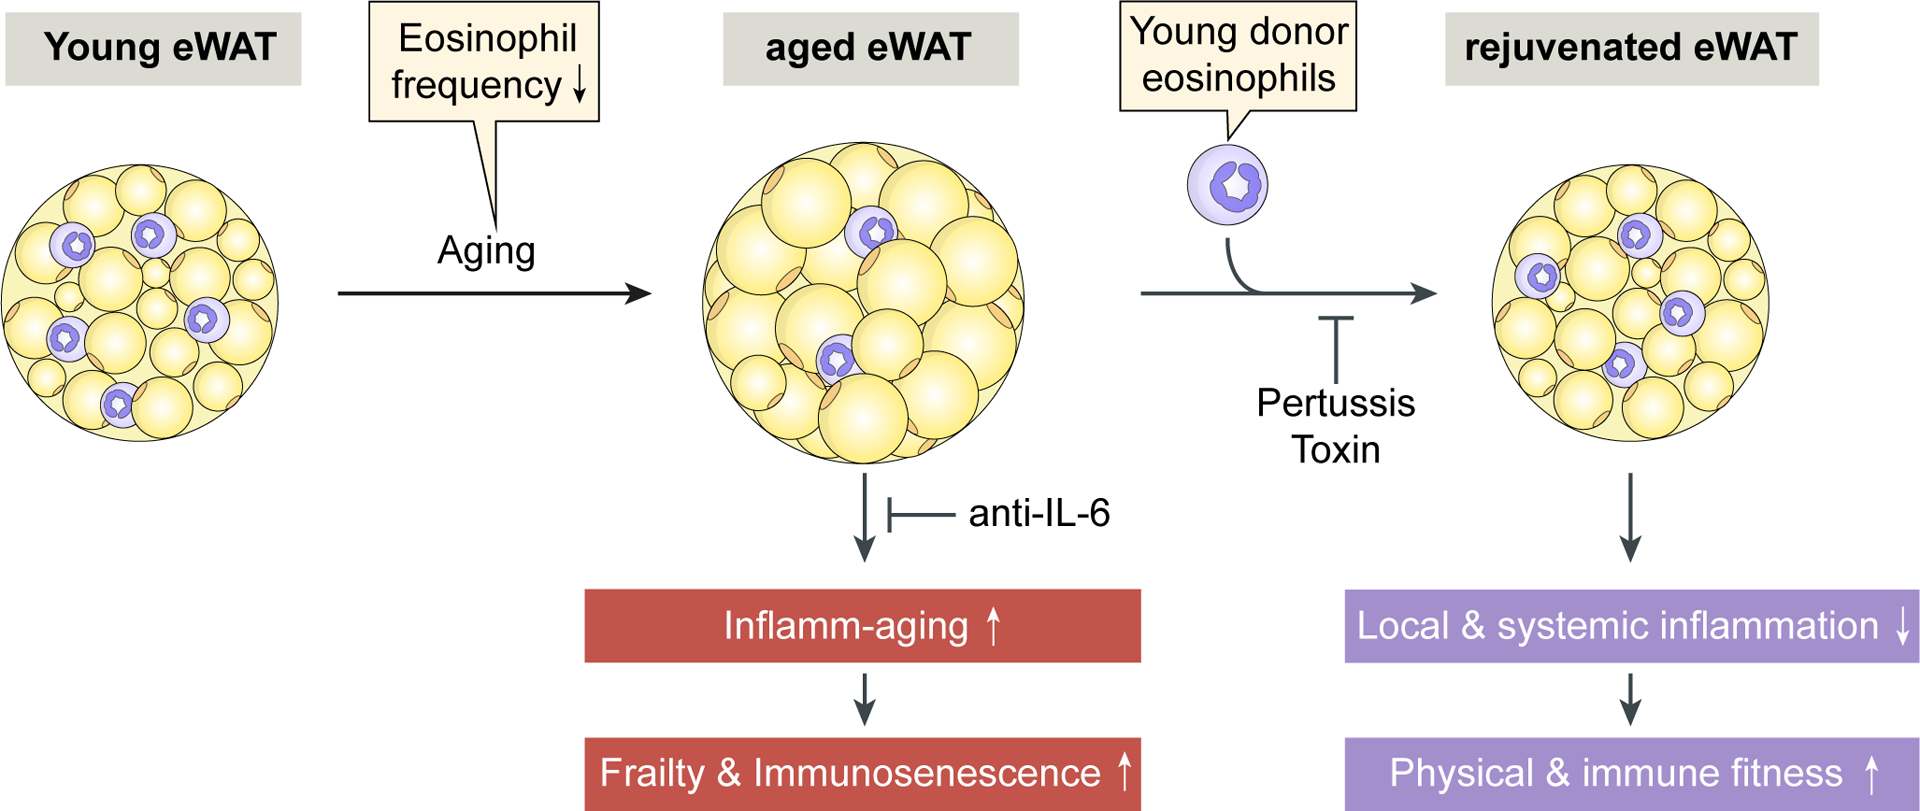
Adipose tissue eosinophils (ATEs) are important in the control of obesity-associated inflammation and metabolic disease. However, the way in which ageing impacts the regulatory role of ATEs remains unknown. Here, we show that ATEs undergo major age-related changes in distribution and function associated with impaired adipose tissue homeostasis and systemic low-grade inflammation in both humans and mice. We find that exposure to a young systemic environment partially restores ATE distribution in aged parabionts and reduces adipose tissue inflammation. Approaches to restore ATE distribution using adoptive transfer of eosinophils from young mice into aged recipients proved sufficient to dampen age-related local and systemic low-grade inflammation. Importantly, restoration of a youthful systemic milieu by means of eosinophil transfers resulted in systemic rejuvenation of the aged host, manifesting in improved physical and immune fitness that was partially mediated by eosinophil-derived IL-4. Together, these findings support a critical function of adipose tissue as a source of pro-ageing factors and uncover a new role of eosinophils in promoting healthy ageing by sustaining adipose tissue homeostasis.


Conflict of interest statement

Competing interests: The authors declare no competing interests.

Figures

Extended Data Fig. 1
Extended Data Fig. 1. Tissue screens for CCL11 and CCL2 protein expression in young and aged mice.
(a) Comparison of CCL11 and CCL2 protein expression in muscle, spleen, brain, kidney, thymus, liver, lung, skin, mesenteric lymph nodes (MLN), colon, subcutaneous WAT (scWAT) and epidydimal WAT (eWAT) of young (Y, 2–3 months) and aged mice (A, 18–20 months) as assessed by western blot. Tissues of three biologically independent animals were pooled. HSP90 served as loading control. Quantification of (b) CCL11 and (c) CCL2 protein levels normalized to HSP90 in indicated tissues of young (Y, 2–3 months) and aged mice (A, 18–20 months) by ImageJ. One out of two independently performed experiments is shown. (d) Comparison of CCL11 and CCL2 mRNA expression levels in indicated tissues of aged mice (18–20 months) as assessed by qPCR (n=4). (e) CCL2 and CCL11 protein levels were assessed by western blot (n=4). One out of 3 independently performed experiments is shown. (f) Quantification of CCL11 and CCL2 protein levels normalized to HSP90 in indicated tissues of young (Y, 2–3 months, n=4) and aged mice (A, 18–20 months, n=4). HSP90 served as loading control. Protein levels from total eWAT was calculated. Statistical significance was calculated by one-way ANOVA followed by two-tailed post-hoc Dunnett’s multiple comparison test against eWAT (d) or by unpaired two-tailed Student’s t test between young and aged samples (f). Data are shown as individual data points with mean ± SEM. *p < 0.05, **p < 0.01, ***p < 0.001. Uncropped western blots are provided in the Source Data File.
Extended Data Fig. 2
Extended Data Fig. 2. Gating strategies for human and mouse ATEs and age-related adipose tissue hypertrophy.
(a) Experimental protocol. (b) Frequencies of eosinophils, macrophages and calculated eosinophil:macrophage ratios in eWAT of Aged-PBS (n=8) and Aged-yNEU (n=9) mice. (c) mRNA expression levels for Tnfα, Il1β and IL6 in eWAT of Aged-PBS (n=8) and Aged-yNEU mice (n=9). Data are presented as fold induction over Aged-PBS controls. (d) Average time on Rotarod of Aged-PBS controls (n=8) and Aged-yNEU mice (n=9). (e) Total numbers of lin, Sca-1+, c-kit+ hematopoietic stem cells (LSKs) in Aged-PBS (n=4) and Aged-yNEU (n=4) mice. (f) Numbers of common myeloid progenitors (CMP), common lymphoid progenitors (CLP), and granulocyte/monocyte progenitors (GMP) in the bone marrow of Aged-PBS (n=4) and Aged-yNEU (n=4) mice. (g) Frequencies of neutrophils in eWAT of young (n=5), Aged-PBS (n=4) and Aged-yNeu (n=5) mice. (h) Experimental protocol of bone marrow derived eosinophil (BMDE) transfers. (i) Calculated ATE:ATM ratios in eWAT of Aged-PBS (n=5) and Aged-BMDE (n=4) mice as measured by flow cytometry. (j) IL-6 protein levels in eWAT of Aged-PBS (n=6) and Aged-BMDE (n=5) mice. (k) Pre- and post-treatment IL-6 plasma protein levels in Aged-PBS (n=6) and Aged-BMDE (n=5). (l) Intra-group and (m) inter-group comparison of pre- and post-treatment average time on wheel (Rotarod test) in Aged-PBS (n=6) and Aged-BMDE (n=5) mice. Delta in performances in (l) is calculated relative to baseline (post- minus pre-treatment results). Statistical significance was calculated by Wilcoxon matched pairs signed rank test (k, l), by unpaired two-tailed Student’s t test (b, c, d, e, f, I, j, m) or by one-way ANOVA followed by two-tailed post-hoc Dunnett’s multiple comparison test against the aged-PBS treated group (g). Data are pooled from two independently performed experiments (except for (g-m) only one experiment has been performed) and shown as individual data points with mean ± SEM. Data are shown as mean ± SEM. *p < 0.05, **p < 0.01.
Extended Data Fig. 3
Extended Data Fig. 3. Recruitment of sort-purified GFP+ eosinophils to WAT of aged mice.
Aged mice (18 months) were adoptively transferred with sort-purified GFP+ eosinophils derived from IL-5 transgenic mice on two subsequent days. The following day eosinophil recruitment into different tissues was assessed by flow cytometry. (a) Representative flow plots of transferred GFP+ and endogenous GFP tissue eosinophils in indicated tissues. (b) Frequencies of transferred GFP+ and endogenous GFP tissue eosinophils in indicated tissues. (c) Siglec-F surface expression on adipose tissue eosinophils from Young, Aged-PBS and Aged-yEOS -treated mice as assessed by flow cytometry. (d) Representative histograms of Siclec-F expression on ATEs of indicated groups. (e) Quantification of Siglec-F surface expression (MFI) on adipose tissue eosinophils of Young (n=5), Aged-PBS (n=5) and Aged-yEOS (n=4) mice. The experiment was done once. Statistical significance was calculated by one-way ANOVA followed by two-tailed post-hoc Dunnett’s multiple comparison test against the young group. ns = not significant. Data are representative of n=4 per group and are shown as mean ± SEM.
Extended Data Fig. 4
Extended Data Fig. 4. Transfer of neutrophils to aged mice does not alter WAT inflammation, hematopoetic stem cell pol or physical performance.
(a) Experimental protocol. (b) Frequencies of eosinophils, macrophages and calculated eosinophil:macrophage ratios in eWAT of Aged-PBS (n=8) and Aged-yNEU (n=9) mice. (c) mRNA expression levels for Tnfα, Il1β and IL6 in eWAT of Aged-PBS (n=8) and Aged-yNEU mice (n=9). Data are presented as fold induction over Aged-PBS controls. (d) Average time on Rotarod of Aged-PBS controls (n=8) and Aged-yNEU mice (n=9). (e) Total numbers of lin, Sca-1+, c-kit+ hematopoietic stem cells (LSKs) in Aged-PBS (n=4) and Aged-yNEU (n=4) mice. (f) Numbers of common myeloid progenitors (CMP), common lymphoid progenitors (CLP), and granulocyte/monocyte progenitors (GMP) in the bone marrow of Aged-PBS (n=4) and Aged-yNEU (n=4) mice. (g) Frequencies of neutrophils in eWAT of young (n=5), Aged-PBS (n=4) and Aged-yNeu (n=5) mice. (h) Experimental protocol of bone marrow derived eosinophil (BMDE) transfers. (i) Calculated ATE:ATM ratios in eWAT of Aged-PBS (n=5) and Aged-BMDE (n=4) mice as measured by flow cytometry. (j) IL-6 protein levels in eWAT of Aged-PBS (n=6) and Aged-BMDE (n=5) mice. (k) Pre- and post-treatment IL-6 plasma protein levels in Aged-PBS (n=6) and Aged-BMDE (n=5). (l) Intra-group and (m) inter-group comparison of pre- and post-treatment average time on wheel (Rotarod test) in Aged-PBS (n=6) and Aged-BMDE (n=5) mice. Delta in performances in (l) is calculated relative to baseline (post- minus pre-treatment results). Statistical significance was calculated by Wilcoxon matched pairs signed rank test (k, l), by unpaired two-tailed Student’s t test (b, c, d, e, f, I, j, m) or by one-way ANOVA followed by two-tailed post-hoc Dunnett’s multiple comparison test against the aged-PBS treated group (g). Data are pooled from two independently performed experiments (except for (g-m) only one experiment has been performed) and shown as individual data points with mean ± SEM. Data are shown as mean ± SEM. *p < 0.05, **p < 0.01.
Extended Data Fig. 5
Extended Data Fig. 5. Eosinophil transfers do not alter age-related changes in murine subcutaneous WAT.
(a) Gating strategy for ATMs and ATEs in scWAT of young (3 months) and aged (20 months) mice. (b) Calculated ATE:ATM ratio in scWAT of young (n=10), Aged-PBS (n=10), Aged-yEOS (n=6) and Aged-yEOSIL−4−/− (n=7) mice. (c) Representative photographs of H&E stained histological scWAT sections of indicated treatment groups. (d) Quantification of adipocyte hypertrophy in Young (n=11), Aged-PBS (n=10), Aged-yEOS (n=9) and Aged-yEOSIL−4−/− (n=12) mice by ImageJ. (e) IL-6 and CCL2 protein levels in scWAT of Young (n=15), Aged-PBS (n=14), Aged-yEOS (n=12) and Aged-yEOSIL−4−/− (n=13) mice. Statistical significance was calculated by one-way ANOVA followed by two-tailed post-hoc Dunnett’s multiple comparison test against the aged-PBS treated group. Data (e) are pooled from 2 independently performed experiments or performed once (a-d) and shown as individual data points with mean bars ± SEM. *p < 0.05, **p < 0.01, ***p < 0.001.
Extended Data Fig. 6
Extended Data Fig. 6. Surface expression of Siglec-F on WAT resident and transferred eosinophils and glucose metabolism in response to eosinophil transfers to aged mice.
(a) Blood glucose levels in Aged-PBS (20 months, n=4) and Aged-yEOS (n=5) mice in response to i.p. glucose challenge over time. (b) Calculated HOMA-IR for Aged-PBS (20 months, n=4) and Aged-yEOS (20 months, n=5) mice. Statistical significance was tested by unpaired two-tailed Student’s t-test. One out of 3 independently performed experiments is shown. Data are shown as individual data points with mean bars ± SEM. **p < 0.01.
Extended Data Fig. 7
Extended Data Fig. 7. Open field activity tests.
(a) Mean velocity, total distance, accumulative mobility- and immobility of Aged-PBS, Aged-yEOS and Aged-yNEU mice (n=4 per group). (b) Representative heat maps for Aged-PBS, Aged-yEOS and Aged-yNEU mice demonstrating the animal’s position in the arena. The experiment was done once. Statistical significance was calculated by one-way ANOVA followed by two-tailed post-hoc Dunnett’s multiple comparison test against the aged-PBS treated group. Data are shown as mean bars ± SEM. ns: not significant.
Extended Data Fig. 8
Extended Data Fig. 8. Transfer of young eosinophils is associated with alterations in muscle stem cell frequencies but not function.
(a) Gating strategy and representative flow plots of CD31, CD45, Sca-1, Vcam+ and integrin α7+ satellite cells in muscle of Young (n=13), Aged-PBS (n=17), Aged-yEOS, (n=17) and Aged-yEOSIL−4−/− (n=17) mice. (b) Quantification of muscle stem cell frequencies in indicated groups (c) Representative photographs of immunofluorescent stained sort-purified and differentiated satellite cells. (d) Quantification of cell colony formation of sort-purified muscle stem cells of Young (n=10), Aged-PBS (n=10), Aged-yEOS (n=8) and Aged-yEOSIL−4−/− (n=8) mice (e) Representative H&E stained longitudinal and cross-sectional quadriceps femoris in indicated groups. (f) Quantification of centrally nucleated myofibers in sections of Young (n=26), Aged-PBS (n=26), Aged-yEOS (n=18) and Aged-yEOSIL−4−/− (n=13) mice. (g) Muscle weight (femur) was measured in Young (n=5), Aged-PBS (n=9), Aged-yEOS (n=8) and Aged-yEOSIL−4−/− (n=7) mice. Data (a-f) are pooled from 2 independently performed experiments except for g (one experiment has been performed). Statistical significance was calculated by one-way ANOVA followed by two-tailed post-hoc Dunnett’s multiple comparison test against the aged-PBS treated group. Data are shown as individual data points with mean ± SEM. *p < 0.05, **p < 0.01, ***p < 0.001.
Extended Data Fig. 9
Extended Data Fig. 9. Eosinophil transfers reverse myeloid skewing in old age.
(a) Gating strategy for the identification of LSK, HSC-SLAM, HSC-AD, CMP, CLP and GMP populations. (b) Absolute numbers of CMP, CLP and GMP per mouse in Young (n=5), Aged-PBS (n=7) and Aged-yEOS (n=8) groups. (c) Absolute numbers of CMP, CLP and GMP per mouse in Aged-PBS (n=8) and Aged-yEOSIL−4−/− (n=10) groups. One out of two independently performed experiments is shown and data are shown as individual data points with mean ± SEM. Statistical significance in (b) was calculated one-way ANOVA followed by two-tailed post-hoc Dunnett’s multiple comparison test against the aged-PBS treated group and (c) by two-tailed Student’s t-test. (d) Gating strategy for the identification of germinal GCB. Data are shown as individual data points with mean ± SEM. *p < 0.05, **p < 0.01, ***p < 0.001.
Extended Data Fig. 10
Extended Data Fig. 10. Eosinophils adopt a senescent-like inflammatory phenotype with age.
(a) Heat map representing Ct values of p21, Vegfa, Il1b, Il6 and Tnfa in sort-purified, blood-derived eosinophils from aged WT (20 months), young WT (3 months) or young IL5 transgenic mice (3 months) as assessed by targeted fluidigm qPCR array. (b) Relative expression levels of Tnfa, Il1b, Il6, p21 and Vegfa in sort-purified, blood-derived eosinophils from aged WT (20 months), young WT (3 months) or young IL5 transgenic mice (3 months) as assessed by fluidigm qPCR array. Eosinophils from 3 animals were pooled for each measurement (n=3 per group). The experiment was done once. (c) Relative expression levels of TNFa, IL1b, IL6, p21 and VEGFA in human blood derived eosinophils from young (average age=34, n=8) and aged (average age=64, n=7) donors. Data in (b and c) are shown as individual data points with mean ± SEM and statistical significance was calculated by one-way ANOVA followed by two-tailed post-hoc Dunnett’s multiple comparison test against the young group (b) and two-tailed students t-test (c). *p < 0.05, **p < 0.01, ***p < 0.001. ND: not detectable.
Fig. 1.
Fig. 1.. Age-related changes in the plasma proteome of humans and mice.
Unsupervised clustering of different age groups (humans n=20 per group; mice n=10 per group) based on the levels of 67 human plasma factors (a) and 40 mouse plasma factors (b). Means of z-scored values were used for clustering and are displayed as color code ranging from blue (negative) to yellow (positive). Each factor is denominated with its official HUGO gene nomenclature. Red labels indicate factors that were detectable in both human and mouse cohorts. (c) Venn diagram representing plasma factors significantly correlating with age in humans (n=160 biologically independent donors) and mice (n=40). Sex-specific protein levels of (d) CCL11 and (e) CCL2 in human plasma (n=10 per group). (f) CCL11 and (g) CCL2 plasma levels in male and female mice (n=5 per group) of indicated age groups. Correlations between plasma factor level and age were calculated using Pearsons’r. Statistical significance was calculated by one-way ANOVA followed by two-tailed post-hoc Dunnett`s multiple comparison against the youngest group. Wherever possible, data are shown as individual data points with mean ± SEM. *p < 0.05, **p < 0.01, ***p < 0.001.
Fig. 2.
Fig. 2.. Age-related changes in innate immune cell distribution in WAT of human and mice.
(a) Representative image of H&E stained human omental adipose tissue. Arrows point to eosinophils. Scale bar: 40 μm. (b) Quantification of tissue-resident eosinophils in H&E stained sections of human omental adipose tissues (n=30 biologically independent human donors). (c) Representative images of major basic protein (MBP)-stained human omental adipose tissue. Arrows point towards MBP-positive eosinophils. One out of three independently performed experiments is shown. (d) Representative flow plots of MBP- and Siglec-8 positive eosinophils and (e) corresponding quantification of eosinophil frequencies in the stromal vascular cell (SVC) fraction of human omental adipose tissue (n=18 biologically independent human donors). (f) Fold induction of Tnfa, Il1β and Il6 mRNA expression levels in human omental adipose tissue (n=34 biologically independent human donors). (g) Representative images of major basic protein (MBP)-stained mouse epidydimal WAT. Arrows point towards MBP-positive eosinophils. Adipocytes are stained for perilipin (PLIN). One out of three independently performed experiments is shown. (h) Representative flow plots of adipose tissue macrophage ATM (F4/80+, SiglecF) and ATE (F4/80int, SiglecF+) populations in eWAT from young (3 months) and aged (20 months) mice. (i) Frequencies of eosinophils and macrophages and calculated eosinophil:macrophage ratio in eWAT of young and aged mice (n=9 per group). (j) Fold induction of Tnfa, Il1β and Il6 mRNA expression levels in eWAT of young (n=8) and aged mice (n=7). Data are presented as fold expression over aged mice and pooled from two independently performed experiments. Statistical significance was calculated by unpaired two-tailed Student’s t test (i, j) or the Pearson correlation coefficient between eosinophils and age (b, e) or fold gene expression levels and age (f) is given. Results are shown as individual data points with mean ± SEM. *p < 0.05, **p < 0.01, ***p < 0.001.
Fig. 3.
Fig. 3.. Heterochronic parabiosis restores ATE:ATM ratios and limits WAT inflammation
(a) Experimental protocol. (b) Representative flow plots of ATE (F4/80int, SiglecF+) and ATM (F4/80+, SiglecF) populations in eWAT of iso- and heterochronic parabionts. (c) Frequencies of ATEs and ATMs and the calculated ATE:ATM ratios from two independently performed and pooled experiments in eWAT of parabiosed mice (young isochronic, n=10; young heterochronic, n=8; old heterochronic, n=8; old isochronic, n=12). (d) mRNA expression levels for Il6, Ccl2 (young isochronic, n=7; young heterochronic, n=5; old heterochronic, n=5; old isochronic, n=6) and Il1β (young isochronic, n=6; young heterochronic, n=5; old heterochronic, n=5; old isochronic, n=6), in eWAT of parabiosed mice. Data are presented as fold expression over old isochronic controls and pooled from two independently performed experiments. (e) Experimental protocol. Isochronic and heterochronic parabiosis was performed by joining young (2–3 months) GFP-reporter mice (GFP) to either young (2–3 months) or aged (18 months) wild-type C57BL/6 mice. (f) Representative flow plots of GFP+ and GFP eosinophils in WAT of isochronic or heterochronic parabionts. (g) Percentages of GFP+ and GFP eosinophils in WAT of Young GFP Iso (n=5), Young GFP Het (n=5), Young WT Iso (n=5), and Aged WT Het mice (n=5). The experiment was done once. Statistical significance was calculated by one-way ANOVA followed by two-tailed post-hoc Dunnett’s multiple comparison test against the aged isochronic group (c,d). Wherever possible, data are shown as individual data points with mean ± SEM. *p < 0.05, **p < 0.01, ***p < 0.001.
Figure 4.
Figure 4.. Transfer of eosinophils from young donors reverse aging signatures in WAT and limits systemic inflammation.
Aged mice (18 months) were adoptively transferred with sort-purified GFP+ eosinophils on two subsequent days. The following day eosinophil recruitment into different tissues was assessed by flow cytometry. (a) Representative flow plots of transferred GFP+ and resident GFP eosinophils in indicated tissues. (b) Number of GFP+ and GFP resident eosinophils in indicated tissues. Data are representative of n=4 per group. One out of two independently performed experiments is shown. (c) Experimental protocol. (d) Frequencies of ATEs and ATMs and the calculated ATE:ATM ratios in eWAT of young (n=19), Aged-PBS (n=23), Aged-yEOS (n=13) and Aged-yEOSIL−4−/− (n=13) mice. (e) Protein levels in eWAT of young (n=24), Aged-PBS (n=26), Aged-yEOS (n=18) and Aged-yEOSIL−4−/− (n=16) mice. (f) Plasma protein levels for IL-6 and IL-1β in young (n=20), Aged-PBS (n=35), Aged-yEOS (n=32) and Aged-yEOSIL−4−/− (n=14) mice and CCL2 plasma protein levels in young (n=26), Aged-PBS (n=37), Aged-yEOS (n=22) and Aged-yEOSIL−4−/− (n=7) mice. Statistical significance was calculated by one-way ANOVA followed by two-tailed post-hoc Dunnett’s multiple comparison test against the Aged-PBS group (d, e, f) and wherever possible, results are shown as individual data points with mean bars ± SEM. *p < 0.05, **p < 0.01, ***p < 0.001.
Figure 5.
Figure 5.. Eosinophils from young donors improve physical fitness in aged hosts.
(a) Schematic grip strength test. (b) Age-related changes in physical performance in young (3 months, n=24) and aged mice (20 months, n=35). (c) Intra- and (d) inter-group comparisons of maximal force (grip strength) of young (n=15), Aged-PBS (n=18), Aged-yEOS (n=13) and Aged-yEOSIL−4−/− (n=12) mice. Pooled data from two independently performed experiments are shown. (e) Schematic of Rotarod test. (f) Age-related changes in physical performance in young (3 months, n=25) and aged mice (20 months, n=35). (g) Intra- and (h) inter-group comparison of average time on wheel (Rotarod test) of young (n=5), Aged-PBS (n=8), Aged-yEOS (n=5) and Aged-yEOSIL−4−/− (n=5) mice. The experiment (g, h) was done once. Delta in performances in (d) and (h) are calculated relative to baseline (post- minus pre-treatment results). Statistical significance was calculated by unpaired two-tailed Student’s t test (b, f,), Wilcoxon matched pairs signed rank test (c, g) or one-way ANOVA followed by two-tailed post-hoc Dunnett’s multiple comparison test against the aged-PBS treated group (d, h). Data are shown as individual data points with mean bars ± SEM. *p < 0.05, **p < 0.01, ***p < 0.001.
Fig. 6.
Fig. 6.. Eosinophil homing to WAT lowers age-related adipose tissue inflammation and improves physical fitness in aged recipients.
(a) Experimental protocol. (b) Number of CSFE-labeled eosinophils in eWAT of control treated Aged-yEOS (n=4) and PT pre-treated Aged-yEOSPT mice (n=5) as measured by flow cytometry. One out of two independently performed experiments is shown. (c) Experimental protocol. (d) eWAT IL-6 protein levels in Aged-PBS (n=10) and Aged-yEOSPT (n=10) mice. (e) Intra- and inter-group (f) comparison of average time on wheel (Rotarod test) of Aged-yEOS (n=10) and Aged-yEOSPT (n=10) mice. (g) Intra- and inter-group (h) comparison of maximal force (grip strength) of Aged-yEos (n=10) and Aged-yEOSPT (n=10) mice. Delta in performances for (f) and (h) were calculated relative to baseline (post- minus pre-treatment results). The experiment (c-h) was done once. (i) Experimental protocol. (j) IL-6 plasma levels relative to baseline (pre-treatment) in Aged-ISO (n=16) and Aged-aIL6 (n=15) mice. (k) Intra- and inter-group (l) comparison of average time on wheel (Rotarod test) of Aged-PBS (n=16) and Aged-aIL6 (n=15) mice. (m) Intra- and inter-group (n) comparison of maximal force (grip strength) of Aged-PBS (n=16) and Aged-aIL6 (n=15) mice. Delta in performance was calculated relative to baseline (post- minus pre-treatment results). Data (i-n) are pooled from two independently performed experiments. Statistical significance was calculated by Wilcoxon matched pairs signed rank test (e, g, k, m) or by unpaired two-tailed Student’s t test (b, d, f, h, j, l, n) and data are shown as individual data points with mean ± SEM. ns: not significant, *p < 0.05, **p < 0.01, ***p < 0.001.
Fig. 7.
Fig. 7.. Transfer of eosinophils into aged mice transiently alters hematopoietic stem cell numbers and age-related myeloid skewing
(a) Absolute numbers of Lin, Sca-1+, c-kit+ hematopoietic stem cells (LSKs) in young (n=10), Aged-PBS (n=10), Aged-yEOS (n=8) and Aged-yEOSIL−4−/− (n=7) mice. Quantification of HSCs using CD34 and FLT3 (b) or SLAM markers (c) in indicated groups. (d) Quantification of the percentage of monocyte colony phenotypes in plated Lin BM methylcellulose cultures of young (n=5), Aged-PBS (n=11), Aged-yEOS (n=14) and Aged-yEOSIL−4−/− (n=6) mice. Data (a-d) are pooled from two independently performed experiments (e) Model of transplantation (f) Representative gating strategy to discriminate peripheral blood donor from competitor and endogenous myeloid cells. (g) Blood chimerism of Young (n=10), Aged-PBS (n=10) and Aged-yEOS mice (n=6) mice. (h) Frequencies of blood myeloid cells of Young (n=10), Aged-PBS (n=10) and Aged-yEOS mice (n=6) mice at indicated timepoints. (i) Absolute numbers of HSC-AD and HSC-SLAM cells in Young (n=10), Aged-PBS (n=10) and Aged-yEOS mice (n=6) mice 16 weeks post bone marrow transplant. The experiment (f-i) was done once. Statistical significance was calculated by one-way ANOVA followed by two-tailed post-hoc Dunnett’s multiple comparison test against the aged-PBS treated group. Data are shown as individual data points with mean ± SEM. *p < 0.05, **p < 0.01, ***p < 0.001.
Fig. 8.
Fig. 8.. Transfer of eosinophils into aged mice is associated with improved immunological fitness.
(a) Immunization protocol. (b) Representative flow plots of germinal center B cell (PNA+, CD38) populations in spleens of indicated groups. (c) Total numbers of germinal center B cells in young (n=9), Aged-PBS (n=14), Aged-yEOS (n=13) and Aged-yEOSIL−4−/− (n=12) mice. (d) Representative photographs and (e) quantification of OVA-specific IgG immunospots derived from splenocyte cultures of young (n=7), Aged-PBS (n=11), Aged-yEOS (n=9) and Aged-yEOSIL−4−/− (n=7) mice. (f) Quantification of OVA-specific serum IgG and IgG1 of young (n=7), Aged-PBS (n=11), Aged-yEOS (n=9) and Aged-yEOSIL−4−/− (n=7) mice. Data (b-f) are pooled from two independently performed experiments. Statistical significance was calculated by one-way ANOVA followed by two-tailed post-hoc Dunnett’s multiple comparison test against the aged-PBS treated group. Data are shown as individual data points with mean ± SEM. *p < 0.05, **p < 0.01, ***p < 0.001.
Fig 9.
Fig 9.. Schematic representation illustrating the rejuvenating potential of young donor eosinophils in aged hosts.
The age-related decrease of eosinophil frequency in epidydimal white adipose tissue (eWAT) is associate with the occurrence of inflamm-aging, frailty and immunosenescence. Our study demonstrates that these aging phenotypes are reversible upon young donor eosinophil transfers which dampen local and systemic inflammation leading to improved physical and immune fitness. The observed rejuvenation of the aged host upon young donor eosinophil transfers is dependent on their migration into eWAT since pertussis toxin treatment of the cells abrogates these effects. Systemic blocking of IL-6 only partially phenocopies physical improvements observed upon transfer of eosinophils.

References

    1. Palmer AK & Kirkland JL Aging and adipose tissue: potential interventions for diabetes and regenerative medicine. Exp Gerontol 86, 97–105 (2016). - PMC - PubMed
    1. Barzilai N, Banerjee S, Hawkins M, Chen W & Rossetti L Caloric restriction reverses hepatic insulin resistance in aging rats by decreasing visceral fat. J Clin Invest 101, 1353–1361 (1998). - PMC - PubMed
    1. Finkel T The metabolic regulation of aging. Nat Med 21, 1416–1423 (2015). - PubMed
    1. López-Otín C, Galluzzi L, Freije JMP, Madeo F & Kroemer G Metabolic Control of Longevity. Cell 166, 802–821 (2016). - PubMed
    1. Gabriely I et al. Removal of visceral fat prevents insulin resistance and glucose intolerance of aging: an adipokine-mediated process? Diabetes 51, 2951–2958 (2002). - PubMed

Publication types

MeSH terms