. 2020 Jun 30:14:615.
doi: 10.3389/fnins.2020.00615. eCollection 2020.

Investigation of Electrically Evoked Auditory Brainstem Responses to Multi-Pulse Stimulation of High Frequency in Cochlear Implant Users

Affiliations

Investigation of Electrically Evoked Auditory Brainstem Responses to Multi-Pulse Stimulation of High Frequency in Cochlear Implant Users

Ali Saeedi et al. Front Neurosci. .

Abstract

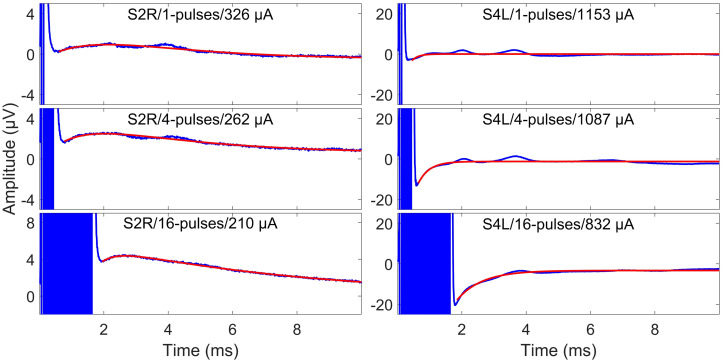
We investigated the effects of electric multi-pulse stimulation on electrically evoked auditory brainstem responses (eABRs). Multi-pulses with a high burst rate of 10,000 pps were assembled from pulses of 45-μs phase duration. Conditions of 1, 2, 4, 8, and 16 pulses were investigated. Psychophysical thresholds (THRs) and most comfortable levels (MCLs) in multi-pulse conditions were measured. Psychophysical temporal integration functions (slopes of THRs/MCLs as a function of number of pulses) were -1.30 and -0.93 dB/doubling of the number of pulses, which correspond to the doubling of pulse duration. A total of 15 eABR conditions with different numbers of pulses and amplitudes were measured. The morphology of eABRs to multi-pulse stimuli did not differ from those to conventional single pulses. eABR wave eV amplitudes and latencies were analyzed extensively. At a fixed stimulation amplitude, an increasing number of pulses caused increasing wave eV amplitudes up to a certain, subject-dependent number of pulses. Then, amplitudes either saturated or even decreased. This contradicted the conventional amplitude growth functions and also contradicted psychophysical results. We showed that destructive interference could be a possible reason for such a finding, where peaks and troughs of responses to the first pulses were suppressed by those of successive pulses in the train. This study provides data on psychophysical THRs and MCLs and corresponding eABR responses for stimulation with single-pulse and multi-pulse stimuli with increasing duration. Therefore, it provides insights how pulse trains integrate at the level of the brainstem.

Keywords: brainstem response; cochlear implants; multi-pulse stimulation; temporal integration; threshold.


Figures

FIGURE 1
FIGURE 1
Shape of multi-pulse stimuli used in the study.
FIGURE 2
FIGURE 2
Setup for electrical stimulation via CI and eABR recording.
FIGURE 3
FIGURE 3
eABR multi-pulse measurement conditions (n.m. means not measured).
FIGURE 4
FIGURE 4
Surface electrode recordings (blue curves) and exponential fittings of stimulation artifacts (only after stimulation, red curves). The left column shows two-exponential fittings, and the right panels show one-exponential fittings. In each panel, the number of pulses and the stimulation amplitude are indicated. Note that the stimulation artifact exceeds the range displayed in the figure.
FIGURE 5
FIGURE 5
Exemplary final eABRs for three subjects (columns) in multi-pulse conditions (rows). The stimulation amplitudes and the number of pulses are indicated in each panel. Significant peaks and troughs of eIII are marked with filled black and red diamonds, respectively. Peaks and troughs of eV are shown with filled black and red circles, respectively. Horizontal red lines indicate ± 2σ^RN. The minimum number of epochs used for averaging (min N) is indicated for each subject.
FIGURE 6
FIGURE 6
(A) Psychophysical THR and MCL currents (in dB re 1 μA) and (B) total burst charge (TBC) (dB re 1 nC) for 14 subjects (19 ears). Values differed significantly between all conditions (p < 0.05).
FIGURE 7
FIGURE 7
eABR wave eV amplitudes corresponding to the 15 measurement conditions mentioned in Figure 2. Curves with specific colors represent responses to stimuli with fixed stimulation amplitude and varying numbers of pulses. Error bars indicate ± 2σ^RN.
FIGURE 8
FIGURE 8
eABR wave eV latencies corresponding to the 15 measurement conditions mentioned in Figure 2. Curves with specific colors represent responses to stimuli with fixed stimulation amplitude and varying numbers of pulses.
FIGURE 9
FIGURE 9
eABR eV amplitudes of multi-pulse conditions over all subjects. In each panel, the stimulation amplitude is constant [MSA2, MSA4, MSA8, MSA16 in panels (A–D), respectively]. Data from individual subjects are plotted in gray circles and their corresponding median values in colors, which match the colors in Figure 7. In each panel, data were normalized to (divided by) the corresponding responses at the largest number of pulses [2, 4, 8, and 16 pulses in panels (A–D), respectively]. Data of the MSA1 condition (blue points in Figure 7) are not plotted, as all were 1 due to normalization. The asterisk shows pairs with significant difference.
FIGURE 10
FIGURE 10
eABR eV latencies of multi-pulse conditions over all subjects. In each panel, the stimulation amplitude is constant [MSA2, MSA4, MSA8, MSA16 in panels (A–D), respectively]. Data from individual subjects are plotted in gray circles and their corresponding median values in colors, which match the colors in Figure 7. Data of the MSA1 condition (blue points in Figure 7) are not plotted, as all were 0 due to normalization. The asterisk shows pairs with significant difference.
FIGURE 11
FIGURE 11
Wave eV amplitude growth functions (A) and latency functions (B) as a function of stimulation amplitude in all MP conditions for 8 ears (last column of Table 1). The amplitude data was normalized to the largest valid wave eV amplitudes in the 1-pulse condition for each ear. Results from individual subjects are plotted in open gray circles, while the corresponding median values are plotted in filled black circles.
FIGURE 12
FIGURE 12
eABRs to individual pulses and groups of pulses in the 16-pulse condition for subject S8L. Note the peaks and troughs of responses to successive pulses and groups of pulses, which suppress the response to the first pulse (eABR1p). This destructive interference effect may explain the decrease in the eV amplitude in multi-pulse conditions.
FIGURE 13
FIGURE 13
Comparison of psychophysical and eABR results. eABR wave eV amplitude at MSAs (95% of psychophysical MCLs) (A) and corresponding stimulation TBCs led to psychophysical MCLs (B). All data are normalized to their corresponding values at the 16-pulse condition. The “n.s.” in red in panel (A) shows not significant differences between 1 pulse and 2 pulses and between 4 pulses and 8 pulses. The difference between the rest of the pairs was significant. In panel (B), all pairs were significantly different.

References

    1. Abbas P. J., Brown C. J. (1991). Electrically evoked auditory brainstem response: refractory properties and strength-duration functions. Hear. Res. 51 139–147. 10.1016/0378-5955(91)90012-x - DOI - PubMed
    1. Bahmer A., Baumann U. (2012). Application of triphasic pulses with adjustable phase amplitude ratio (PAR) for cochlear ECAP recording: II. Recovery functions. J. Neurosci. Methods 205 212–220. 10.1016/j.jneumeth.2011.12.006 - DOI - PubMed
    1. Bahmer A., Peter O., Baumann U. (2008). Recording of electrically evoked auditory brainstem responses (E-ABR) with an integrated stimulus generator in Matlab. J. Neurosci. Methods 173 306–314. 10.1016/j.jneumeth.2008.06.012 - DOI - PubMed
    1. Bahmer A., Polak M., Baumann U. (2010). Recording of electrically evoked auditory brainstem responses after electrical stimulation with biphasic, triphasic and precision triphasic pulses. Hear. Res. 259 75–85. 10.1016/j.heares.2009.10.003 - DOI - PubMed
    1. Bai S., Encke J., Obando-Leitón M., Weiß R., Schäfer F., Eberharter J., et al. (2019). Electrical stimulation in the human cochlea: a computational study based on high-resolution micro-CT scans. Front. Neurosci. 13:1312. 10.3389/fnins.2019.01312 - DOI - PMC - PubMed