

Review
doi: 10.3389/fgene.2020.00654.
eCollection 2020.
Gene Set Analysis: Challenges, Opportunities, and Future Research
Affiliations
- PMID: 32695141
- PMCID: PMC7339292
- DOI: 10.3389/fgene.2020.00654
Item in Clipboard
Review
Gene Set Analysis: Challenges, Opportunities, and Future Research
Front Genet.
.
Abstract
Gene set analysis methods are widely used to provide insight into high-throughput gene expression data. There are many gene set analysis methods available. These methods rely on various assumptions and have different requirements, strengths and weaknesses. In this paper, we classify gene set analysis methods based on their components, describe the underlying requirements and assumptions for each class, and provide directions for future research in developing and evaluating gene set analysis methods.
Keywords: gene expression; gene set analysis; gene set database; gene set enrichment; sensitivity; specificity.
Copyright © 2020 Maleki, Ovens, Hogan and Kusalik.
Figures
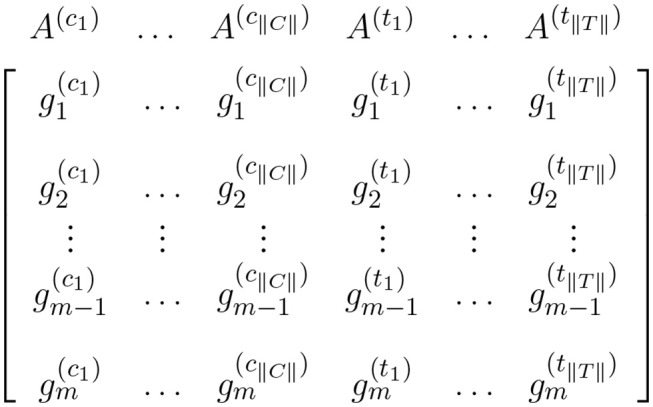
Expression matrix for a pairwise comparison where columns represent control samples and columns represent case samples. In this figure, and represent the expression measures for the ith gene in the control sample and case sample, respectively.
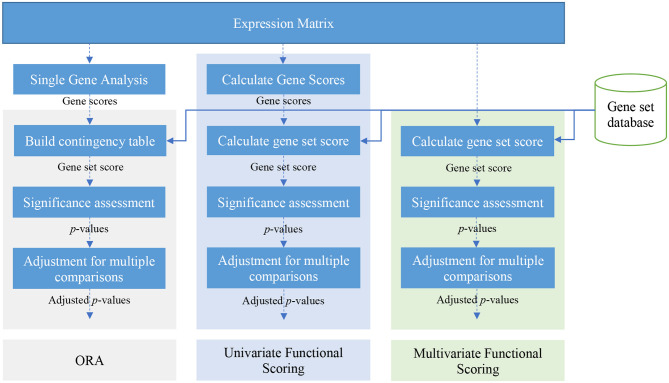
A schematic view of over-representation analysis (ORA) and univariate and multivariate FCS methods.
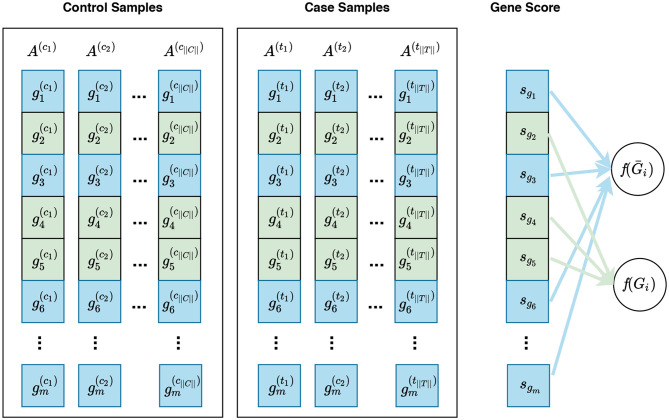
Visualization of gene sampling under the competitive null hypothesis. In this figure, and represent the expression measures for the ith gene in the control sample and case sample, respectively. A competitive null hypothesis states that there is no difference between the expression patterns of genes in a given gene set in comparison to that of the rest of the genes. For example, given a gene set Gi consisting of three genes Gi = {g2, g4, g5}, depicted in green, the competitive null hypothesis states that there is no difference in the expression pattern of these genes compared to that of the rest of genes, i.e., g1, g3, g6, … , gm—denoted as Ḡi and depicted in blue. In univariate methods, for each gene gi, a gene score sgi is calculated using the expression measures for gi across control and case samples. Then a gene set score f(Gi)—which is representative of the difference in the expression pattern of genes in Gi in control samples vs. case samples—is calculated using the gene scores of genes in Gi. Often a gene sampling approach is used for the significance assessment of the gene set score f(Gi). In a multivariate setting, the intermediate step of summarizing expression values for each gene to a gene score sgi is omitted, and f(Gi) is directly calculated from the expression values of genes in Gi.
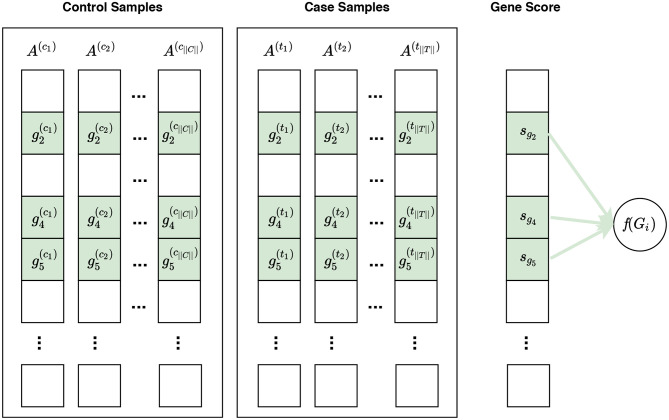
Visualization of phenotype permutation under the self-contained null hypothesis. In this figure, and represent the expression measures for the ith gene in the control sample and case sample, respectively. The self-contained null hypothesis states that the expression pattern of genes within a gene set does not differ between case and control samples. For example, given a gene set Gi consisting of three genes Gi = {g2, g4, g5}, the self-contained null hypothesis states that there is no difference in the expression pattern of these genes in control samples vs. case samples. It should be noted that the self-contained null hypothesis does not concern the rest of genes, i.e., genes not in Gi, which are shown in white here. In univariate methods, for each gene gi, a gene score sgi is calculated using the expression measures for gi across control and case samples. A gene set score f(Gi)—which is representative of the difference in the expression pattern of genes in Gi in control samples vs. case samples—is calculated using the gene scores of genes in Gi. Often a phenotype permutation approach is used for significance assessment of the gene set score f(Gi). In a multivariate setting, the intermediate step of summarizing expression values for each gene to a gene score sgi is omitted, and f(Gi) is directly calculated from the expression values of genes in Gi.
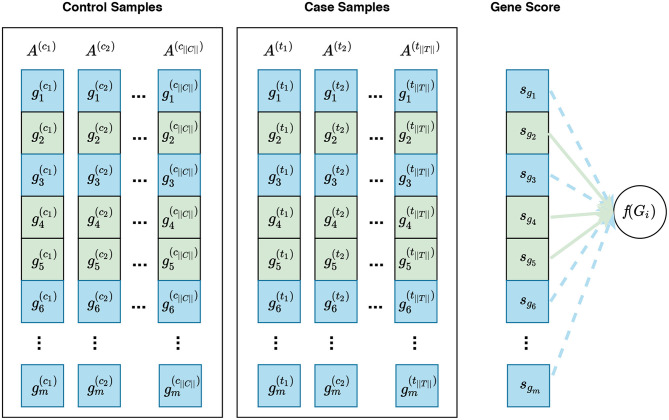
Visualization of phenotype permutation under the self-contained hybrid null hypothesis. This type of hypothesis states that the relative expression pattern of genes within a gene set is not differentially associated with phenotypes. For example, given a gene set Gi consisting of three genes Gi = {g2, g4, g5}, the hybrid null hypothesis states that there is no difference in the relative expression pattern of these genes between phenotypes. In this figure, sgi represents the gene score for the gene gi. Unlike the sample permutation approach used under a self-contained null hypothesis, not only do gene scores for genes in Gi contribute to the calculation of f(Gi) but also gene scores for genes in Ḡi can contribute to this calculation. For example, the distribution of gene scores for genes in Ḡi can affect the enrichment score of Gi calculated by GSEA. The contribution of genes in Gi and genes in Ḡi are depicted with solid green lines and dashed blue lines, respectively. See Figure S1 for a visualization of gene sampling under the competitive hybrid null hypothesis.
References
Publication types
LinkOut - more resources
Full Text Sources
Other Literature Sources