. 2020 Jun 26;7(Pt 4):748-760.
doi: 10.1107/S2052252520006466. eCollection 2020 Jul 1.

Induced DNA bending by unique dimerization of HigA antitoxin

Affiliations

Induced DNA bending by unique dimerization of HigA antitoxin

Jin-Young Park et al. IUCrJ. .

Abstract

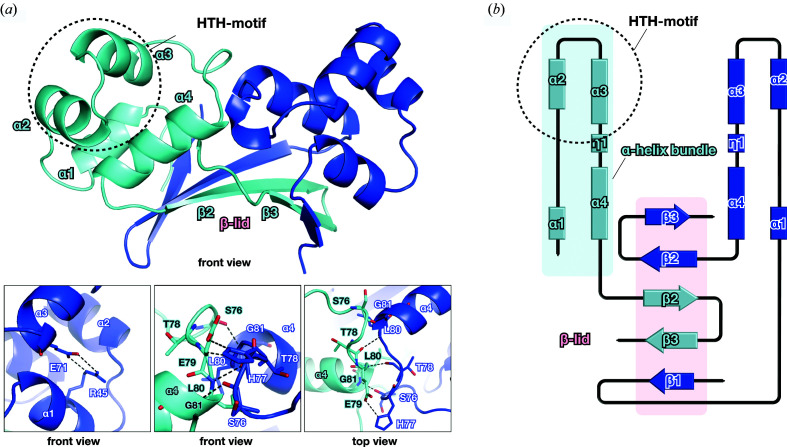
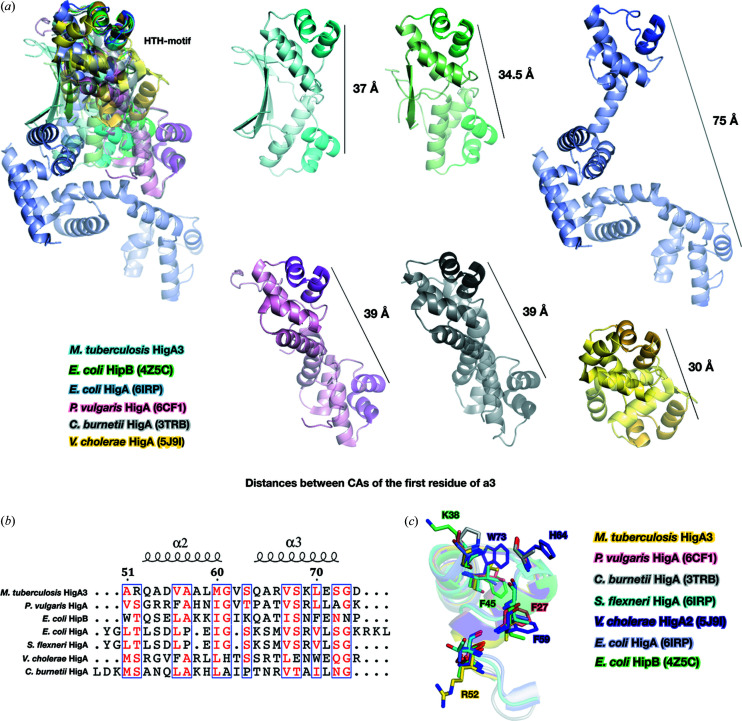
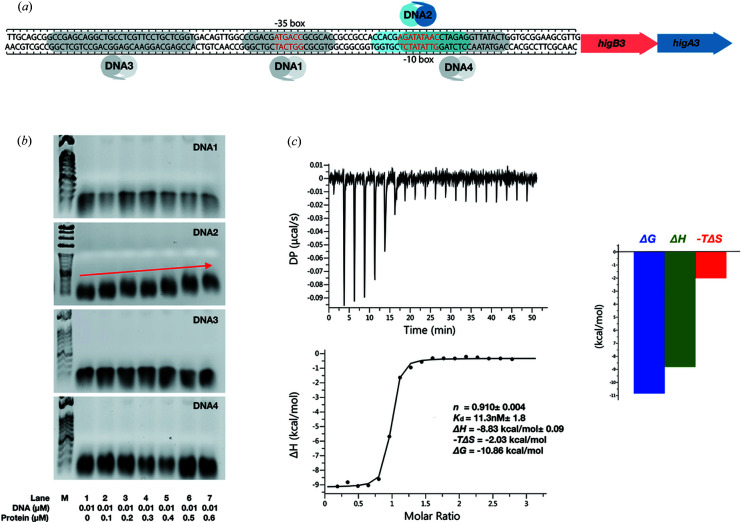
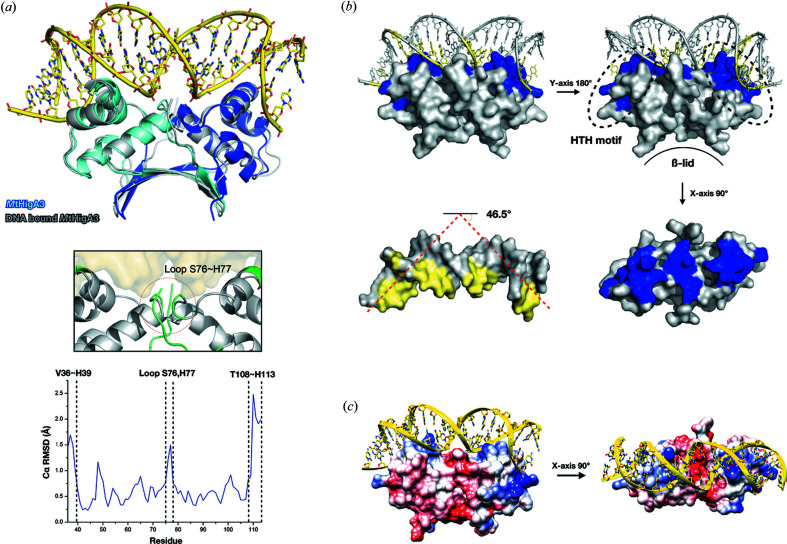
The bacterial toxin-antitoxin (TA) system regulates cell growth under various environmental stresses. Mycobacterium tuberculosis, the causative pathogen of tuberculosis (TB), has three HigBA type II TA systems with reverse gene organization, consisting of the toxin protein HigB and labile antitoxin protein HigA. Most type II TA modules are transcriptionally autoregulated by the antitoxin itself. In this report, we first present the crystal structure of the M. tuberculosis HigA3 antitoxin (MtHigA3) and MtHigA3 bound to its operator DNA complex. We also investigated the interaction between MtHigA3 and DNA using NMR spectroscopy. The MtHigA3 antitoxin structure is a homodimer that contains a structurally well conserved DNA-binding domain at the N-terminus and a dimerization domain at the C-terminus. Upon comparing the HigA homologue structures, a distinct difference was found in the C-terminal region that possesses the β-lid, and diverse orientations of two helix-turn-helix (HTH) motifs from HigA homologue dimers were observed. The structure of MtHigA3 bound to DNA reveals that the promoter DNA is bound to two HTH motifs of the MtHigA3 dimer presenting 46.5° bending, and the distance between the two HTH motifs of each MtHigA3 monomer was increased in MtHigA3 bound to DNA. The β-lid, which is found only in the tertiary structure of MtHigA3 among the HigA homologues, causes the formation of a tight dimerization network and leads to a unique arrangement for dimer formation that is related to the curvature of the bound DNA. This work could contribute to the understanding of the HigBA system of M. tuberculosis at the atomic level and may contribute to the development of new antibiotics for TB treatment.

Keywords: DNA; HigBA; Mycobacterium tuberculosis; NMR spectroscopy; TA system; X-ray crystallography; antitoxins; protein structures; structure determination.


Figures

Figure 1
Figure 1
Crystal structure of MtHigA3. (a) Front view of the overall MtHigA3 structure. Two monomers of MtHigA3 interact to form a dimer with HTH motifs on either side of the dimer structure, and a β-lid is formed as a result of this dimer organization. Front view of the salt bridge formed between Arg45 and Glu71 (left). Front view (middle) and top view (right) of the hydrophilic interactions between the loop and the adjacent α4-helix are enlarged in the panels. Each monomer, including residues from each chain, is coloured cyan and blue. (b) Topology diagram of the MtHigA3 dimer. The secondary structure elements are coloured the same as in (a).
Figure 2
Figure 2
Sequence and structural comparison of MtHigA3 with other homologues. (a) Superposition and structural comparison of MtHigA3 with the structures of E. coli HipB (lime green, PDB code: 4z5c), E. coli HigA (slate, PDB code: 6irp; Yoon et al., 2019 ▸), P. vulgaris HigA (pink, PDB code: 6cf1; Schureck et al., 2019 ▸), C. burnetii HigA (grey, PDB code: 3trb; Franklin et al., 2015 ▸) and V. cholerae HigA (yellow, PDB code: 5j9i; Hadži et al., 2017 ▸). The adjacent chain of each dimer is coloured lighter, and HTH motifs are coloured darker. The distances between CAs of the first residue of the α3-helix are shown as black lines. (b) Sequence alignment focusing on the HTH motif region in M. tuberculosis HigA3, P. vulgaris HigA, E. coli HipB, E. coli HigA, S. flexneri HigA, V. cholerae HigA and C. burnetii HigA. Similar residues are coloured red in the box. Secondary structural elements of MtHigA3 are presented above the sequence, where the helices are indicated by springs. The residue numbering corresponds to M. tuberculosis HigA3. (c) Superposition of the HTH motif of M. tuberculosis HigA3 (yellow) with the structures of P. vulgaris HigA (pink, PDB code: 6cf1), E. coli HipB (lime green, PDB code: 4z5c), E. coli HigA (slate, PDB code: 6irp), S. flexneri HigA (cyan, PDB code: 5ycl), V. cholerae HigA (purple blue, PDB code: 5j9i) and C. burnetii HigA (grey, PDB code: 3trb). Positively charged residues and aromatic residues are shown as sticks.
Figure 3
Figure 3
MtHigA3 binds to the higBA3 promoter region at a specific sequence. (a) Organization of the higBA3 operon. The higB3 toxin gene is located upstream of the higA3 antitoxin gene. Two putative operator regions predicted by the BPROM web interface (Solovyev, 2011 ▸) located at the −35 and −10 positions are shown in red letters. DNA1, which includes the −35 box, is highlighted as grey, and DNA2, which includes the −10 box, is highlighted in blue. Predicted palindromic sequences (DNA3 and DNA4) for the higBA3 gene are coloured grey. The locations of the higB and higA genes are indicated by red and blue arrows, respectively. (b) EMSA experiments of the higBA3 promoter region DNA with increasing concentrations of MtHigA3 (0, 0.1, 0.2, 0.3, 0.5 and 0.6 µM). Only DNA2 is shifted upwards with increasing MtHigA3 concentration. Band shifts are indicated by red narrows. (c) ITC measurement upon the interaction of MtHigA3 and DNA2. (Left) Graphical representation of thermodynamic parameters for the MtHigA3 and DNA2 interaction. (Right) MtHigA3 binding to DNA2 is associated with a favourable entropy change.
Figure 4
Figure 4
Overall structure of MtHigA3 bound to DNA. (a) Superimposed cartoon representation of MtHigA3 bound to DNA and the MtHigA3 dimer structure (produced by matching the MtHigA3 dimer of both models). The MtHigA3 dimer is coloured cyan and blue. MtHigA3 bound to DNA is coloured grey. The DNA fragment of MtHigA3 bound to DNA is coloured yellow. Plot of Cα r.m.s.d. of the MtHigA3 dimer and MtHigA3 bound to DNA to compare Cα movement after DNA binding. N-terminal (Val36–His39), loop region (Ser76–His77) and C-terminal (Thr108–His113) residues show relatively large deviations. The region showing more than 1 Å r.m.s.d. is drawn in the black box and highlighted in green. (b) Cartoon and surface representation of MtHigA3 bound to the DNA structure in diverse orientations. The regions of MtHigA3 and DNA structure, which involve contact with each other, are coloured blue (MtHigA3) and yellow (DNA). Bent DNA in MtHigA3 bound to the DNA structure is marked as a red line. Promoter DNA is dramatically bent by the binding of MtHigA3 (46.5°). (c) Superimposed MtHigA3 dimer and DNA structure of MtHigA3 bound to DNA. The electrostatic surface potential of the MtHigA3 dimer is coloured between −10 kT e−1 (red) and 10 kT e−1 (blue) in two orientations rotated by 90°. The DNA structure of MtHigA3 bound to DNA is presented as a cartoon representation. DNA binds to the positively charged region of the MtHigA3 dimer.
Figure 5
Figure 5
NMR titration of MtHigA335–117 and its promoter DNA. (a) Overlaid [1H-15N] TROSY–HSQC titration spectra of 0.4 mM 15N-labelled MtHigA335–117 with increasing concentrations of promoter DNA. (b) CSP analysis of MtHigA335–117 upon binding to the promoter DNA. CSPs > average CSP values (0.075) are coloured cyan, CSPs < average CSP values (0.075) are coloured grey, and the peaks that disappeared upon the addition of DNA are presented as magenta bars. Secondary structural elements of MtHigA335–117 are represented above the plot by blue cylinders (α-helices) and yellow arrows (β-strands). (c) The residues showing higher CSP values than the average CSP value in the β-lid (His93, Leu84, Ala98 and Val105) are shown as sticks and coloured cyan in the box. For a clear display, MtHigA3 bound to DNA is presented as a cartoon diagram in surface view (left). Chemical shift mapping based on the CSP data from (b) on the crystal structure of MtHigA3 bound to DNA in two orientations rotated by 90°. The DNA structure is represented using sticks for clarity.
Figure 6
Figure 6
Structural comparison of MtHigA3 bound to DNA and its homologues. (a) Cartoon representation of MtHigA3 bound to DNA (yellow), PvHigA bound to DNA (blue) and EcHipB bound to DNA (cyan). The C-terminus of the antitoxin which differs markedly in comparison is marked with a black dotted circle. Only the protein structures in these DNA–protein complexes are shown for clarity. (b) The superimposed cartoon represents the DNA structure of MtHigA3 bound to DNA (yellow), PvHigA bound to DNA (blue) and EcHipB bound to DNA (cyan). Only the DNA structures in these DNA–protein complexes are shown for clarity. (c) Structure of MtHigA3 bound to DNA, PvHigA bound to DNA and EcHipB bound to DNA. The antitoxins are presented as cartoon diagrams in surface view. Dimer angles between central stalks are indicated.

References

    1. Adams, P. D., Afonine, P. V., Bunkópw5014/czi, G., Chen, V. B., Davis, I. W., Echols, N., Headd, J. J., Hung, L.-W., Kapral, G. J., Grosse-Kunstleve, R. W., McCoy, A. J., Moriarty, N. W., Oeffner, R., Read, R. J., Richardson, D. C., Richardson, J. S., Terwilliger, T. C. & Zwart, P. H. (2010). Acta Cryst. D66, 213–221.
    1. Aggarwal, A. K., Rodgers, D. W., Drottar, M., Ptashne, M. & Harrison, S. C. (1988). Science, 242, 899–907. - PubMed
    1. Aizenman, E., Engelberg-Kulka, H. & Glaser, G. (1996). Proc. Natl Acad. Sci. USA, 93, 6059–6063. - PMC - PubMed
    1. Anjana, R., Vaishnavi, M. K., Sherlin, D., Kumar, S. P., Naveen, K., Kanth, P. S. & Sekar, K. (2012). Bioinformation, 8, 1220–1224. - PMC - PubMed
    1. Armalytė, J., Jurėnas, D., Krasauskas, R., Čepauskas, A. & Sužiedėlienė, E. (2018). Front. Microbiol. 9, 732. - PMC - PubMed