. 2020 Jul 15;6(7):e04438.
doi: 10.1016/j.heliyon.2020.e04438. eCollection 2020 Jul.

Japanese mushroom consumption alters the lipid metabolomic profile of high-fat diet-fed mice

Affiliations

Japanese mushroom consumption alters the lipid metabolomic profile of high-fat diet-fed mice

Takamitsu Shimizu et al. Heliyon. .

Abstract

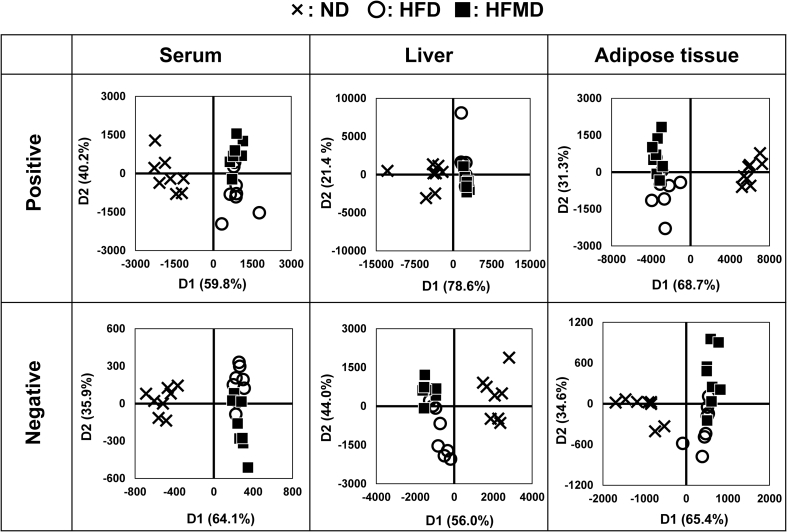
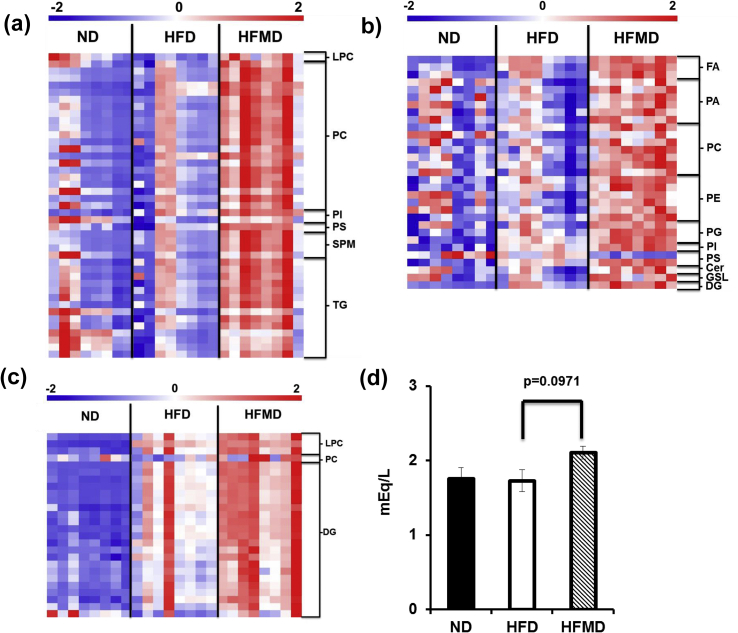
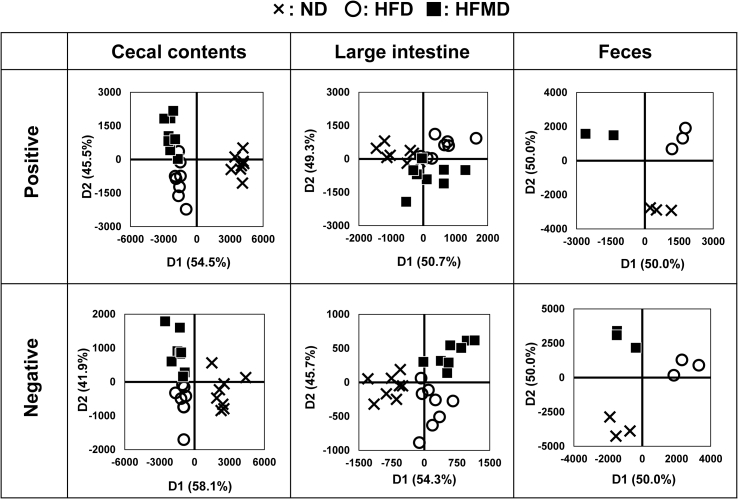
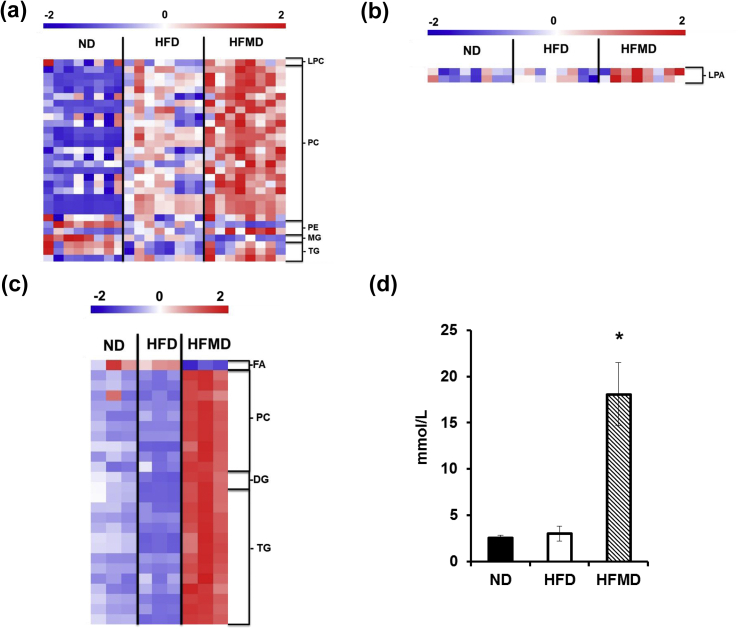
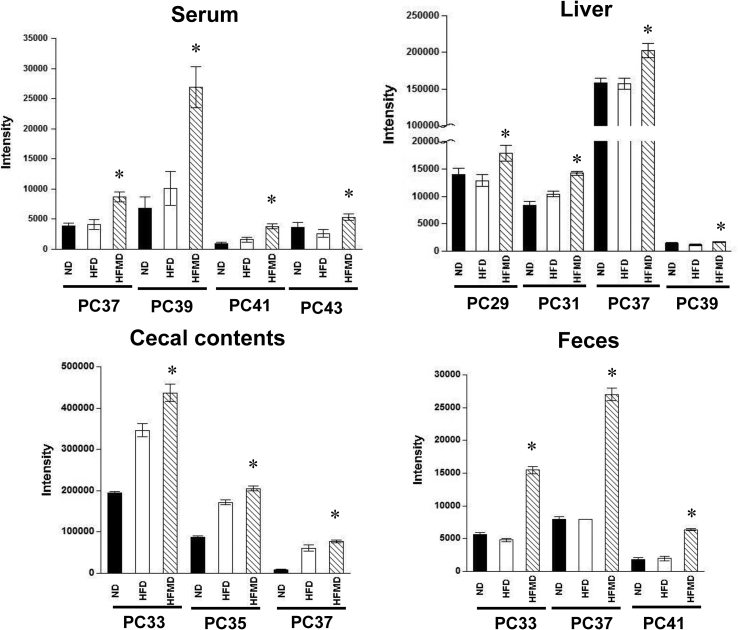
Mushrooms are familiar ingredients in Japanese cuisine and large numbers are consumed in Japan. Recently, we reported that the consumption of Japanese mushrooms suppressed the accumulation of visceral fat. The purpose of this study was to examine the alteration of lipid metabolism by Japanese mushrooms consumption in high-fat diet (HFD) mice. Multivariate analysis of serum, liver, adipose tissue, cecal contents, large intestinal and fecal lipids showed differing compositions in the mice that had consumed HFD or HFD supplemented with 3% freeze-dried mushroom mixture (HFMD). There were higher concentrations of diacylglycerol in the adipose tissue, non-esterified fatty acids in the serum, and triacylglycerol in the feces of the HFMD group. These results suggest that mushroom consumption promotes the degradation of lipids in visceral fat and limits the absorption of food lipids. Moreover, the HFMD group demonstrated higher concentrations of phospholipids, some of which contained odd-chain fatty acids. Thus, we speculated that the alteration of lipid metabolism in mice such that mushroom consumption prevent obesity progression, as demonstrated by metabolomic analysis.

Keywords: Food science; Japanese mushroom; Lipid profile; Metabolome; Obesity.


Figures

Figure 1
Figure 1
Multivariate analysis of the serum, liver, and adipose tissue metabolites of mice fed an ND, HFD, or HFMD. PCA-DA score plots obtained from LC-QTOF-MS spectra in positive and negative modes. ND: normal diet, HFD: high-fat diet, HFMD: high-fat diet plus mushroom mixture.
Figure 2
Figure 2
Heatmaps of the lipid metabolites identified in serum (a), liver (b), and adipose tissue (c). Each value in the heatmaps is a colored representation of calculated z-score-transformed raw data for the serum, liver, or adipose tissue lipid metabolites that demonstrated significant differences among the groups. Red and blue colors indicate higher and lower metabolite concentrations, respectively. ND: normal diet, HFD: high-fat diet, HFMD: high-fat diet plus mushroom mixture. LPC: lysophosphatidylcholine, PC: phosphatidylcholine, PI: phosphatidylinositol, PS: phosphatidylserine, SPM: sphingomyelin TG: triacylglycerol, FA: fatty acid, PA: phosphatidic acid, PE: phosphatidyl ethanolamine, PG: phosphatidyl glycerol, Cer: ceramide, GSL: glycosphingosaccharide, DG: diacylglycerol. Effect of mushroom consumption on serum NEFA concentration (d). Values are mean ± SE; n = 8.
Figure 3
Figure 3
Multivariate analysis of the cecal content, large intestinal, and fecal metabolites of mice fed ND, HFD, or HFMD. PCA-DA score plots obtained from LC-QTOF-MS spectra in positive and negative modes. ND: normal diet, HFD: high-fat diet, HFMD: high-fat diet plus mushroom mixture.
Figure 4
Figure 4
Heatmaps of the lipid species identified in the cecal contents (a), large intestine (b), and feces (c). Each value in the heatmaps is a colored representation of calculated z-score-transformed raw data for each tissue/substance that displayed significant differences among the groups. Red and blue colors indicate higher and lower lipid metabolite concentrations, respectively. ND: normal diet, HFD: high-fat diet, HFMD: high-fat diet plus mushroom mixture. LPC: lysophosphatidylcholine, PC: phosphatidylcholine, PE: phosphatidyl ethanolamine, MG: monoacylglycerol, TG: triacylglycerol, LPA: lysophosphatidic acid, FA: fatty acid, DG: diacylglycerol. Effect of mushroom consumption on fecal triglyceride concentration (d). Values are mean ± SE; n = 8. ∗: p < 0.05 vs. the HFD group.
Figure 5
Figure 5
Relative concentrations of PC containing odd-chain fatty acids in the serum, liver, cecal contents, and feces of mice fed ND, HFD, or HFMD. Values are mean ± SE; n = 8. ∗p < 0.05 vs. the HFD group. PC: phosphatidylcholine, ND: normal diet, HFD: high-fat diet, HFMD: high-fat diet plus mushroom mixture.

Similar articles

Cited by

References

    1. Anjos S., Feiteira E., Cerveira F., Melo T.n., Reboredo A., Colombo S., Dantas R., Costa E., Moreira A., Santos S.n. Lipidomics reveals similar changes in serum phospholipid signatures of overweight and obese pediatric subjects. J. Proteome Res. 2019;18(8):3174–3183. - PubMed
    1. Beckonert O., Keun H.C., Ebbels T.M., Bundy J., Holmes E., Lindon J.C., Nicholson J.K. Metabolic profiling, metabolomic and metabonomic procedures for NMR spectroscopy of urine, plasma, serum and tissue extracts. Nat. Protoc. 2007;2(11):2692. - PubMed
    1. Cliffe L.J., Humphreys N.E., Lane T.E., Potten C.S., Booth C., Grencis R.K. Accelerated intestinal epithelial cell turnover: a new mechanism of parasite expulsion. Science. 2005;308(5727):1463–1465. - PubMed
    1. Dandona P., Aljada A., Chaudhuri A., Mohanty P., Garg R. Metabolic syndrome: a comprehensive perspective based on interactions between obesity, diabetes, and inflammation. Circulation. 2005;111(11):1448–1454. - PubMed
    1. Erion D.M., Shulman G.I. Diacylglycerol-mediated insulin resistance. Nat. Med. 2010;16(4):400–402. - PMC - PubMed

LinkOut - more resources