. 2020 Oct;42(5):1387-1410.
doi: 10.1007/s11357-020-00233-w. Epub 2020 Jul 21.

Aging exacerbates impairments of cerebral blood flow autoregulation and cognition in diabetic rats

Affiliations

Aging exacerbates impairments of cerebral blood flow autoregulation and cognition in diabetic rats

Shaoxun Wang et al. Geroscience. 2020 Oct.

Abstract

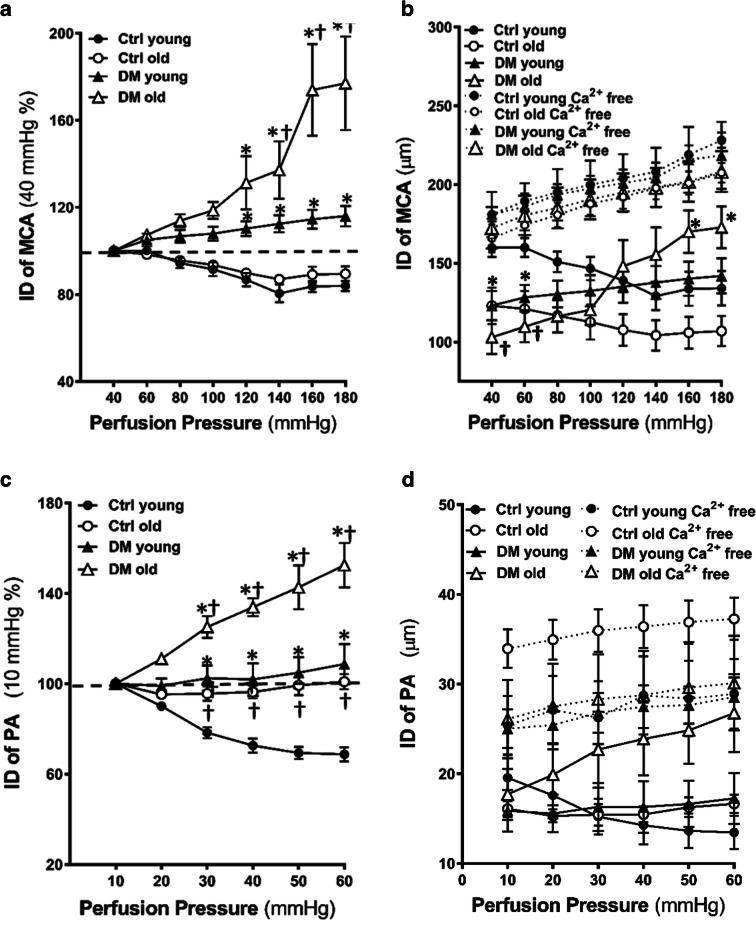
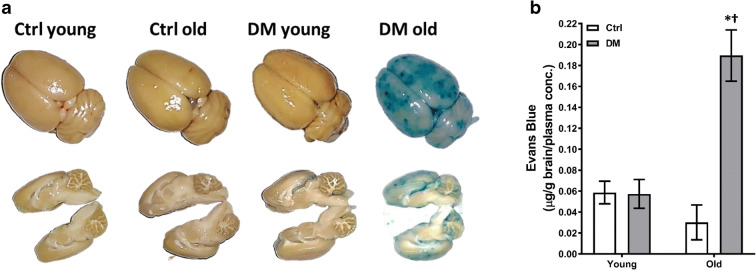
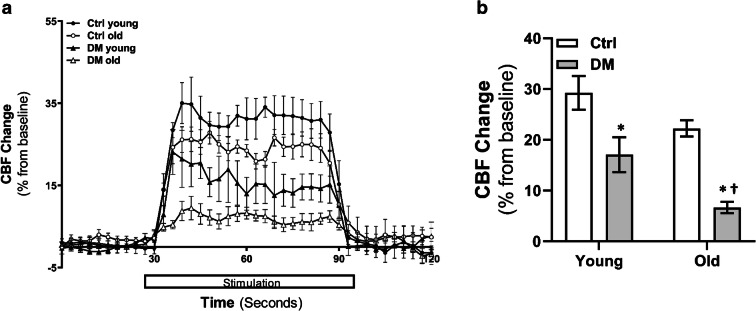
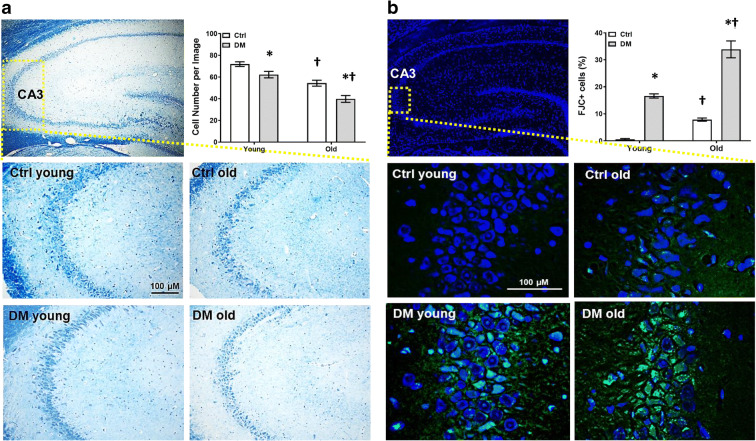
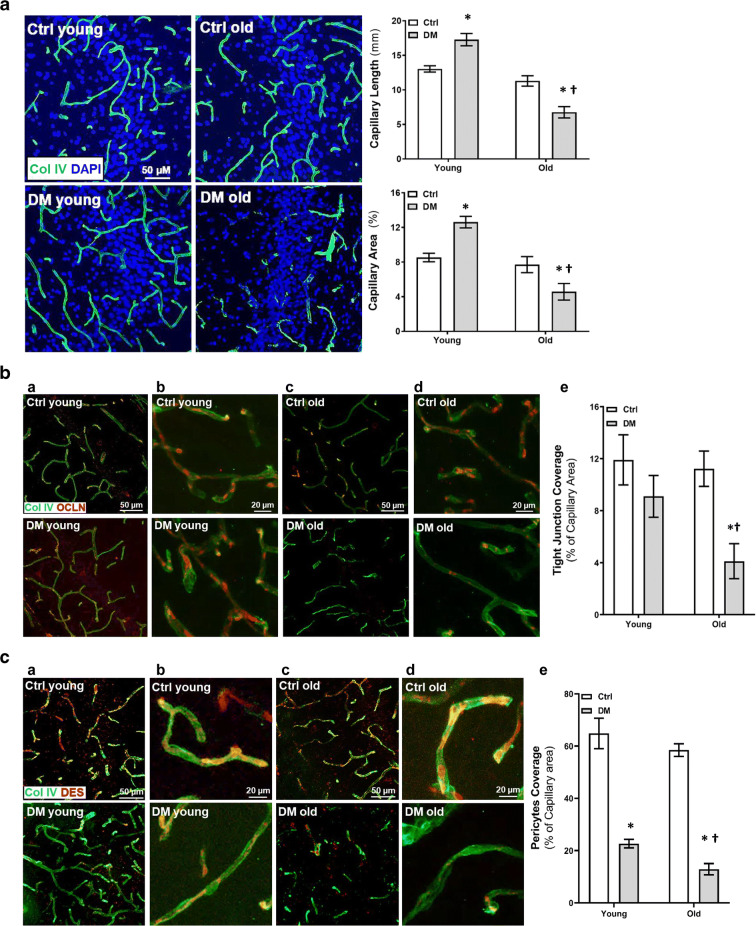
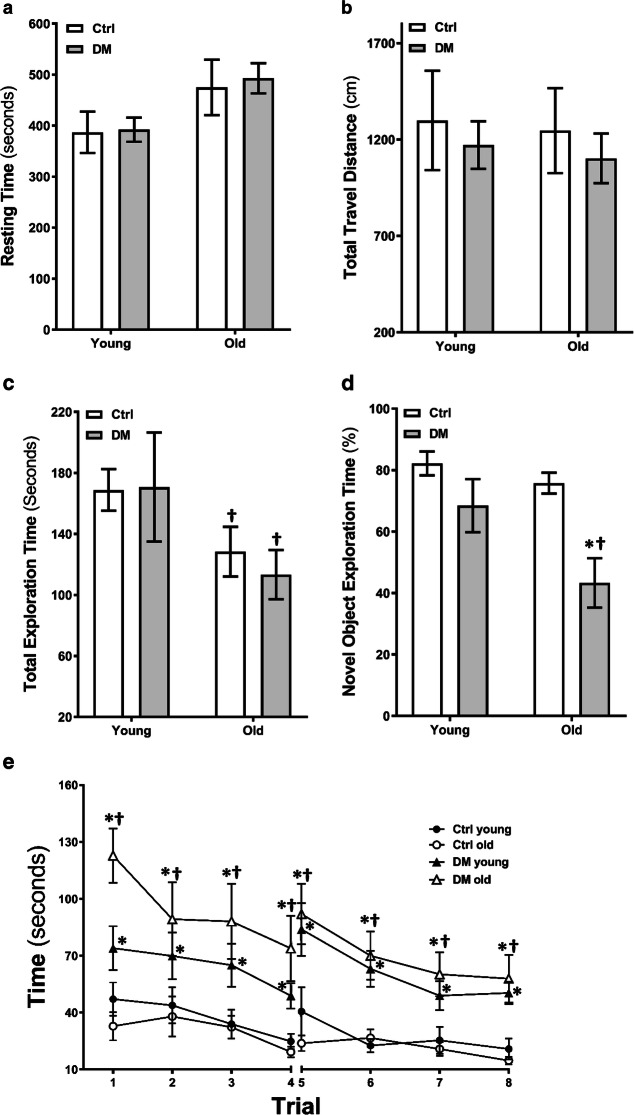
Diabetes mellitus (DM) is a leading risk factor for aging-related dementia; however, the underlying mechanisms are not well understood. The present study, utilizing a non-obese T2DN diabetic model, demonstrates that the myogenic response of the middle cerebral artery (MCA) and parenchymal arteriole (PA) and autoregulation of cerebral blood flow (CBF) in the surface and deep cortex were impaired at both young and old ages. The impaired CBF autoregulation was more severe in old than young DM rats, and in the deep than the surface cortex. The myogenic tone of the MCA was enhanced at perfusion pressure in the range of 40-100 mmHg in young DM rats but was reduced at 140-180 mmHg in old DM rats. No change of the myogenic tone of the PA was observed in young DM rats, whereas it was significantly reduced at 30-60 mmHg in old DM rats. Old DM rats had enhanced blood-brain barrier (BBB) leakage and neurodegeneration, reduced vascular density, tight junction, and pericyte coverage on cerebral capillaries in the CA3 region in the hippocampus. Additionally, DM rats displayed impaired functional hyperemia and spatial learning and short- and long-term memory at both young and old ages. Old DM rats had impaired non-spatial short-term memory. These results revealed that impaired CBF autoregulation and enhanced BBB leakage plays an essential role in the pathogenesis of age- and diabetes-related dementia. These findings will lay the foundations for the discovery of anti-diabetic therapies targeting restoring CBF autoregulation to prevent the onset and progression of dementia in elderly DM.

Keywords: Autoregulation; Blood-brain barrier; Cognitive impairments; Diabetes mellitus; Myogenic response.


Conflict of interest statement

The authors declare that they have no conflict of interest.

Figures

Fig. 1
Fig. 1
Baseline biophysical parameters, intraperitoneal glucose tolerance test (IPGTT), and insulin tolerance test (ITT). All experiments were compared in young (3 M) and old (18 M) non-diabetic (ctrl) and diabetic (DM) rats. a Comparison of body weight, brain weight, plasma glucose, glycosylated hemoglobin (HbA1c), mean arterial pressure (MAP), and insulin levels. N = 6–38 rats per group. b Glycemic profiles after intraperitoneal administration of glucose (2 g/kg). Time 0 indicates baseline glucose levels after 18 h fasting prior to the injection of glucose. Plasma glucose levels were measured at the time of 5, 15, 30, 60, 90, and 120 min then after. c The area under the curve (AUC) of IPGTT curves. d Glycemic profiles after intraperitoneal administration of insulin (0.3 U/kg). Time 0 indicates baseline glucose levels after 18 h fasting prior to the injection of insulin. Plasma glucose levels were measured at the time of 5, 15, 30, 60, 90, 120, and 150 min then after. e The area under the curve (AUC) of ITT curves. Mean values ± SEM are presented. N = 5–9 rats per group (B-E). The asterisk indicates P < 0.05 from the corresponding values in age-matched SD rats. The dagger indicates P < 0.05 from the corresponding values in young rats within a strain
Fig. 2
Fig. 2
Myogenic response, myogenic tone, and autoregulation of CBF. Comparison of the myogenic response, myogenic tone of the MCA and PA, and surface and deep cortical CBF autoregulation in young and old non-diabetic control (Ctrl) and DM rats. a Comparison of the myogenic response of the MCA as of % constriction to 40 mmHg. b Absolute values of IDs of the MCA in PSS and PSS0Ca solutions. c Comparison of the myogenic response of the PA as of % constriction to 10 mmHg. d Absolute values of IDs of the PA in PSS and PSS0Ca solutions. e Comparison of the % of the myogenic tone of the MCA. f Comparison of the % of the myogenic tone of the PA. g Comparison of surface cortical CBF autoregulation as of % to 100 mmHg. h Comparison of deep cortical CBF autoregulation as of % to 100 mmHg. i Representative laser speckle contrast images of surface cortical CBF at 60, 100, and 160 mmHg. Mean values ± SEM are presented. N = 4–9 rats per group. The asterisk indicates P < 0.05 from the corresponding values in age-matched SD rats. The dagger indicates P < 0.05 from the corresponding values in young rats within a strain
Fig. 2
Fig. 2
Myogenic response, myogenic tone, and autoregulation of CBF. Comparison of the myogenic response, myogenic tone of the MCA and PA, and surface and deep cortical CBF autoregulation in young and old non-diabetic control (Ctrl) and DM rats. a Comparison of the myogenic response of the MCA as of % constriction to 40 mmHg. b Absolute values of IDs of the MCA in PSS and PSS0Ca solutions. c Comparison of the myogenic response of the PA as of % constriction to 10 mmHg. d Absolute values of IDs of the PA in PSS and PSS0Ca solutions. e Comparison of the % of the myogenic tone of the MCA. f Comparison of the % of the myogenic tone of the PA. g Comparison of surface cortical CBF autoregulation as of % to 100 mmHg. h Comparison of deep cortical CBF autoregulation as of % to 100 mmHg. i Representative laser speckle contrast images of surface cortical CBF at 60, 100, and 160 mmHg. Mean values ± SEM are presented. N = 4–9 rats per group. The asterisk indicates P < 0.05 from the corresponding values in age-matched SD rats. The dagger indicates P < 0.05 from the corresponding values in young rats within a strain
Fig. 3
Fig. 3
Blood-brain barrier (BBB) permeability. Comparison of BBB permeability in young and old non-diabetic control (Ctrl) and DM rats. a Representative images of the extravasation of Evans blue after mean blood pressure (MAP) was elevated to 180 mmHg for 1 h. b Tissue concentration of Evans blue in the brains. Mean values ± SEM are presented. N = 4–6 rats per group. The asterisk indicates P < 0.05 from the corresponding values in age-matched SD rats. The dagger indicates P < 0.05 from the corresponding values in young rats within a strain
Fig. 4
Fig. 4
Functional hyperemia. Comparison of CBF response to whisker stimulation in young and old non-diabetic control (Ctrl) and DM rats. a Time course of percentage changes of cortical CBF in response to whisker stimulation. b Averaged percentage changes in CBF during 60 s of stimulation. Mean values ± SEM are presented. N = 4 rats per group. The asterisk indicates P < 0.05 from the corresponding values in age-matched SD rats. The dagger indicates P < 0.05 from the corresponding values in young rats within a strain
Fig. 5
Fig. 5
Neurodegeneration. Comparison of neurodegeneration in the CA3 region of the hippocampus in young and old non-diabetic control (Ctrl) and DM rats. a Representative images and quantitation (right upper panel) of Nissl staining. b Representative images and quantitation (right upper panel) of FJC (green) and DAPI (blue) staining. Data are expressed as the number of cells per high-power field for Nissl staining, and the percentage of FJC-positive neurons normalizing with neuron numbers identified with DAPI staining. Mean values ± SEM are presented. N = 4 rats per group. The asterisk indicates P < 0.05 from the corresponding values in age-matched SD rats. The dagger indicates P < 0.05 from the corresponding values in young rats within a strain
Fig. 6
Fig. 6
Vascular density, tight junction, and pericyte coverage.Comparison of cerebral vascular density, tight junction, and pericyte coverage in the CA3 region of the hippocampus in young and old non-diabetic control (Ctrl) and DM rats. a Representative images and quantitation of capillary density by comparison of the length (right upper panel) and percentage area (right lower panel) per field of collagen IV (Col IV, green)-stained capillaries. b Representative images (a–d) and quantitation (e) of tight junction coverage by comparison of the percentage of occludin (OCLN, red) on collagen IV (Col IV, green)-stained capillaries. Magnifications: columns a, c: × 880; columns b, d: × 2640. c Representative images (a–d) and quantitation (e) of pericyte coverage by comparison of the percentage of desmin (DES, red) on collagen IV (Col IV, green)-stained capillaries. Magnifications: columns a, c: × 880; columns b, d: × 2640. Mean values ± SEM are presented. N = 4 rats per group. The asterisk indicates P < 0.05 from the corresponding values in age-matched SD rats. The dagger indicates P < 0.05 from the corresponding values in young rats within a strain
Fig. 7
Fig. 7
Neurobehavioral tests. Resting time (a) and total travel distance (b) in the open field test in young and old non-diabetic control (Ctrl) and DM rats. N = 6–11 rats per group. Total exploration time (c) and percentage time spent in the vicinity of the novel object (d) in the novel object recognition test. N = 6–11 rats per group. Time to reach the platform per trial in a 2-day eight-arm water maze test (e). N = 9–19 rats per group. Mean values ± SEM are presented. The asterisk indicates P < 0.05 from the corresponding values in age-matched SD rats. The dagger indicates P < 0.05 from the corresponding values in young rats within a strain

Similar articles

Cited by

References

    1. Abd-Elrahman KS, Walsh MP, Cole WC. Abnormal rho-associated kinase activity contributes to the dysfunctional myogenic response of cerebral arteries in type 2 diabetes. Can J Physiol Pharmacol. 2015;93:177–184. doi: 10.1139/cjpp-2014-0437. - DOI - PubMed
    1. Abd-Elrahman KS, Colinas O, Walsh EJ, Zhu HL, Campbell CM, Walsh MP, Cole WC. Abnormal myosin phosphatase targeting subunit 1 phosphorylation and actin polymerization contribute to impaired myogenic regulation of cerebral arterial diameter in the type 2 diabetic Goto-Kakizaki rat. J Cereb Blood Flow Metab. 2017;37:227–240. doi: 10.1177/0271678X15622463. - DOI - PMC - PubMed
    1. Abdelsaid M, Ma H, Coucha M, Ergul A. Late dual endothelin receptor blockade with bosentan restores impaired cerebrovascular function in diabetes. Life Sci. 2014;118:263–267. doi: 10.1016/j.lfs.2013.12.231. - DOI - PMC - PubMed
    1. Amitani M, Asakawa A, Amitani H, Inui A. The role of leptin in the control of insulin-glucose axis. Front Neurosci. 2013;7:51. doi: 10.3389/fnins.2013.00051. - DOI - PMC - PubMed
    1. Armulik A, et al. Pericytes regulate the blood-brain barrier. Nature. 2010;468:557–561. doi: 10.1038/nature09522. - DOI - PubMed

Publication types

LinkOut - more resources