. 2020 Jul 22:9:e58954.
doi: 10.7554/eLife.58954.

Genetic and environmental determinants of variation in the plasma lipidome of older Australian twins

Affiliations

Genetic and environmental determinants of variation in the plasma lipidome of older Australian twins

Matthew Wk Wong et al. Elife. .

Abstract

The critical role of blood lipids in a broad range of health and disease states is well recognised but less explored is the interplay of genetics and environment within the broader blood lipidome. We examined heritability of the plasma lipidome among healthy older-aged twins (75 monozygotic/55 dizygotic pairs) enrolled in the Older Australian Twins Study (OATS) and explored corresponding gene expression and DNA methylation associations. 27/209 lipids (13.3%) detected by liquid chromatography-coupled mass spectrometry (LC-MS) were significantly heritable under the classical ACE twin model (h2 = 0.28-0.59), which included ceramides (Cer) and triglycerides (TG). Relative to non-significantly heritable TGs, heritable TGs had a greater number of associations with gene transcripts, not directly associated with lipid metabolism, but with immune function, signalling and transcriptional regulation. Genome-wide average DNA methylation (GWAM) levels accounted for variability in some non-heritable lipids. We reveal a complex interplay of genetic and environmental influences on the ageing plasma lipidome.

Keywords: chromosomes; gene expression; genetics; genomics; heritability; human; lipidomics.


Conflict of interest statement

MW, AT, NB, KM, YL, LC, BB, NA, JK, PS, MW, DA, RP, TL, AP, PS No competing interests declared

Figures
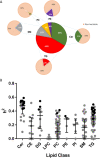
Figure 1.
Figure 1.. Heritability of lipids.
(A) Percentage distribution of heritable lipids. The central wheel represents significantly heritable lipids and their percentage distribution by lipid class. Smaller wheels emanating from each sector represent proportions of these heritable lipids compared to total measured lipids of that class, such that the sum of these smaller wheels equals the total pool of 207 individual lipids measured. For example, 45% of significantly heritable lipids belonged to the TG lipid class, and these heritable lipids represented 17% of total measured plasma TG. Orange sectors represent non-heritable percentage of each lipid class. (B) The distribution of heritability (h2), estimated from the ACE model, for each individual lipid species grouped according to class. Boxplots show median with interquartile range for each class. Dark circles represent heritable lipids, as opposed to grey circles, which represent lipids that were not significantly heritable. Minimum (significant) heritability is h2 >0.287.
Figure 1—figure supplement 1.
Figure 1—figure supplement 1.. Genetic correlation heatmap.
Genetic correlation matrix heatmap. Values represent the median of genetic correlations taken between combinations of heritable lipid species of one lipid class with lipid species of another class (or the same class). Note SM represents the sum of SM with a single double bond, thus no correlation could be computed for SM with itself. TG_t represents triglycerides referred to as a traditional lipid measure (as opposed to individual species measured by mass spectrometry).
Figure 2.
Figure 2.. Heritability estimate (h2a) vs total variance explained (Nagelkerke r2) by gene expression probe transcripts for heritable lipids.
Pearson correlation was calculated.
Figure 2—figure supplement 1.
Figure 2—figure supplement 1.. Batch correction using inverse rank normal transform of residuals.
PCA plots showing good overlap of experimental batch lipids after (A) residuals were taken and (B) after inverse rank normal transformation was applied to these residuals.
Figure 3.
Figure 3.. Venn diagrams showing distribution of gene transcripts associated with a majority of TG lipids.
These were subdivided into those associated with saturated vs monounsaturated vs polyunsaturated lipids for (A) significantly heritable TGs and (B) non-heritable TGs. Also shown are heritable vs non-heritable set of significant gene expression associations of TG lipids that were first subdivided based on (C) double bond group/saturation (Supplementary file 2G) and (D) total number of carbons (<49 carbons, 49–55 carbons and 56+ carbons, Supplementary file 2H). Gene transcripts included in these Venn diagrams were those significantly associated with the highest and second highest number of lipids of a particular saturation class (A and B), or among heritable and non-heritable lipids (C and D). Upwards and downwards arrows indicate positive and inverse gene expression associations with lipid levels respectively.
Figure 4.
Figure 4.. Schematic of the combined genetic and environmental influences on the blood lipidome, and the association of this lipidome with the blood transcriptome.
Under this model, non-heritable lipids could affect gene transcription, while heritable lipids could also affect gene transcription (collectively ‘blood lipid associated transcriptome’), but are possibly modified upstream by genetic machinery such as elongases, desaturases, synthetases, receptors and binding proteins. Gene transcripts encoding these enzymes and proteins may be independent of the ‘blood lipid associated transcriptome’ noted in this study.

References

    1. Alshehry ZH, Barlow CK, Weir JM, Zhou Y, McConville MJ, Meikle PJ. An efficient single phase method for the extraction of plasma lipids. Metabolites. 2015;5:389–403. doi: 10.3390/metabo5020389. - DOI - PMC - PubMed
    1. Anagnostis P, Stevenson JC, Crook D, Johnston DG, Godsland IF. Effects of menopause, gender and age on lipids and high-density lipoprotein cholesterol subfractions. Maturitas. 2015;81:62–68. doi: 10.1016/j.maturitas.2015.02.262. - DOI - PubMed
    1. Armstrong NJ, Mather KA, Thalamuthu A, Wright MJ, Trollor JN, Ames D, Brodaty H, Schofield PR, Sachdev PS, Kwok JB. Aging, exceptional longevity and comparisons of the Hannum and Horvath epigenetic clocks. Epigenomics. 2017;9:689–700. doi: 10.2217/epi-2016-0179. - DOI - PubMed
    1. Aryee MJ, Jaffe AE, Corrada-Bravo H, Ladd-Acosta C, Feinberg AP, Hansen KD, Irizarry RA. Minfi: a flexible and comprehensive bioconductor package for the analysis of infinium DNA methylation microarrays. Bioinformatics. 2014;30:1363–1369. doi: 10.1093/bioinformatics/btu049. - DOI - PMC - PubMed
    1. Barber MN, Risis S, Yang C, Meikle PJ, Staples M, Febbraio MA, Bruce CR. Plasma lysophosphatidylcholine levels are reduced in obesity and type 2 diabetes. PLOS ONE. 2012;7:e41456. doi: 10.1371/journal.pone.0041456. - DOI - PMC - PubMed

Publication types