

Adaptation to a low carbohydrate high fat diet is rapid but impairs endurance exercise metabolism and performance despite enhanced glycogen availability
- PMID: 32697366
- PMCID: PMC7891450
- DOI: 10.1113/JP280221
Adaptation to a low carbohydrate high fat diet is rapid but impairs endurance exercise metabolism and performance despite enhanced glycogen availability
Abstract
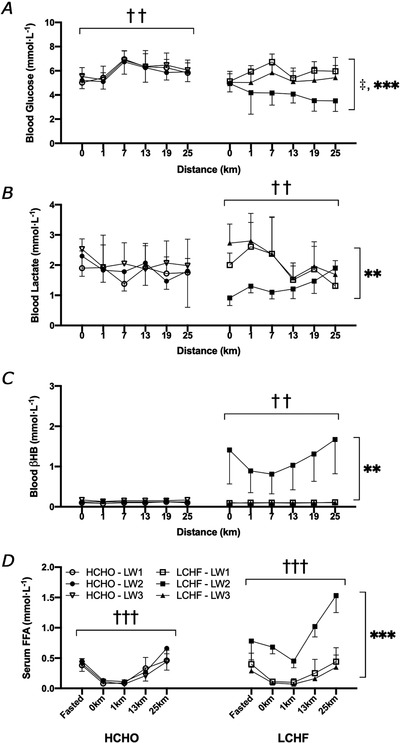
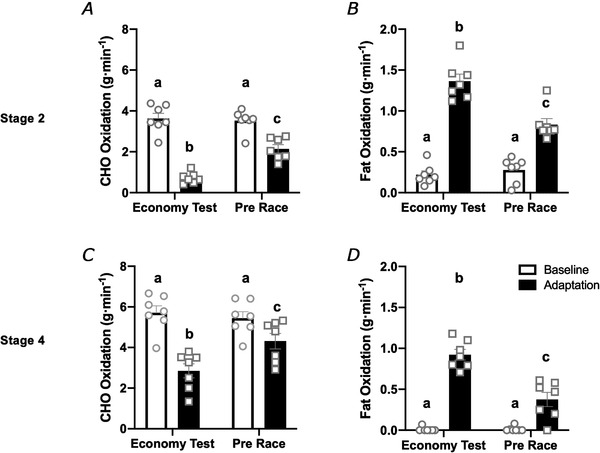
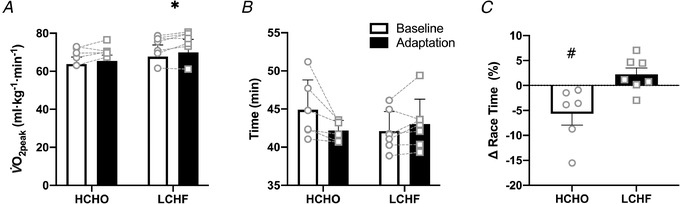
Key points: Brief (5-6 days) adaptation to a low carbohydrate high fat diet in elite athletes increased exercise fat oxidation to rates previously observed with medium (3-4 weeks) or chronic (>12 months) adherence to this diet, with metabolic changes being washed out in a similar time frame. Increased fat utilisation during exercise was associated with a 5-8% increase in oxygen cost at speeds related to Olympic Programme races. Acute restoration of endogenous carbohydrate (CHO) availability (24 h high CHO diet, pre-race CHO) only partially restored substrate utilisation during a race warm-up. Fat oxidation continued to be elevated above baseline values although it was lower than achieved by 5-6 days' keto adaptation; CHO oxidation only reached 61% and 78% of values previously seen at exercise intensities related to race events. Acute restoration of CHO availability failed to overturn the impairment of high-intensity endurance performance previously associated with low carbohydrate high fat adaptation, potentially due to the blunted capacity for CHO oxidation.
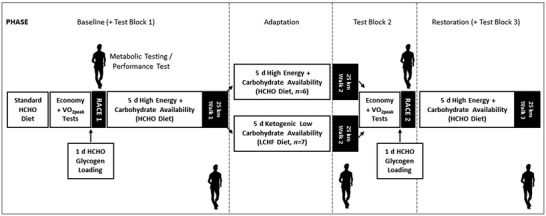
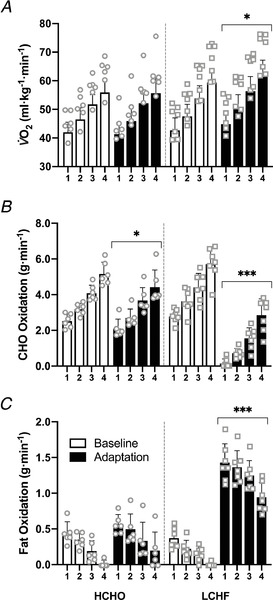
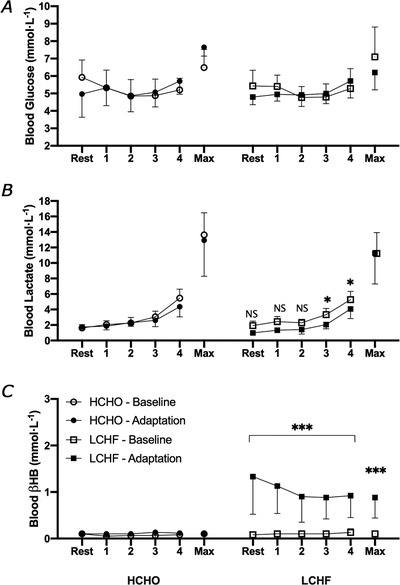
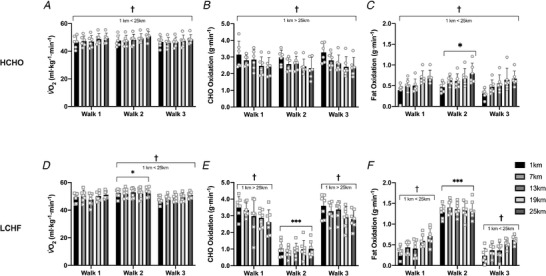
Abstract: We investigated substrate utilisation during exercise after brief (5-6 days) adaptation to a ketogenic low-carbohydrate (CHO), high-fat (LCHF) diet and similar washout period. Thirteen world-class male race walkers completed economy testing, 25 km training and a 10,000 m race (Baseline), with high CHO availability (HCHO), repeating this (Adaptation) after 5-6 days' LCHF (n = 7; CHO: <50 g day-1 , protein: 2.2 g kg-1 day-1 ; 80% fat) or HCHO (n = 6; CHO: 9.7 g kg-1 day-1 ; protein: 2.2 g kg-1 day-1 ) diet. An Adaptation race was undertaken after 24 h HCHO and pre-race CHO (2 g kg-1 ) diet, identical to the Baseline race. Substantial (>200%) increases in exercise fat oxidation occurred in the LCHF Adaptation economy and 25 km tests, reaching mean rates of ∼1.43 g min-1 . However, relative (ml min-1 kg-1 ) was higher (P < 0.0001), by ∼8% and 5% at speeds related to 50 km and 20 km events. During Adaptation race warm-up in the LCHF group, rates of fat and CHO oxidation at these speeds were decreased and increased, respectively (P < 0.001), compared with the previous day, but were not restored to Baseline values. Performance changes differed between groups (P = 0.009), with all HCHO athletes improving in the Adaptation race (5.7 (5.6)%), while 6/7 LCHF athletes were slower (2.2 (3.4)%). Substrate utilisation returned to Baseline values after 5-6 days of HCHO diet. In summary, robust changes in exercise substrate use occurred in 5-6 days of extreme changes in CHO intake. However, adaptation to a LCHF diet plus acute restoration of endogenous CHO availability failed to restore high-intensity endurance performance, with CHO oxidation rates remaining blunted.
Keywords: athletic performance; ketogenic diet; sports nutrition.
© 2020 The Authors. The Journal of Physiology published by John Wiley & Sons Ltd on behalf of The Physiological Society.
Figures
Comment in
-
High-fat versus high-carbohydrate diets for optimal higher intensity endurance exercise performance: and the winner is….J Physiol. 2021 Feb;599(3):727-728. doi: 10.1113/JP280552. Epub 2020 Aug 18. J Physiol. 2021. PMID: 32776510 No abstract available.
-
Keto or carbo? Low- versus high-carbohydrate diets for fuelling elite endurance sport performance.J Physiol. 2021 Feb;599(3):731-732. doi: 10.1113/JP280787. Epub 2020 Oct 19. J Physiol. 2021. PMID: 33034381 No abstract available.
References
-
- Ataide‐Silva T, Ghiarone T, Bertuzzi R, Stathis CG, Leandro CG & Lima‐Silva AE (2016). CHO mouth rinse ameliorates neuromuscular response with lower endogenous CHO stores. Med Sci Sports Exerc 48, 1810‐1820. - PubMed
-
- Bone JL & Burke LM (2018). No difference in young adult athletes' resting energy expenditure when measured under inpatient or outpatient conditions. Int J Sport Nutr Exerc Metab 28, 464‐467. - PubMed
-
- Burke LM, Angus DJ, Cox GR, Cummings NK, Febbraio MA, Gawthorn K, Hawley JA, Minehan M, Martin DT & Hargreaves M (2000). Effect of fat adaptation and CHO restoration on metabolism and performance during prolonged cycling. J Appl Physiol 89, 2413‐2422. - PubMed
Publication types
MeSH terms
Substances
LinkOut - more resources
Full Text Sources
Miscellaneous