Functional and Structural Integrity of Frontoparietal Connectivity in Traumatic and Anoxic Coma
- PMID: 32697504
- PMCID: PMC7365681
- DOI: 10.1097/CCM.0000000000004406
Functional and Structural Integrity of Frontoparietal Connectivity in Traumatic and Anoxic Coma
Abstract
Objectives: Recovery from coma might critically depend on the structural and functional integrity of frontoparietal networks. We aimed to measure this integrity in traumatic brain injury and anoxo-ischemic (cardiac arrest) coma patients by using an original multimodal MRI protocol.
Design: Prospective cohort study.
Setting: Three Intensive Critical Care Units affiliated to the University in Toulouse (France).
Patients: We longitudinally recruited 43 coma patients (Glasgow Coma Scale at the admission < 8; 29 cardiac arrest and 14 traumatic brain injury) and 34 age-matched healthy volunteers. Exclusion criteria were disorders of consciousness lasting more than 30 days and focal brain damage within the explored brain regions. Patient assessments were conducted at least 2 days (5 ± 2 d) after complete withdrawal of sedation. All patients were followed up (Coma Recovery Scale-Revised) 3 months after acute brain injury.
Interventions: None.
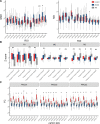
Measurements and main results: Functional and structural MRI data were recorded, and the analysis was targeted on the posteromedial cortex, the medial prefrontal cortex, and the cingulum. Univariate analyses and machine learning techniques were used to assess diagnostic and predictive values. Coma patients displayed significantly lower medial prefrontal cortex-posteromedial cortex functional connectivity (area under the curve, 0.94; 95% CI, 0.93-0.95). Cardiac arrest patients showed specific structural disturbances within posteromedial cortex. Significant cingulum architectural disturbances were observed in traumatic brain injury patients. The machine learning medial prefrontal cortex-posteromedial cortex multimodal classifier had a significant predictive value (area under the curve, 0.96; 95% CI, 0.95-0.97), best combination of subregions that discriminates a binary outcome based on Coma Recovery Scale-Revised).
Conclusions: This exploratory study suggests that frontoparietal functional disconnections are specifically observed in coma and their structural counterpart provides information about brain injury mechanisms. Multimodal MRI biomarkers of frontoparietal disconnection predict 3-month outcome in our sample. These findings suggest that fronto-parietal disconnection might be particularly relevant for coma outcome prediction and could inspire innovative precision medicine approaches.
Conflict of interest statement
Dr. Fourcade disclosed government work. Dr. Olivot received funding from Bristol Myers Squibb, Medtronic, and Pfizer. Dr. Naccache received support for article research from INSERM Sorbonne University ICM. The remaining authors have disclosed that they do not have any potential conflicts of interest.
Figures


Similar articles
-
Intrinsic Functional Connectivity Patterns Predict Consciousness Level and Recovery Outcome in Acquired Brain Injury.J Neurosci. 2015 Sep 16;35(37):12932-46. doi: 10.1523/JNEUROSCI.0415-15.2015. J Neurosci. 2015. PMID: 26377477 Free PMC article.
-
Neural signature of coma revealed by posteromedial cortex connection density analysis.Neuroimage Clin. 2017 May 6;15:315-324. doi: 10.1016/j.nicl.2017.03.017. eCollection 2017. Neuroimage Clin. 2017. PMID: 28560156 Free PMC article.
-
Brain Gray Matter MRI Morphometry for Neuroprognostication After Cardiac Arrest.Crit Care Med. 2017 Aug;45(8):e763-e771. doi: 10.1097/CCM.0000000000002379. Crit Care Med. 2017. PMID: 28272153 Free PMC article.
-
MRI for coma emergence and recovery.Curr Opin Crit Care. 2014 Apr;20(2):168-73. doi: 10.1097/MCC.0000000000000069. Curr Opin Crit Care. 2014. PMID: 24531655 Review.
-
Brain imaging in comatose survivors of cardiac arrest: Pathophysiological correlates and prognostic properties.Resuscitation. 2018 Dec;133:124-136. doi: 10.1016/j.resuscitation.2018.09.012. Epub 2018 Sep 19. Resuscitation. 2018. PMID: 30244045 Review.
Cited by
-
Functional neuroimaging in disorders of consciousness: towards clinical implementation.Brain. 2025 Jul 7;148(7):2283-2298. doi: 10.1093/brain/awaf075. Brain. 2025. PMID: 39997570 Free PMC article. Review.
-
Common Data Elements for Disorders of Consciousness: Recommendations from the Working Group on Neuroimaging.Neurocrit Care. 2023 Dec;39(3):611-617. doi: 10.1007/s12028-023-01794-2. Epub 2023 Aug 8. Neurocrit Care. 2023. PMID: 37552410
-
Fast and Slow Recovery of Consciousness Following Traumatic Brain Injury.Neurocrit Care. 2025 Jun 27. doi: 10.1007/s12028-025-02304-2. Online ahead of print. Neurocrit Care. 2025. PMID: 40579677
-
Correcting cardiorespiratory noise in resting-state functional MRI data acquired in critically ill patients.Brain Commun. 2022 Oct 31;4(6):fcac280. doi: 10.1093/braincomms/fcac280. eCollection 2022. Brain Commun. 2022. PMID: 36382222 Free PMC article.
-
Predicting neurologic recovery after severe acute brain injury using resting-state networks.J Neurol. 2023 Dec;270(12):6071-6080. doi: 10.1007/s00415-023-11941-6. Epub 2023 Sep 4. J Neurol. 2023. PMID: 37665382
References
-
- Shrestha GS, Suarez JI, Hemphill JC., III Precision medicine in neurocritical care. JAMA Neurol 2018; 75:1463–1464 - PubMed
-
- Giacino JT, Fins JJ, Laureys S, et al. Disorders of consciousness after acquired brain injury: The state of the science. Nat Rev Neurol 2014; 10:99–114 - PubMed
-
- Di Perri C, Bahri MA, Amico E, et al. Neural correlates of consciousness in patients who have emerged from a minimally conscious state: A cross-sectional multimodal imaging study. Lancet Neurol 2016; 15:830–842 - PubMed
-
- Di Perri C, Bastianello S, Bartsch AJ, et al. Limbic hyperconnectivity in the vegetative state. Neurology 2013; 81:1417–1424 - PubMed
Publication types
MeSH terms
LinkOut - more resources
Full Text Sources
Medical

