. 2020 Jul 22;12(14):14019-14036.
doi: 10.18632/aging.103505. Epub 2020 Jul 22.

Metformin administration during pregnancy attenuated the long-term maternal metabolic and cognitive impairments in a mouse model of gestational diabetes

Affiliations

Metformin administration during pregnancy attenuated the long-term maternal metabolic and cognitive impairments in a mouse model of gestational diabetes

Yalan Zhao et al. Aging (Albany NY). .

Abstract

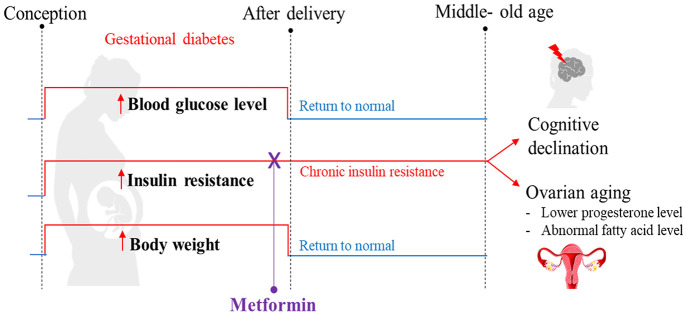
Background: Gestational diabetes mellitus (GDM) is a metabolic disease that can have long-term adverse effects on the cognitive function of mothers. In our study, we explored the changes in metabolic health and cognitive function in mice of middle- and old- age after exposure to GDM, and whether metformin therapy during pregnancy provided long-term benefits.

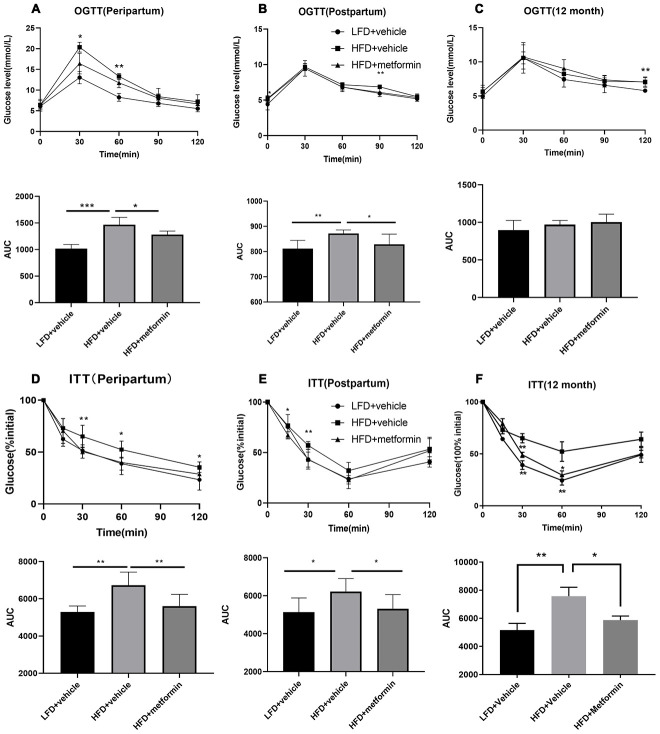
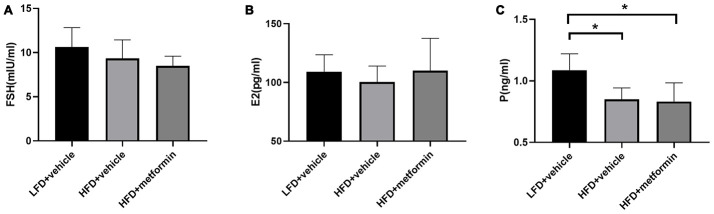
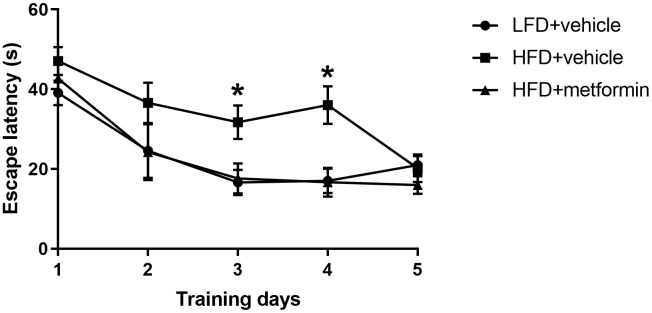
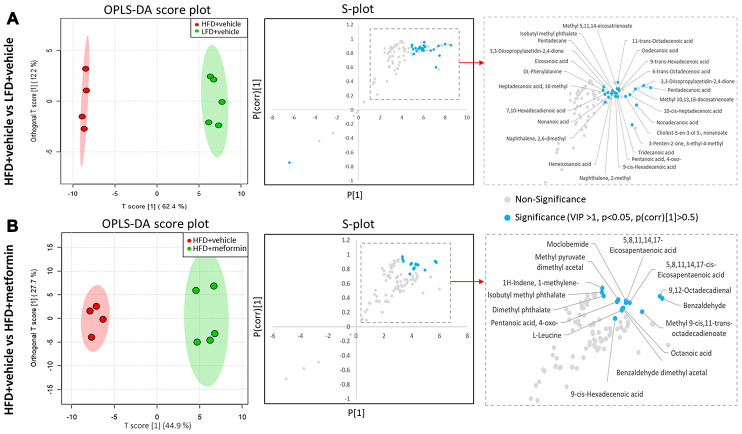
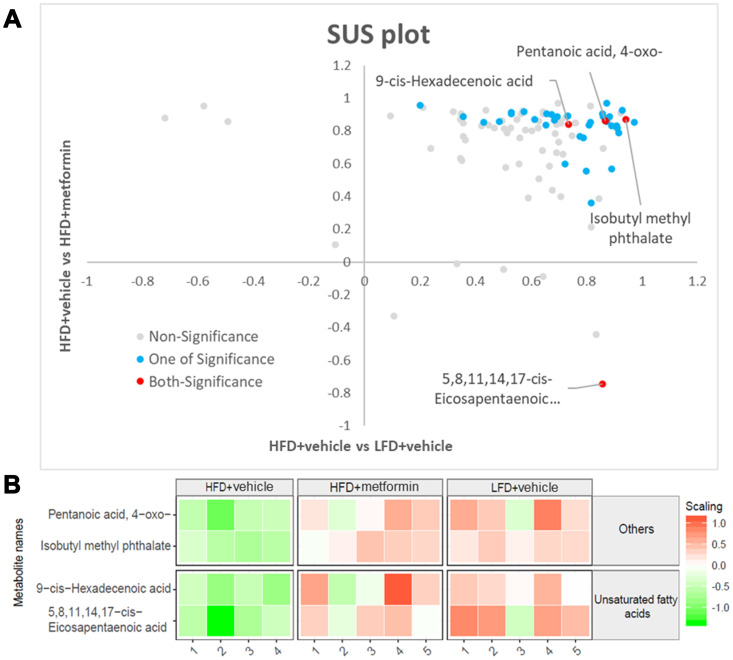
Results: Mice with GDM demonstrated significant cognitive impairment in old age, which was associated with insulin resistance. Gestational metformin therapy was shown to increase insulin sensitivity and improve cognition. The ovarian aging rate was also accelerated in mice exposed to GDM during pregnancy, which may be related to fatty acid metabolism in the ovaries.

Conclusion: Treatment with metformin during pregnancy was shown to improve fatty acid metabolism in ovarian tissues.

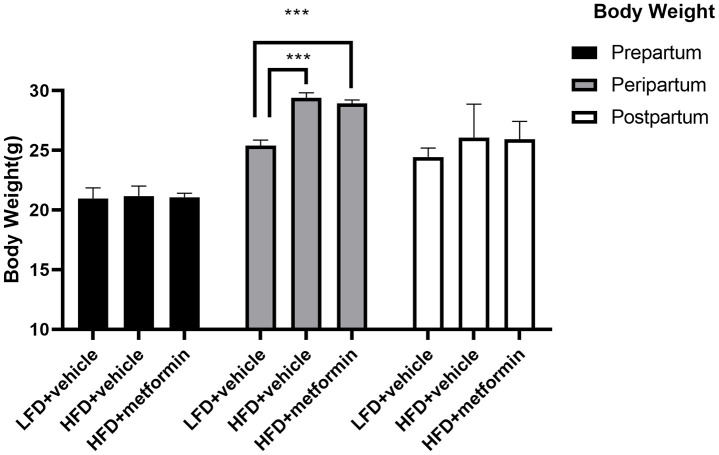
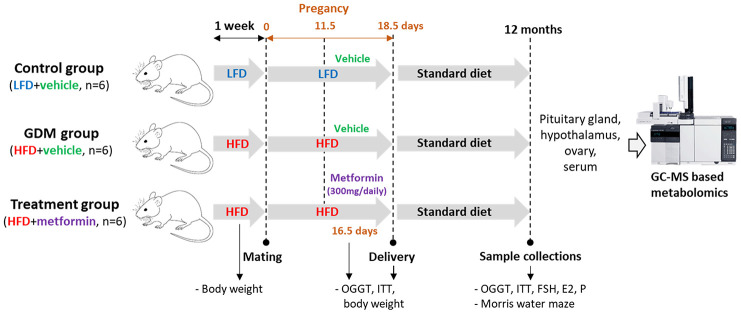
Method: During pregnancy, mice were fed with a high-fat diet (GDM group) or a low-fat diet (Control group), and a third group received metformin while receiving a high-fat diet (Treatment group). At 12 months old, the mice completed an oral glucose tolerance test, insulin tolerance test, Morris water maze test, female sex hormones were measured, and metabolite profiles of tissue from the ovaries, hypothalamus, and pituitary glands were analysed using gas chromatography-mass spectrometry.

Keywords: HPO-axis; cognitive impairment; gestational diabetes; insulin resistance; metformin.


Conflict of interest statement

CONFLICTS OF INTEREST: No potential conflicts of interest relevant to this article were reported.

Figures

Figure 1
Figure 1
The body weight of maternal mice before, during, and after pregnancy. ***p-value<0.001.
Figure 2
Figure 2
Oral glucose tolerance test (OGTT) and insulin tolerance test (ITT) results during pregnancy (16.5 days), after delivery, and at 12 months of age. OGTT curves for the three groups of mice and comparison of areas under the curve (AUC) during pregnancy (A), after delivery (B), and at 12 months of age (C). ITT curves for the three groups of mice and comparison of AUC during pregnancy (D), after delivery (E), and at 12 months of age (F). *p-value<0.05 versus HFD+vehicle. **p-value<0.01 versus HFD+vehicle.
Figure 3
Figure 3
The serum level of follicle-stimulating hormone (A), estrogen (B), and progesterone (C) at 12 months of age. *p-value <0.05.
Figure 4
Figure 4
Escape latency in the Morris water maze across five training days. *p-value<0.05 versus HFD+vehicle.
Figure 5
Figure 5
Principal component analysis of the hypothalamus (A), pituitary gland (B), and ovary (C) collected from maternal mice at 12 months of age. The color legends of experimental mice groups are listed as follows; Red color indicates maternal mice fed with a high-fat diet and metformin during pregnancy (HFD+metformin); Green color indicates maternal mice fed with a low-fat diet during pregnancy (LFD); Blue color indicates maternal mice fed with a high-fat diet during pregnancy (HFD).
Figure 6
Figure 6
Identification of significant metabolites in the ovary. (A) OPLS-DA and S-plot were used to detect metabolites that discriminated between HFD+vehicle (red) and LFD+vehicle (green). (B) OPLS-DA and S-plot were used to detect metabolites that discriminated between HFD+vehicle (red) and HFD+metformin (green). In S-plot, the blue circles indicate significant metabolites with a VIP of > 1, p-value <0.05, and P(corr) >0.5.
Figure 7
Figure 7
Significant ovary metabolites common to the LFD and metformin treatment groups. (A) SUS-plot. The red circles represent the metabolites common to both OPLS-DA models (LFD vs HFD and HFD+metformin vs HFD). The blue circles represent metabolites in at least one of the two OPLS-DA models. (B) The heatmap illustrates the levels of the final shortlisted metabolites in each group. The relative concentrations of metabolites were log2 transformed and Pareto scaled. Red color indicates a higher level, while green color indicates a lower level.
Figure 8
Figure 8
Summary of the proposed mechanism explaining how gestational diabetes mellitus (GDM) may lead to cognitive impairment and ovarian aging later in maternal life. Our high-fat diet (HFD) mouse model exhibited the pathophysiological phenotype that resembles GDM, including hyperglycemia, being overweight, and experiencing insulin resistance during pregnancy. After delivery, all mice were reverted back to a standard diet. In the postpartum period, the blood glucose level and body weight returned to normal, but insulin resistance persisted and reduced cognitive function was observed at 12 months of age. A reduced progesterone level was also observed; an early indication of perimenopause. Through metabolome profiling of the hypothalamus, pituitary gland, and ovarian (HPO) axis, a downstream dysregulation of the HPO axis was revealed. In particular, ovarian fatty acid levels were reduced. All these adverse outcomes were prevented when insulin resistance during pregnancy was treated with metformin. These phenotypes were not directly associated with hyperglycemia or high-fat diet during gestation, nor differences in bodyweight after pregnancy. Based on these observations, we hypothesize that persistent insulin resistance postpartum is the primary cause of GDM-related cognitive impairment and accelerated ovarian decline.
Figure 9
Figure 9
Overall experimental design.

References

    1. Caissutti C, Berghella V. Scientific evidence for different options for GDM screening and management: controversies and review of the literature. Biomed Res Int. 2017; 2017:2746471. 10.1155/2017/2746471 - DOI - PMC - PubMed
    1. Zhu W, Yang H, Wei Y, Wang Z, Li X, Wu H, Li N, Zhang M, Liu X, Zhang H, Wang Y, Niu J, Gan Y, et al. Comparing the diagnostic criteria for gestational diabetes mellitus of world health organization 2013 with 1999 in chinese population. Chin Med J (Engl). 2015; 128:125–27. 10.4103/0366-6999.147858 - DOI - PMC - PubMed
    1. Kc K, Shakya S, Zhang H. Gestational diabetes mellitus and macrosomia: a literature review. Ann Nutr Metab. 2015. (Suppl 2); 66:14–20. 10.1159/000371628 - DOI - PubMed
    1. Wendland EM, Duncan BB, Belizán JM, Vigo A, Schmidt MI. Gestational diabetes and pre-eclampsia: common antecedents? Arq Bras Endocrinol Metabol. 2008; 52:975–84. 10.1590/s0004-27302008000600008 - DOI - PubMed
    1. Jahan M, Mahbuba S, Shaha S, Akhter H, Ahsan GU, Islam T, Kuehl TJ, Uddin MN. ID: 57: Pre-gestational diabetes and preeclampsia in bangladeshi patients: a retrospective study. J Investig Med. 2016; 64:952–960. 10.1136/jim-2016-000120.99 - DOI

Publication types

MeSH terms