

An analysis of the domestic resumption of social production and life under the COVID-19 epidemic
- PMID: 32697812
- PMCID: PMC7375597
- DOI: 10.1371/journal.pone.0236387
An analysis of the domestic resumption of social production and life under the COVID-19 epidemic
Abstract
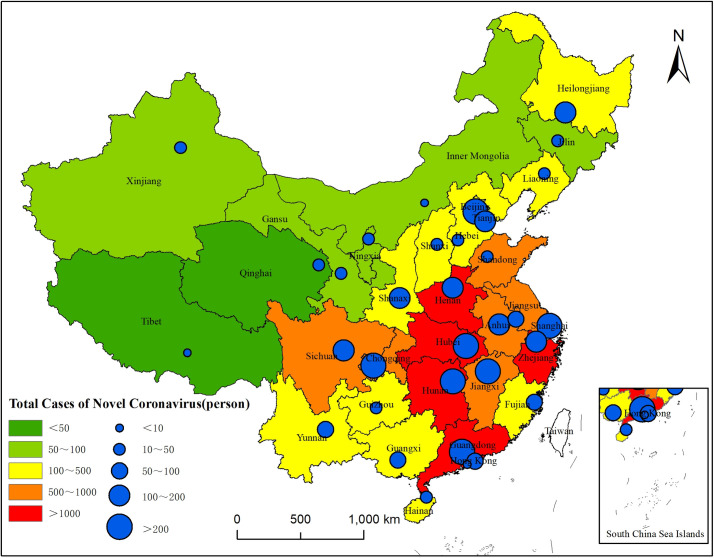
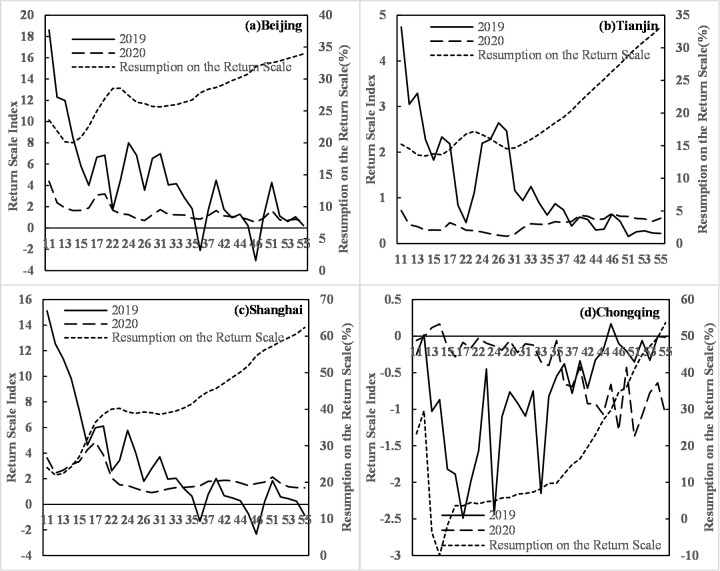
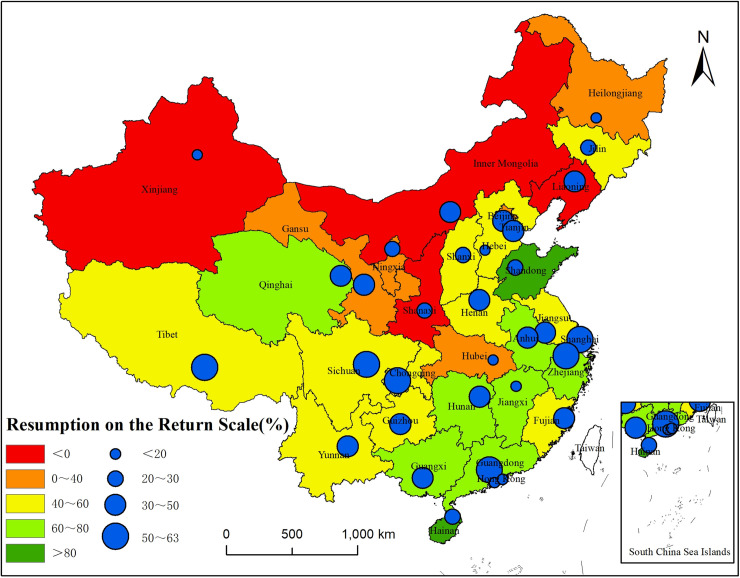
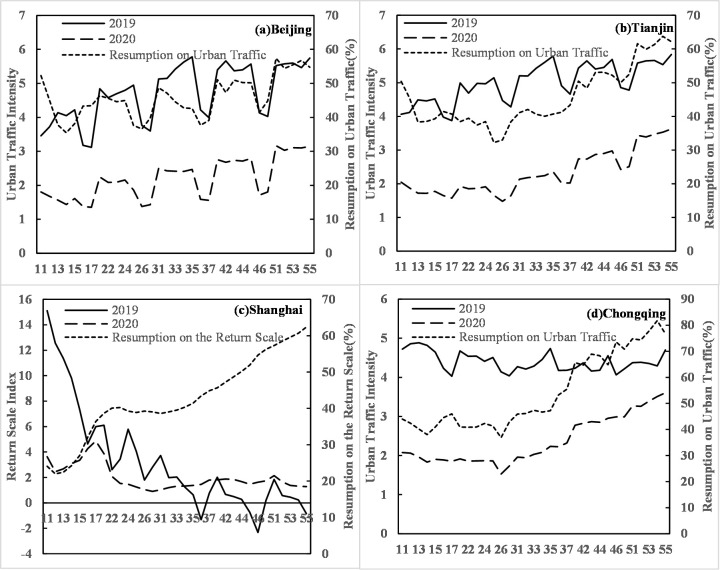
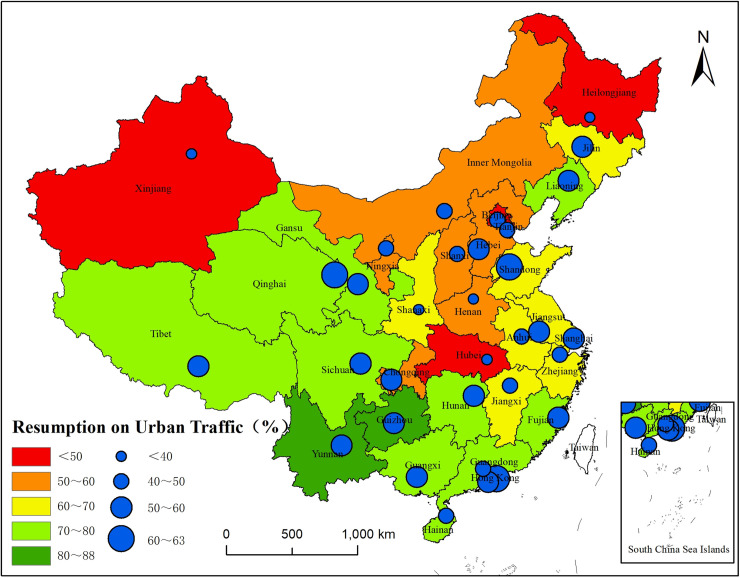
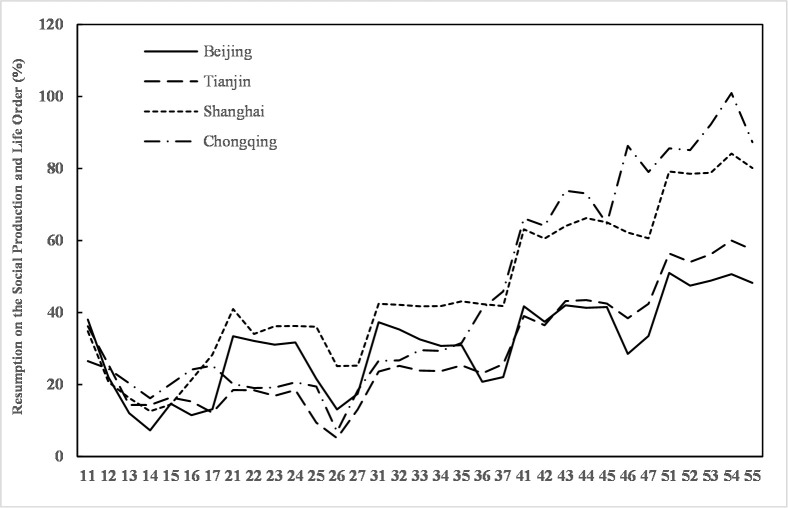
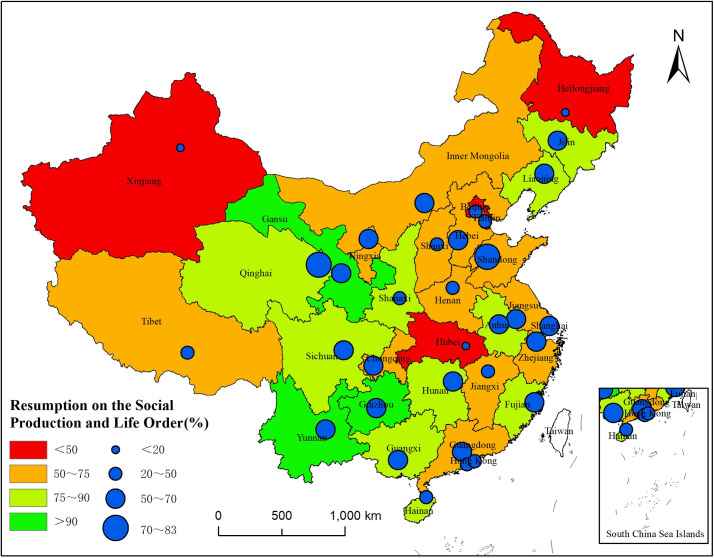
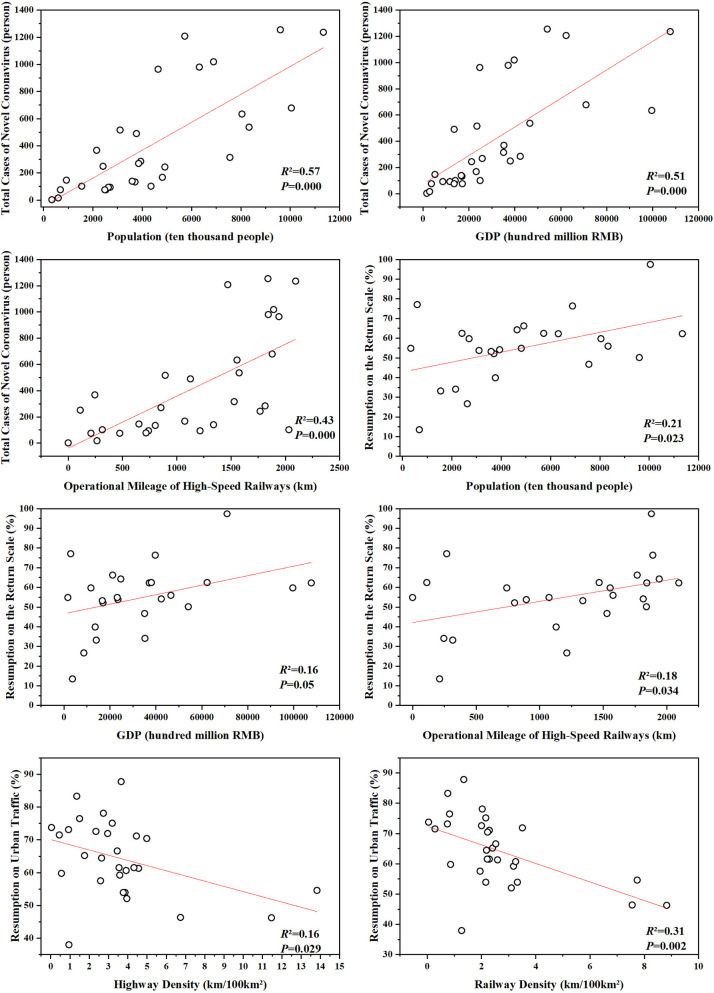
Population migration and urban traffic are two important aspects of the socioeconomic system. We analyze the trends of social production and resumption of life after the coronavirus disease 2019 (COVID-19)-influenced Spring Festival in 2020 with statistics on reported cases of COVID-19 from China's National Health Commission and big data from Baidu Migration (a platform collecting population migration data). We find that (1) the distribution of COVID-19 cases throughout mainland China has a specific spatial pattern. Provinces in eastern China have more reported cases than those in western China, and provinces adjacent to Hubei have more confirmed COVID-19 cases than nonadjacent provinces. Densely populated regions with well-developed economies and transportation are more likely to have cluster infection incidents. (2) The COVID-19 epidemic severely impacts the return of the migrant population in the Spring Festival travel rush, as demonstrated by the significant reduction in the return scale, along with the extended timespan and uncertainty regarding the end of the travel rush. Among 33 provinces, special administrative regions, autonomous regions and municipalities, 23 of them (approximately 70%) have a return rate below 60%. Hubei, Hong Kong, Xinjiang, and Inner Mongolia have the lowest return rates (below 5%), whereas the return rates in Hainan and Shandong, 272.72% and 97.35%, respectively, indicate the best trend of resumption. Due to government regulations, the population return in densely populated and well-developed regions shows a positive trend. (3) The resumption of urban traffic is slow and varies greatly in different regions. The urban traffic conditions in 22 provinces and municipalities have a more than 60% level of resumption. Guizhou and Yunnan have the highest level of resumption of urban traffic, whereas Xinjiang, Hubei, and Heilongjiang have the lowest (29.37%, 35.76%, and 37.90%, respectively). However, provinces and municipalities with well-developed intercity traffic have a lower level of resumption, mainly because of regulatory methods such as lockdowns and traffic restrictions. The increased public awareness of epidemic prevention and the decreased frequency of outdoor activities are also two positive factors slowing the spread of the epidemic. (4) Time will be necessary to fully resume social production and life throughout China. Xining and Jinan have the highest levels of resumption, 82.14% and 71.51%, respectively. Urumqi and Wuhan are the cities with the lowest levels of resumption, only 0.11% and 0.61%, respectively. Currently, 12 of 33 provinces and municipalities have levels of resumption of more than 80%; among them, Guizhou, Yunnan, and Gansu have with the highest levels of resumption and have nearly resumed the 2019 levels of work and life, whereas Xinjiang and Hubei have the lowest resumption rates, only 0.09% and 7.57%, respectively. Thus, relevant government departments should focus more on densely populated and well-developed provinces and cities when applying epidemic prevention and work resumption methods. We reveal the general conditions of the epidemic and the population return scale across China, along with urban traffic conditions and the resumption of social production and life under COVID-19, providing a scientific basis for local governments to make further decisions on work resumption.
Conflict of interest statement
The authors have declared that no competing interests exist.
Figures
Similar articles
-
Distribution of the COVID-19 epidemic and correlation with population emigration from Wuhan, China.Chin Med J (Engl). 2020 May 5;133(9):1044-1050. doi: 10.1097/CM9.0000000000000782. Chin Med J (Engl). 2020. PMID: 32118644 Free PMC article.
-
Massive migration promotes the early spread of COVID-19 in China: a study based on a scale-free network.Infect Dis Poverty. 2020 Aug 10;9(1):109. doi: 10.1186/s40249-020-00722-2. Infect Dis Poverty. 2020. PMID: 32778160 Free PMC article.
-
Correlation between the migration scale index and the number of new confirmed coronavirus disease 2019 cases in China.Epidemiol Infect. 2020 May 19;148:e99. doi: 10.1017/S0950268820001119. Epidemiol Infect. 2020. PMID: 32423504 Free PMC article.
-
China's practice to prevent and control COVID-19 in the context of large population movement.Infect Dis Poverty. 2020 Aug 19;9(1):115. doi: 10.1186/s40249-020-00716-0. Infect Dis Poverty. 2020. PMID: 32814591 Free PMC article.
-
[Suggestions on reforming and improving the prevention and treatment system for major epidemic diseases in China].Zhonghua Liu Xing Bing Xue Za Zhi. 2020 Jul 10;41(7):981-985. doi: 10.3760/cma.j.cn112338-20200407-00521. Zhonghua Liu Xing Bing Xue Za Zhi. 2020. PMID: 32340092 Chinese.
Cited by
-
Latest Effective Measures to Combat COVID-19: A Review.Iran J Public Health. 2021 Apr;50(4):640-648. doi: 10.18502/ijph.v50i4.5989. Iran J Public Health. 2021. PMID: 34183914 Free PMC article. Review.
-
Analyzing multiple COVID-19 outbreak impacts: A case study based on Chinese national air passenger flow.Transp Res Part A Policy Pract. 2023 Mar;169:103586. doi: 10.1016/j.tra.2023.103586. Epub 2023 Jan 17. Transp Res Part A Policy Pract. 2023. PMID: 36685313 Free PMC article.
-
Exploring the Public Health of Travel Behaviors in High-Speed Railway Environment during the COVID-19 Pandemic from the Perspective of Trip Chain: A Case Study of Beijing-Tianjin-Hebei Urban Agglomeration, China.Int J Environ Res Public Health. 2023 Jan 12;20(2):1416. doi: 10.3390/ijerph20021416. Int J Environ Res Public Health. 2023. PMID: 36674172 Free PMC article.
-
Spatiotemporal patterns of the COVID-19 control measures impact on industrial production in Wuhan using time-series earth observation data.Sustain Cities Soc. 2021 Dec;75:103388. doi: 10.1016/j.scs.2021.103388. Epub 2021 Sep 25. Sustain Cities Soc. 2021. PMID: 34608429 Free PMC article.
-
COVID-19: A Comparative Study of Population Aggregation Patterns in the Central Urban Area of Tianjin, China.Int J Environ Res Public Health. 2021 Feb 22;18(4):2135. doi: 10.3390/ijerph18042135. Int J Environ Res Public Health. 2021. PMID: 33671707 Free PMC article.
References
-
- Hu Y, Wang J, Dong Z. Analysis of the Decision to Resume Work During the Prevention and Control of COVID-19 Epidemic: Based on Behavioral Economics. Statistics & Decision. Available from:http://kns.cnki.net/kcms/detail/42.1009.c.20200309.1143.002.html
-
- Shen G. Impacts of the COVID-19 Epidemic on China’s Trade and Employment and Related Countermeasures. Journal of Shanghai University of International Business and Economics, 2020, 27(3):16–25.
-
- Chen R, Wang N, Zhao Y, Zhou Y. Complex Network Analysis of Inter-provincial Mobile Population Based on Improved Gravity Model. China Population, Resources and Environment, 2014, 24(10): 104–113.
-
- Zhao Z, Wei Y, Pang R, Yang R, Wang S. Spatiotemporal and structural characteristics of interprovincial population flow during the 2015 Spring Festival travel rush. Progress in Geography, 2017, 36(08): 952–964.
-
- Feng Z, Zhang Y, Wei Y, Zhao Z, Pang R, Wang S. Spatial-Temporal Pattern and Dynamic Mechanism of Population Flow of Changchun City During Chunyun Period Based on Baidu Migration Data. Economic Geography, 2019, 39(05): 101–109.
Publication types
MeSH terms
LinkOut - more resources
Full Text Sources
Medical
