. 2020 Oct 5;217(10):e20190613.
doi: 10.1084/jem.20190613.

PKM2 promotes Th17 cell differentiation and autoimmune inflammation by fine-tuning STAT3 activation

Affiliations

PKM2 promotes Th17 cell differentiation and autoimmune inflammation by fine-tuning STAT3 activation

Luis Eduardo Alves Damasceno et al. J Exp Med. .

Abstract

Th17 cell differentiation and pathogenicity depend on metabolic reprogramming inducing shifts toward glycolysis. Here, we show that the pyruvate kinase M2 (PKM2), a glycolytic enzyme required for cancer cell proliferation and tumor progression, is a key factor mediating Th17 cell differentiation and autoimmune inflammation. We found that PKM2 is highly expressed throughout the differentiation of Th17 cells in vitro and during experimental autoimmune encephalomyelitis (EAE) development. Strikingly, PKM2 is not required for the metabolic reprogramming and proliferative capacity of Th17 cells. However, T cell-specific PKM2 deletion impairs Th17 cell differentiation and ameliorates symptoms of EAE by decreasing Th17 cell-mediated inflammation and demyelination. Mechanistically, PKM2 translocates into the nucleus and interacts with STAT3, enhancing its activation and thereby increasing Th17 cell differentiation. Thus, PKM2 acts as a critical nonmetabolic regulator that fine-tunes Th17 cell differentiation and function in autoimmune-mediated inflammation.


Conflict of interest statement

Disclosures: The authors declare no competing interests exist.

Figures

Figure S1.
Figure S1.
Expression of signature genes of CD4 T cell subsets and differential expression of Pkm1 and Pkm2 among naive, effector/memory, and Th17 cells. (A) Naive CD4 T cells were isolated and cultured under Th1, Th2, Th17 or iT reg cells polarizing-conditions; cells were collected, and expression of Ifng, Il4, Il17a, and foxp3 was determined by RT-qPCR. (B) Naive (CD4+CD62LhiCD44lo) or effector/memory CD4 T cells (CD4+CD62LloCD44hi) were sorted from LNs and spleen of C57BL/6 WT mice (n = 3). Naive cells were also cultured under Th17 cell–polarizing conditions (96 h). Cells were collected, and total mRNA extracted for RT-qPCR analysis. (C) WT or CD4CrePkm2fl/fl CD4 T cells were differentiated into Th1 or Th17 cells for 96 h and collected for immunoblot analysis of PKM2 protein expression. β-actin was used as a loading control. (D and E) Rapamycin (0.1 µM), an mTOR inhibitor, was added to the Th17 cell cultures. Cells were collected and intracellularly stained for IL-17A and Foxp3, followed by flow cytometric analysis; Il17a and Foxp3 gene expression levels were determined by RT-qPCR (n = 3). For gene expression analysis, the cycle threshold values were normalized to Gapdh; fold change was calculated relative to naive cells (in A and B) or untreated cells (medium; in D and E). Data are representative of two independent experiments. Error bars show mean ± SEM. P values were determined by two-way ANOVA followed by Tukey’s post hoc test (B) or two-tailed Student’s t test (D and E). *, P < 0.05; ns, not significant.
Figure 1.
Figure 1.
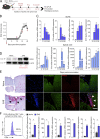
Th17 cell differentiation accompanies high PKM2 expression levels. (A) Pkm1 and Pkm2 gene expression were evaluated by RT-qPCR in freshly isolated CD4 T cells (naive) and polyclonally activated CD4 T cells (Th0) and Th1, Th2, Th17, and iT reg cells at 48 h after culture (n = 3). (B) Naive CD4 T cells were differentiated into Th17 cells, and gene expression of Pkm1 and Pkm2 was determined at different time points by RT-qPCR (n = 3). (C) Protein expression levels of PKM1 and PKM2 during Th17 cell differentiation were detected by immunoblot; β-actin was used as a loading control. (D) Th17 cells were differentiated in the presence or absence of IL-23, and PKM2 expression was determined by flow cytometry. MFI, mean fluorescence intensity. (E) Rapamycin (0.1 µM), an mTOR inhibitor, was added to the Th17 cell cultures. After 96 h, cells were collected, and the expression of Pkm1 and Pkm2 was determined by RT-qPCR. For gene expression analysis, the cycle threshold values were normalized to Gapdh; fold change was calculated relative to untreated cells (n = 3). (F) Rapamycin-treated Th17 cells were also collected for immunoblot analysis of PKM2 protein levels (n = 3). β-Actin was used as a loading control. Data are representative of two independent experiments. Error bars show mean ± SEM. P values were determined by one-way ANOVA followed by Tukey’s post hoc test (A and F), two-way ANOVA followed by Tukey’s post hoc test (B and D), or two-tailed Student’s t test (E). *, P < 0.05; ns, not significant.
Figure 2.
Figure 2.
PKM2 expression increases during EAE development. (A and B) EAE was induced in WT C57BL/6 mice by subcutaneous immunization with MOG35–55; the clinical score was evaluated throughout the days after immunization. (C) DLNs (top) and spinal cord samples (bottom) were collected at the indicated time points depicted in B (red arrows) for analysis of Pkm2, Il17a, Csf2, and Il23r gene expression by RT-qPCR (n = 7 per time point). Cycle threshold values were normalized to Gapdh. (D) PKM2 total protein levels in the spinal cord of EAE-bearing mice were determined by immunoblot; β-actin was used as a loading control. (E) Inflammatory cell infiltration was observed in the spinal cord by using H&E staining (left; black arrows). Scale bar indicates 500 and 50 µm. PKM2 protein expression in the spinal cord was analyzed by immunofluorescence (red); DAPI was used as a nuclear marker (blue), and myelin was stained with fluoromyelin stain probe (green; n = 3). Scale bar represents 50 µm. (F) Mononuclear cells were isolated from CNS of naive and EAE mice (n = 9 per group) followed by magnetic separation of CD4 T cells. Expression of Pkm2, Il17a, Csf2, Il23r, Rora, and Rorc was analyzed by RT-qPCR. Each sample was a pool of three mice. Cycle threshold values were normalized to Gapdh, and fold change was calculated relative to CNS CD45+ cells from naive mice. Data are representative of two (C, E, and F) or three (D) independent experiments. Error bars indicate mean ± SEM. P values were determined by two-tailed Student’s t test (C and F). *, P < 0.05.
Figure S2.
Figure S2.
T cell–specific PKM2 deletion in mice does not cause gross defects or affect glucose uptake, lactate production, and proliferation of CD4 T cells. (A) Photograph of spleen and LNs isolated from WT and CD4CrePkm2fl/fl mice (n = 3). (B) Flow cytometric analyses of thymic CD4+ and CD8+ frequencies (n = 3). (C and D) Proportion of activated (CD62LloCD44hi) and naive (CD62LhiCD44lo) CD4 T cells in LNs and spleen (n = 3). SSC, side scatter. (E) WT or PKM2-deficient Th17 cells differentiated in the presence or absence of IL-23 were incubated with 2-NBDG (30 µM) for 30 min. The glucose uptake ability of Th17 cells was evaluated by flow cytometry; MFI, mean fluorescence intensity. (F) Levels of lactate produced by Th17 cells were determined in culture supernatants (n = 3). (G) Naive CD4 T cells were labeled with 5 µM proliferation dye and then activated with anti-CD3ε/CD28 and cultured in the presence or absence of IL-2 for 72 h. Flow cytometric analyses were performed to determine their proliferative capacity (n = 3). Data are representative of two (E and F) or three (B–D) independent experiments. Error bars show mean ± SEM. P values were determined by two-tailed Student’s t test.
Figure 3.
Figure 3.
PKM2 deficiency does not alter Th17 cell metabolic reprogramming. (A) Naive CD4 T cells were obtained from CD4CrePkm2fl/fl or control littermates (WT) and cultured under Th17 cell–skewing conditions. (B) PKM1 protein expression in PKM2-deficient Th17 cells was determined by immunoblot; PKM2 deficiency was also confirmed by immunoblot analysis. (C) Th17 cells were harvested to evaluate the expression of glycolysis-related genes (Slc2a1, Ldha, Hif1a, and Pkm1) by RT-qPCR; data were normalized to Gapdh and fold change calculated relative to freshly isolated naive CD4 T cells (n = 3). (D) WT and PKM2-deficient Th17 cells were harvested at 96 h to determine protein levels of LDHA and HIF1α by immunoblot. β-Actin was used and loading control. (E) Th17 cells were incubated with a fluorescent glucose analogue (2-NBDG; 30 µM) for glucose uptake evaluation by flow cytometry; dotted lines indicate fluorescence-minus-one (FMO) control values (n = 3–4). MFI, mean fluorescence intensity. (F) Glucose consumption and lactate production were measured in Th17 cell-culture supernatants (n = 4–5). Data are representative of two (D, E and F) or three (B and C) independent experiments. Error bars show mean ± SEM. P values were determined by one-way ANOVA followed by Tukey’s post hoc test (C), two-way ANOVA followed by Tukey’s post hoc test (E), or two-tailed Student’s t test (F). *, P < 0.05; ns, not significant.
Figure 4.
Figure 4.
PKM2 deficiency impairs Th17 cell differentiation. (A) Naive CD4 T cells from WT or conditional knockout (CD4CrePkm2fl/fl) mice were stained with CellTrace Violet proliferation dye (CTV; 5 µM). Cells were then cultured under Th17 cell–skewing conditions and after 96 h cell proliferation was evaluated by flow cytometry; MFI, mean fluorescence intensity (n = 5). (B) Cells were stained with 5 µM eFluor 670 proliferation dye and cultured under Th17 cell–polarizing conditions for 96 h. Cells were intracellularly stained for IL-17A after 4 h of PMA/ionomycin stimulation (n = 3). (C) The expression of Th17 cell–signature genes was evaluated by RT-qPCR and displayed in a heatmap. Gene expression correlates with color intensity, data normalized by Z-score (row); cycle threshold values were normalized to Gapdh (n = 3). (D) Naive CD4 T cells from WT or CD4CrePkm2fl/fl were also differentiated in the presence of IL-23 and frequency of IL-17A+ CD4 T cell population determined by flow cytometry (n = 3). (E) Supernatants of Th17 cultures were collected, and IL-17A levels detected were by ELISA (n = 3). Data are representative of two (A–C) or more than five (D and E) independent experiments. Error bars indicate mean ± SEM. P values were determined by two-way ANOVA followed by Tukey’s post hoc test (D and E) or two-tailed Student’s t test (A and B). *, P < 0.05.
Figure S3.
Figure S3.
Loss of PKM2 in CD4 T cells does not impair Th1, Th2 or iT reg differentiation. (A) WT or PKM2-deficient CD4 T were cultured under Th17 cell–skewing conditions and stained for both IL-17A and Foxp3, followed by flow cytometric analysis (n = 5). (B–D) Naive CD4 T cells were also cultured under Th1, Th2, or iT reg-skewing conditions and analyzed for expression of IFNγ, IL-4, and Foxp3, respectively, by flow cytometry (n = 3). In addition, IFN-γ and IL-13 levels in supernatants of Th1 and Th2 cultures, respectively, were measured by ELISA (n = 3). (E) Naive CD4 T cells were cultured under Th1 or Th17 cell–polarizing conditions for 96 h. Intracellular staining for IFN-γ and GM-CSF in Th1 cells (top) and both IL-17A and GM-CSF in Th17 cells (bottom) was performed, followed by flow cytometric analysis (n = 5). Data are representative of at least three independent experiments. Error bars show mean ± SEM. P values were determined by two-tailed Student’s t test. *, P < 0.05.
Figure 5.
Figure 5.
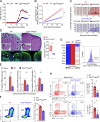
T cell–specific PKM2 deletion ameliorates autoimmune-mediated inflammation. (A–C) WT or CD4CrePkm2fl/fl mice were immunized with MOG35–55 and monitored daily for clinical signs (n = 18–24 per group). (A) Cumulative EAE clinical scores. (B) Representation by linear regression curves; dashed lines indicate the 95% confidence intervals. (C) Disease incidence by severity is represented on a bar chart as no EAE (score <1), mild EAE (score 1–2), and severe EAE (score ≥2.5). (D) Inflammatory cell infiltration in the spinal cord (top; black arrowheads) was observed by using H&E staining; the number of inflammatory cells in transverse spinal cord sections was determined in a blinded fashion (right; n = 7 per group). Scale bars represent 500 and 50 µm. Fluoromyelin staining (green) was performed to detect demyelination sites (bottom; white arrowheads); nuclei labeled with DAPI (blue). Scale bar indicates 50 µm. (E) Analysis of Il17a, Rora, and Rorc gene expression in DLN cells collected 6 d after immunization. Data were normalized to Gapdh; fold-change is relative to naive controls (n = 5 per group). (F) DLN cells were harvested 6 d after immunization and restimulated in vitro with MOG35–55; the frequencies of IL-17A+Rorγt+ CD4 T cells were then determined by flow cytometry (n = 3). (G) CNS-infiltrating CD4 T cells were isolated. Each sample was a pool of cells from two mice and analyzed for expression of Th17 cell–associated genes (n = 6 per group). Cycle threshold values were normalized to Gapdh; fold change is relative to CNS CD45+ cells from naive mice. Data were normalized by Z score (row) and depicted in a heatmap. (H) Spinal cord–infiltrating mononuclear cells were collected from WT and CD4CrePkm2fl/fl mice 15 d after immunization for flow cytometric analysis of IL-17A+ CD4 T cell populations coproducing GM-CSF or IFNγ (n = 5–8 per group). Data are pooled from three (A–C) or representative of two (E–H) or three (D) independent experiments. Error bars represent mean ± SEM. P values were determined by one-way ANOVA followed by Tukey’s post hoc test (E), two-way ANOVA followed by Tukey’s post hoc test (A and B), or two-tailed Student’s t test (D, F and H). *, P < 0.05.
Figure S4.
Figure S4.
PKM2 boosts Th17 cell-mediated EAE pathogenesis. (A) EAE was induced in WT or CD4CrePkm2fl/fl mice and DLN cells collected on day 15 (n = 5 per group). Cells were stimulated and intracellularly stained for IL-17A or Foxp3, followed by flow cytometric analysis. (B) DLN cells were harvested and restimulated with MOG35–55 in vitro for 72 h. The supernatants were collected, and the levels of IL-17A, GM-CSF, and IFN-γ were measured by ELISA (n = 5). (C) Lumbar spinal cord sections were collected from naive or EAE mice with PKM2 deficiency in CD4 T cells. Homogenates were obtained and mRNA extracted, followed by cDNA conversion; RT-qPCR was performed to analyze the expression of Il17a, Csf2, and Ifng. Gapdh was used for normalization (n = 5). (D) DLN cells were collected from WT or CD4CrePkm2fl/fl EAE mice (day 8) and cultured in the presence of MOG35-55 under Th17 cell–skewing conditions for 72 h. CD4 T cells were sorted and intravenously transferred (106) into Rag1−/− mice. 1 d later, EAE was induced in the recipient mice (n = 6 per group). Mice were monitored for clinical signs of EAE and CNS inflammatory cell infiltrate analyzed by H&E staining. Scale bar represents 50 µm. (E) PKM2 and phospho-PKM2 (Y105) protein levels in the spinal cord of EAE-bearing mice were determined by immunoblot. β-actin was used as a loading control. Data are representative of two (A–D) or three (E) independent experiments. Error bars show mean ± SEM. P values were determined by two-way ANOVA followed by Tukey’s post hoc test (B–D) and two-tailed Student’s t test (A). *, P < 0.05.
Figure 6.
Figure 6.
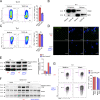
PKM2 translocates into the nucleus of Th17 cells. (A) The degree of PKM2 phosphorylation at Y105 was determined by immunoblot at different time points of Th17 cell culture; β-actin was used as a loading control. (B) Th0 or Th17 cells underwent protein cross-linking using disuccinimidyl suberate followed by immunoblot analysis to identify PKM2 oligomer states. (C) Naive CD4 T cells were cultured under Th17 cell–inducing conditions for 96 h and prepared for confocal immunofluorescence analysis. Cells were stained with fluorophore-conjugated anti-PKM2 (red) and nuclei labeled with DAPI (blue). Confocal images were acquired; scale bar indicates 5 µm. (D) Cytoplasmic and nuclear protein extracts from Th17 cell culture were obtained and analyzed by immunoblot to determine PKM2 levels in these compartments. GAPDH and NPM were used as cytoplasm and nuclear loading controls, respectively. (E) WT or PKM2-deficient CD4 T cells were cultured under Th17 cell–skewing conditions in the presence of or absence of TEPP-46 (100 µM), a PKM2 activator, followed by flow cytometry analysis of IL-17A+ CD4 T cells frequencies (n = 3–5). (F) Nuclear fractions from Th17 cells were obtained and analyzed by immunoblot to determine PKM2 protein expression. GAPDH and NPM were used as cytoplasm and nuclear loading controls, respectively. Data are representative of two independent experiments. Error bars are mean ± SEM. P values were determined by two-way ANOVA followed by Tukey’s post hoc test (E). *, P < 0.05.
Figure S5.
Figure S5.
STAT3 activation and PKM2 are dispensable for the generation of Th1 cells. (A) Naive CD4 T cells were cultured under Th17 cell–skewing conditions in the presence or absence of TEPP-46 (100 µM), followed by flow cytometric analysis (n = 3). (B and C) Th1 cells were differentiated with or without TEPP-46, and then cytoplasmic and nuclear fractions collected to determine PKM2 protein expression by immunoblot. NPM was used as a nuclear loading control. Flow cytometric analysis of Th1 cell differentiation was conducted (n = 3). (D) PLA assay was performed in WT or PKM2-deficient Th17 cells, followed by confocal microscopy analysis. The close proximity of STAT3 and PKM2 is represented in green. The blue signal indicates DAPI-stained nuclei. Scale bar indicates 10 µm. (E) WT or PKM2-deficient Th1 or Th17 cell lysates were subjected to immunoblot analysis of total and phospho-STAT3 (Y705) expression. GAPDH was used as a loading control. (F) STAT3 and phospho-STAT3 (Y705) levels were determined in spinal cords of WT or CD4CrePkm2fl/fl EAE-bearing mice by immunoblot analysis. β-Actin was used as a loading control. (G) Naive WT and PKM2-lacking Th1 cells were differentiated in the presence or absence of Stattic (2 µM); flow cytometric analysis of IFN-γ–producing cells was performed (n = 3). Data are representative of two (B–G) or three (A) independent experiments. Error bars show mean ± SEM. P values were determined by two-way ANOVA followed by Tukey’s post hoc test (G) and two-tailed Student’s t test (A and C). *, P < 0.05; ns, not significant.
Figure 7.
Figure 7.
Nuclear PKM2 regulates STAT3 activation in Th17 cells. (A) Immunofluorescence staining of intracellular PKM2 (red) and STAT3 (green) was performed in differentiated Th17 cells; nuclei were labeled with DAPI (blue). Confocal analysis was used for image acquisition. Scale bar represents 5 µm. (B) The interaction between STAT3 and PKM2 was examined by immunoprecipitation (IP). Briefly, Th17 cell lysates were subjected to IP with a mouse anti-STAT3 or control IgG antibody, followed by immunoblot analysis using a rabbit anti-PKM2 and anti-STAT3. Protein extracts without immunoprecipitation (input) served as positive controls. WB, Western blot. (C) PLA was performed to detect the interaction between PKM2 and STAT3 (in red) in differentiated Th17 cells. The blue signal indicates DAPI-stained nuclei. Confocal images were acquired; scale bar represents 5 µm. (D) WT or PKM2-deficient naive CD4 T cells were activated with anti-CD3ε:CD28 for 48 h. Cells were then acutely stimulated with recombinant mouse IL-6 (10 ng/ml) and collected 15 or 30 min later for immunoblot analysis. (E) Immunoblot was performed to identify total and phosphorylated (Y705) levels of STAT3 in WT or PKM2-deficient Th17 cells; β-actin was used as the loading control. (F) Immunoblot analysis of nuclear fraction from Th17 cells to determine phosphorylated STAT3 (Y705) protein expression. GAPDH and NPM were used as cytoplasm and nuclear loading controls, respectively. (G) Stattic (2 µM), an inhibitor of STAT3 activation, was added to Th17 cell cultures for 96 h, followed by flow cytometric analysis (n = 3). Data are representative of two (A–D, F, and G) or four (E) independent experiments. Error bars show mean ± SEM. P values were determined by two-way ANOVA followed by Tukey’s post hoc test (G) or two-tailed Student’s t test (E). *, P < 0.05.
Figure 8.
Figure 8.
Schematic representation describing how PKM2 induces Th17 cell differentiation. The cooperation between TCR activation and costimulatory signals per se leads to a significant increase of Pkm2 expression (1), which is highly augmented by the presence of IL-6 and IL-23, important cytokines for controlling the Th17 cell phenotype program. This cascade boosts the activity of the metabolic sensor mTOR that, in turn, contributes to Pkm2 transcription (2). IL-6R and IL-23R signaling cascade promote STAT3 phosphorylation/activation (3), concomitantly with an accumulation of PKM2 dimers in Th17 cells (4). The dimeric oligomer state facilitates PKM2 translocation into the nucleus (5) and its interaction with STAT3, increasing its transcriptional activity (6). This process culminates in enhanced transcription of Th17 cell–associated genes, contributing to the development of autoimmune neuroinflammation.

References

    1. Almeida L., Lochner M., Berod L., and Sparwasser T.. 2016. Metabolic pathways in T cell activation and lineage differentiation. Semin. Immunol. 28:514–524. 10.1016/j.smim.2016.10.009 - DOI - PubMed
    1. Anastasiou D., Yu Y., Israelsen W.J., Jiang J.-K., Boxer M.B., Hong B.S., Tempel W., Dimov S., Shen M., Jha A., et al. . 2012. Pyruvate kinase M2 activators promote tetramer formation and suppress tumorigenesis. Nat. Chem. Biol. 8:839–847. 10.1038/nchembio.1060 - DOI - PMC - PubMed
    1. Angiari S., Runtsch M.C., Sutton C.E., Palsson-McDermott E.M., Kelly B., Rana N., Kane H., Papadopoulou G., Pearce E.L., Mills K.H.G., et al. . 2020. Pharmacological Activation of Pyruvate Kinase M2 Inhibits CD4+ T Cell Pathogenicity and Suppresses Autoimmunity. Cell Metab. 31:391–405.e8. 10.1016/j.cmet.2019.10.015 - DOI - PMC - PubMed
    1. Bettelli E., Carrier Y., Gao W., Korn T., Strom T.B., Oukka M., Weiner H.L., and Kuchroo V.K.. 2006. Reciprocal developmental pathways for the generation of pathogenic effector TH17 and regulatory T cells. Nature. 441:235–238. 10.1038/nature04753 - DOI - PubMed
    1. Buck M.D., O’Sullivan D., and Pearce E.L.. 2015. T cell metabolism drives immunity. J. Exp. Med. 212:1345–1360. 10.1084/jem.20151159 - DOI - PMC - PubMed

Publication types

MeSH terms