. 2020 Sep 1;32(3):437-446.e5.
doi: 10.1016/j.cmet.2020.07.007. Epub 2020 Jul 17.

Elevated Glucose Levels Favor SARS-CoV-2 Infection and Monocyte Response through a HIF-1α/Glycolysis-Dependent Axis

Affiliations

Elevated Glucose Levels Favor SARS-CoV-2 Infection and Monocyte Response through a HIF-1α/Glycolysis-Dependent Axis

Ana Campos Codo et al. Cell Metab. .

Erratum in

  • Elevated Glucose Levels Favor SARS-CoV-2 Infection and Monocyte Response through a HIF-1α/Glycolysis-Dependent Axis.
    Codo AC, Davanzo GG, Monteiro LB, de Souza GF, Muraro SP, Virgilio-da-Silva JV, Prodonoff JS, Carregari VC, de Biagi Junior CAO, Crunfli F, Jimenez Restrepo JL, Vendramini PH, Reis-de-Oliveira G, Bispo Dos Santos K, Toledo-Teixeira DA, Parise PL, Martini MC, Marques RE, Carmo HR, Borin A, Coimbra LD, Boldrini VO, Brunetti NS, Vieira AS, Mansour E, Ulaf RG, Bernardes AF, Nunes TA, Ribeiro LC, Palma AC, Agrela MV, Moretti ML, Sposito AC, Pereira FB, Velloso LA, Vinolo MAR, Damasio A, Proença-Módena JL, Carvalho RF, Mori MA, Martins-de-Souza D, Nakaya HI, Farias AS, Moraes-Vieira PM. Codo AC, et al. Cell Metab. 2020 Sep 1;32(3):498-499. doi: 10.1016/j.cmet.2020.07.015. Cell Metab. 2020. PMID: 32877692 Free PMC article. No abstract available.

Abstract

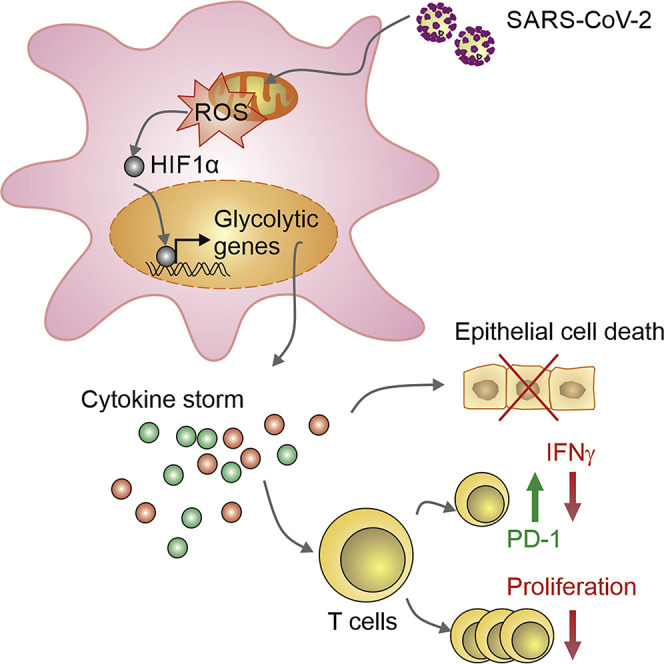
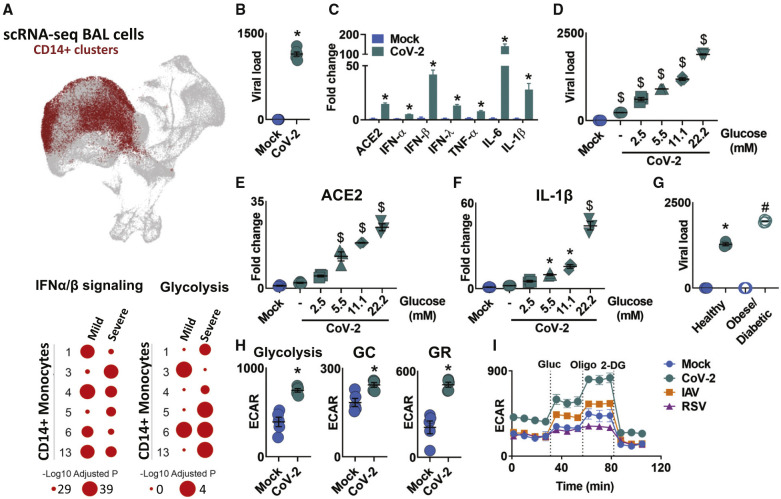
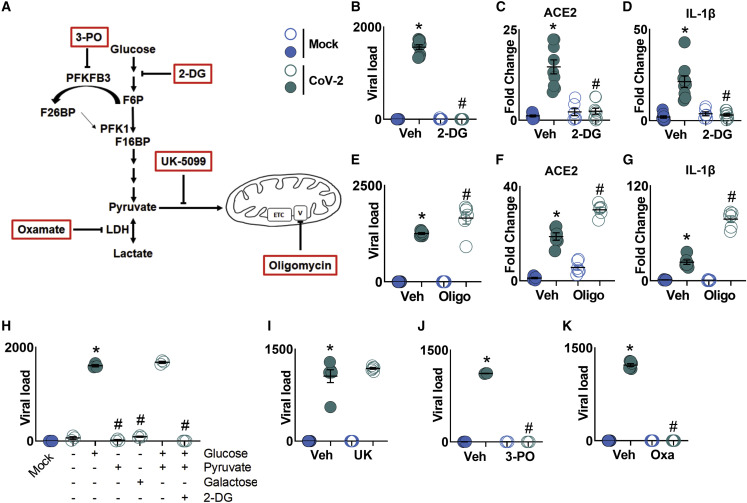
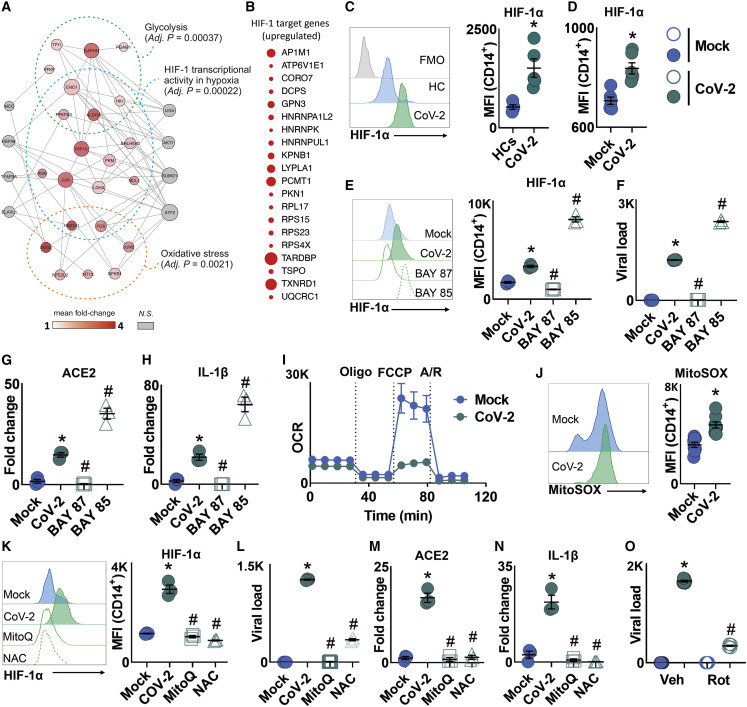
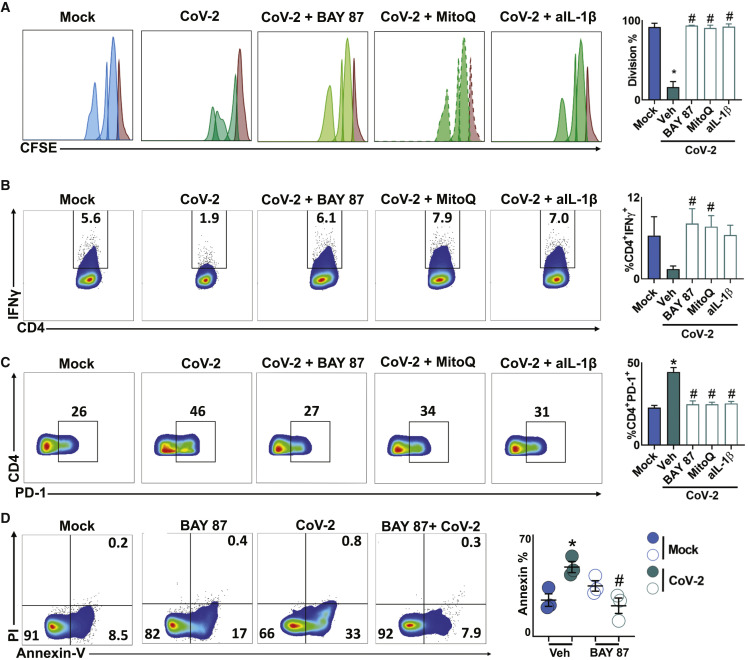
COVID-19 can result in severe lung injury. It remained to be determined why diabetic individuals with uncontrolled glucose levels are more prone to develop the severe form of COVID-19. The molecular mechanism underlying SARS-CoV-2 infection and what determines the onset of the cytokine storm found in severe COVID-19 patients are unknown. Monocytes and macrophages are the most enriched immune cell types in the lungs of COVID-19 patients and appear to have a central role in the pathogenicity of the disease. These cells adapt their metabolism upon infection and become highly glycolytic, which facilitates SARS-CoV-2 replication. The infection triggers mitochondrial ROS production, which induces stabilization of hypoxia-inducible factor-1α (HIF-1α) and consequently promotes glycolysis. HIF-1α-induced changes in monocyte metabolism by SARS-CoV-2 infection directly inhibit T cell response and reduce epithelial cell survival. Targeting HIF-1ɑ may have great therapeutic potential for the development of novel drugs to treat COVID-19.

Keywords: Covid-19; HIF-1alpha; SARS-CoV-2; diabetes; glycolysis; inflammation; interferon; metabolism; mitochondria; monocyte.


Conflict of interest statement

Declaration of Interests Authors declare no competing interests.

Figures

None
Graphical abstract
Figure 1
Figure 1
SARS-CoV-2 Infection Induces Glycolysis in Human Monocytes (A) Single-cell RNA-seq data showing CD14+ monocyte clusters expressing IFN-α and IFN-β in both mild and severe COVID-19 patients compared to healthy individuals. Enrichment of glycolysis in monocytes of severe COVID-19 patients. (B and C) Human monocytes were infected with mock control or SARS-CoV-2 (CoV-2) (MOI 0.1) for 1 h under continuous agitation and incubated for 24 h. (B) CoV-2 viral load in human monocytes. (C) Relative mRNA expression of ACE2, IFN-α, IFN-β, IFN-λ, TNF-α, IL-6, and IL-1β by qPCR. (D–F) Human monocytes were infected with mock control or CoV-2 (MOI 0.1) for 1 h under continuous agitation and rested for 24 h in media containing different glucose concentrations (0, 2.5, 5.5, 11.1, and 22.2 mM). (D) Analysis of viral load by qPCR. (E and F) Relative mRNA expression of (E) ACE2 and (F) IL-1β. (G) Peripheral blood mononuclear cells from healthy controls (Healthy) and obese/diabetic patients were infected with mock control or SARS-CoV-2 (CoV-2) (MOI 0.1) for 1 h under continuous agitation and incubated for 24 h; viral load was determined by qPCR. (H) Extracellular acidification rate (ECAR) analysis of glycolysis (following glucose injection), glycolytic capacity (GC; following oligomycin injection), and glycolytic reserve (GR; glycolytic capacity; glycolysis) in mock control or CoV-2-infected human monocytes. (I) ECAR of human monocytes upon glycolytic stress (following injections of glucose, oligomycin, and 2-DG) 24 h post-infection with CoV-2, RSV, and IAV. Data represent mean ± SEM of at least two independent experiments performed in triplicate. p < 0.05 compared to mock. $p < 0.05 compared to all other groups. #p < 0.05 compared to CoV-2 from healthy patients (one-way ANOVA and Tukey post hoc tests).
Figure 2
Figure 2
Glycolysis Sustains SARS-CoV-2 Replication in Human Monocytes Human monocytes were pre-treated for 2 h with metabolic modulators (PFKFB3 inhibitor 3-PO, glycolysis inhibitor 2-DG, mitochondrial pyruvate carrier inhibitor UK-5099 [UK], LDH-A inhibitor oxamate [OXA], and ATP synthase inhibitor oligomycin [Oligo]) prior to SARS-CoV-2 (CoV-2) infection (MOI 0.1) for 1 h under continuous agitation and incubation for 24 h. (A) Schematic of metabolism modulator mechanism of action. (B) Viral load by qPCR of infected monocytes pre-treated with 2-DG. (C and D) Relative mRNA expression of (C) ACE2 and (D) of IL-1β in infected monocytes pre-treated with 2-DG by qPCR. (E) Viral load by qPCR of infected monocytes pre-treated with Oligo. (F and G) Relative mRNA expression of (F) ACE2 and (G) IL-1β in monocytes treated with Oligo. (H) Human monocytes were given glucose, pyruvate, or galactose as a carbon source for ATP. 2-DG was used as a glucose metabolism inhibitor. These cells were infected for 1 h with CoV-2 (MOI 0.1), followed by incubation for 3 h; viral load was analyzed by qPCR. (I–K) Viral load in CoV-2-infected monocytes treated with (I) UK, (J) 3-PO, and (K) OXA by qPCR. All data represent mean ± SEM of at least two independent experiments performed in triplicate. p < 0.05 compared to mock. #p < 0.05 compared to CoV-2 (one-way ANOVA and Tukey post hoc tests).
Figure 3
Figure 3
mtROS/HIF-1α Axis Is Necessary for SARS-CoV-2 Replication in Human Monocytes (A) Single-cell RNA-seq data showing enrichment of HIF-1, glycolysis, and oxidative stress pathways in SARS-CoV-2 (CoV-2)-infected human monocytes. (B) Human monocytes were infected with mock control or CoV-2 (MOI 0.1) for 1 h under continuous agitation and incubated for 24 h. Enrichment of HIF-1α target genes in CoV-2-infected monocytes. (C) Peripheral blood mononuclear cells from healthy controls (HCs) and COVID-19 patients (CoV-2) were stained with CD14 plus HIF-1α, and HIF-1α was determined by flow cytometry. (D) Human monocytes were infected with mock control or CoV-2 (MOI 0.1) for 1 h under continuous agitation and incubated for 24 h. HIF-1α expression was assessed by flow cytometry on CD14+ monocytes. (E–H) Human monocytes were pre-treated for 2 h with HIF-1α stabilizer BAY85-3934 (BAY85) and inhibitor BAY87-2243 (BAY87) prior to CoV-2 infection (MOI 0.1) for 1 h under continuous agitation. (E and F) After 24 h, (E) HIF-1α expression was assessed by flow cytometry on CD14+ monocytes and (F) viral load was determined by qPCR. (G and H) Relative gene expression of (G) ACE2 and (H) IL-1β in CoV-2-infected human monocytes pre-treated with vehicle, BAY85, or BAY87. (I and J) Human monocytes were infected with mock control or CoV-2 (MOI 0.1) for 1 h under continuous agitation. (I) Real-time oxygen consumption rate (OCR) by human monocytes upon mitochondrial stress (MitoStress test: injections of oligomycin, FCCP, rotenone, and antimycin A) 24 h post-infection. (J) Mitochondrial superoxide (MitoSOX) production was assessed by flow cytometry on CD14+ monocytes 24 h post-infection. (K–N) Human monocytes were pre-treated for 2 h with antioxidant mitoquinol (MitoQ) or N-acetyl cysteine (NAC) prior to SARS-CoV-2 infection (MOI 0.1) for 1 h under continuous agitation. (K and L) After 24 h, (K) HIF-1α expression was assessed on CD14+ monocytes and (L) viral load was determined by qPCR. (M and N) Relative mRNA expression of (M) ACE2 and (N) IL-1β in mock/SARS-CoV-2-infected monocytes pre-treated with vehicle, MitoQ, or NAC. (O) Human monocytes were pre-treated for 2 h with rotenone (Rot) prior to CoV-2 infection (MOI 0.1) for 1 h under continuous agitation. After 24 h, viral load was determined by qPCR. All data are representative of at least two independent experiments performed in triplicate. Error bars represent mean ± SEM. p < 0.05 compared to mock. #p < 0.05 compared to CoV-2 (one-way ANOVA and Tukey post hoc tests).
Figure 4
Figure 4
Monocyte Metabolism Modulates T Cell and Epithelial Cell Response to SARS-CoV-2 (A–C) Human lymphocytes were isolated from peripheral blood, stained with CFSE, and cocultured with allogeneic peripheral blood mononuclear cells for 72 h in the presence of conditioned media from mock or SARS-CoV-2 (CoV-2) monocytes pre-treated with vehicle, BAY87-2243 (BAY87), and Mitoquinol (MitoQ). For the experiment with anti-IL-1β (aIL-1β), lymphocytes were given conditioned media from CoV-2-infected monocytes with aIL-1β. (A) Proliferation, (B) percentage of viable CD4+IFN-γ+ T cells, and (C) percentage of viable CD4+PD-1+ T cells were determined by flow cytometry and are shown by representative dot plots. Brown peak in the histograms represents non-proliferative population. Data represent mean ± SEM of at least two independent experiments performed in quadruplicate. p < 0.05 compared to mock. #p < 0.05 compared to CoV-2. (A–C) One-way ANOVA and Tukey post hoc tests. (B) Unpaired Student’s t test, CoV-2 versus BAY87 and CoV-2 versus MitoQ. (D) Human lung epithelial cell line A549 was cultured for 24 h in the presence of conditioned media from mock or CoV-2-infected monocytes pre-treated with vehicle or BAY87. Representative dot plots of cellular apoptosis by Annexin V/PI staining. Data represent mean ± SEM of at least two independent experiments performed in triplicate. p < 0.05 compared to mock. #p < 0.05 compared to CoV-2 (one-way ANOVA and Tukey post hoc tests).

Comment in

  • SARS-CoV-2 has a sweet tooth.
    Cavounidis A, Mann EH. Cavounidis A, et al. Nat Rev Immunol. 2020 Aug;20(8):460. doi: 10.1038/s41577-020-0368-4. Nat Rev Immunol. 2020. PMID: 32533110 Free PMC article. No abstract available.
  • Targeting glucose metabolism for treatment of COVID-19.
    Ardestani A, Azizi Z. Ardestani A, et al. Signal Transduct Target Ther. 2021 Mar 6;6(1):112. doi: 10.1038/s41392-021-00532-4. Signal Transduct Target Ther. 2021. PMID: 33677470 Free PMC article. No abstract available.

Similar articles

Cited by

References

    1. Aguer C., Gambarotta D., Mailloux R.J., Moffat C., Dent R., McPherson R., Harper M.E. Galactose enhances oxidative metabolism and reveals mitochondrial dysfunction in human primary muscle cells. PLoS One. 2011;6:e28536. - PMC - PubMed
    1. Baardman J., Verberk S.G.S., Prange K.H.M., van Weeghel M., van der Velden S., Ryan D.G., Wüst R.C.I., Neele A.E., Speijer D., Denis S.W. A defective pentose phosphate pathway reduces inflammatory macrophage responses during hypercholesterolemia. Cell Rep. 2018;25:2044–2052.e5. - PubMed
    1. Blanco-Melo D., Nilsson-Payant B.E., Liu W.-C., Uhl S., Hoagland D., Møller R., Jordan T.X., Oishi K., Panis M., Sachs D. Imbalanced host response to SARS-CoV-2 drives development of COVID-19. Cell. 2020;181:1036–1045.e9. - PMC - PubMed
    1. Bojkova D., Klann K., Koch B., Widera M., Krause D., Ciesek S., Cinatl J., Münch C. Proteomics of SARS-CoV-2-infected host cells reveals therapy targets. Nature. 2020 doi: 10.1038/s41586-020-2332-7. Published online May 14, 2020. - DOI - PMC - PubMed
    1. Bost P., Giladi A., Liu Y., Bendjelal Y., Xu G., David E., Blecher-Gonen R., Cohen M., Medaglia C., Li H. Host-viral infection maps reveal signatures of severe COVID-19 patients. Cell. 2020;181:1475–1488.e12. - PMC - PubMed

Publication types

MeSH terms

Substances