. 2020 Aug 6;182(3):672-684.e11.
doi: 10.1016/j.cell.2020.06.036. Epub 2020 Jul 21.

Somatic Evolution in Non-neoplastic IBD-Affected Colon

Affiliations

Somatic Evolution in Non-neoplastic IBD-Affected Colon

Sigurgeir Olafsson et al. Cell. .

Abstract

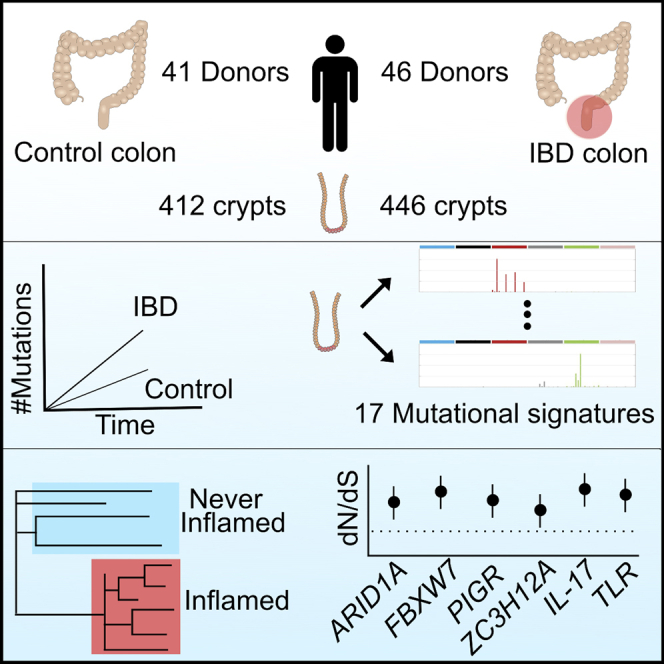
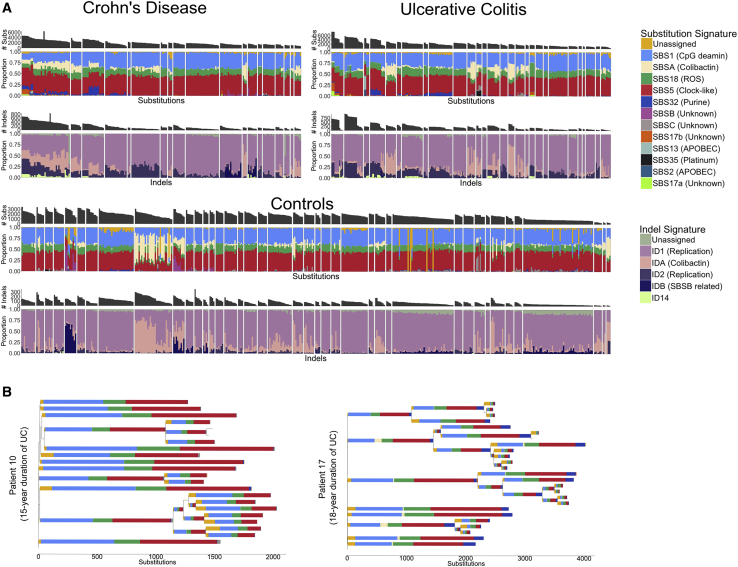
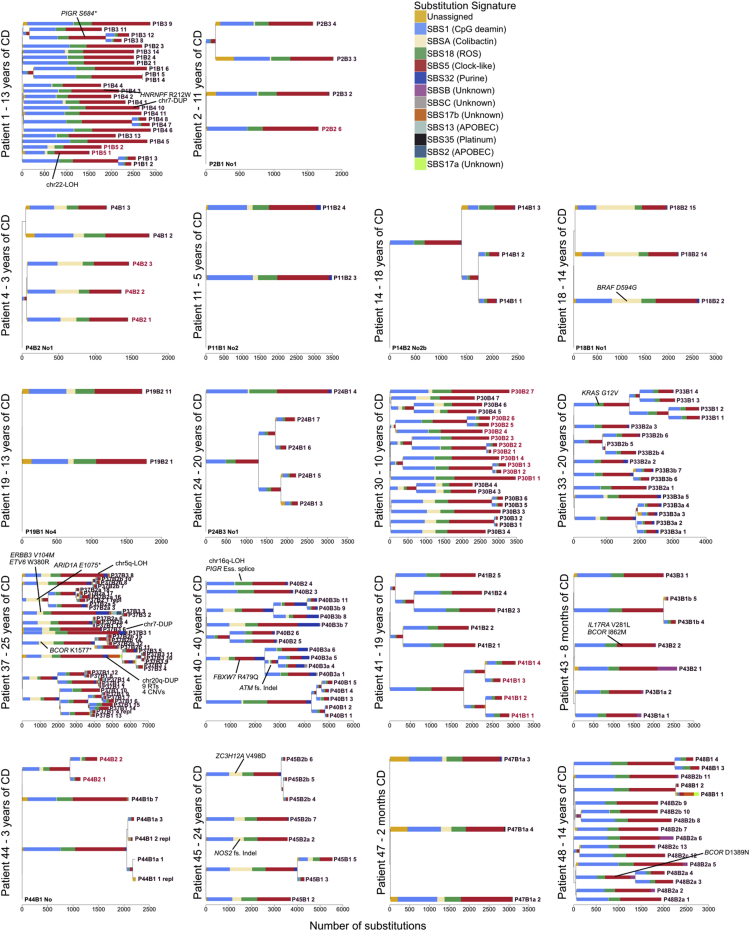
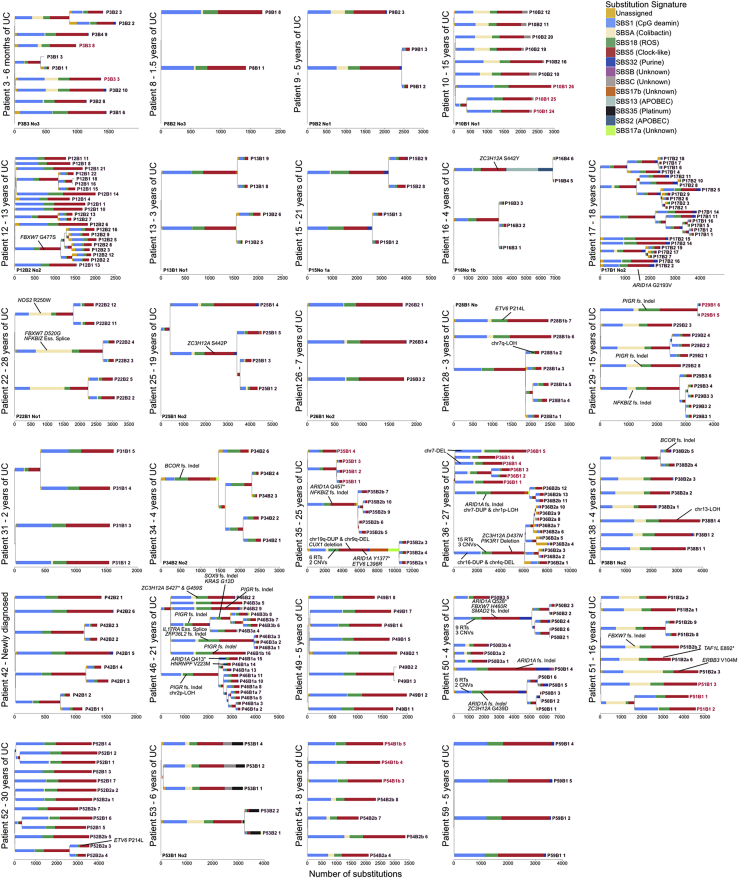
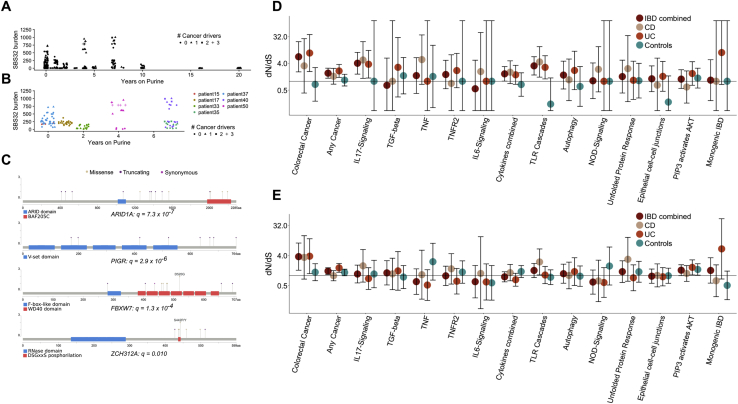
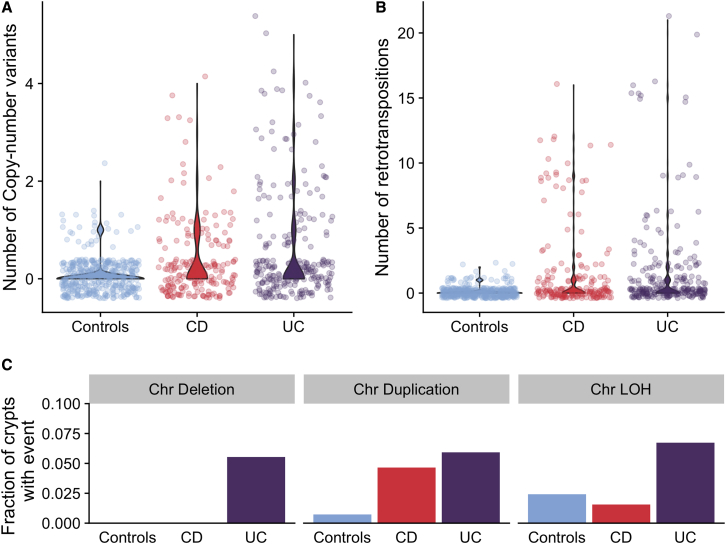
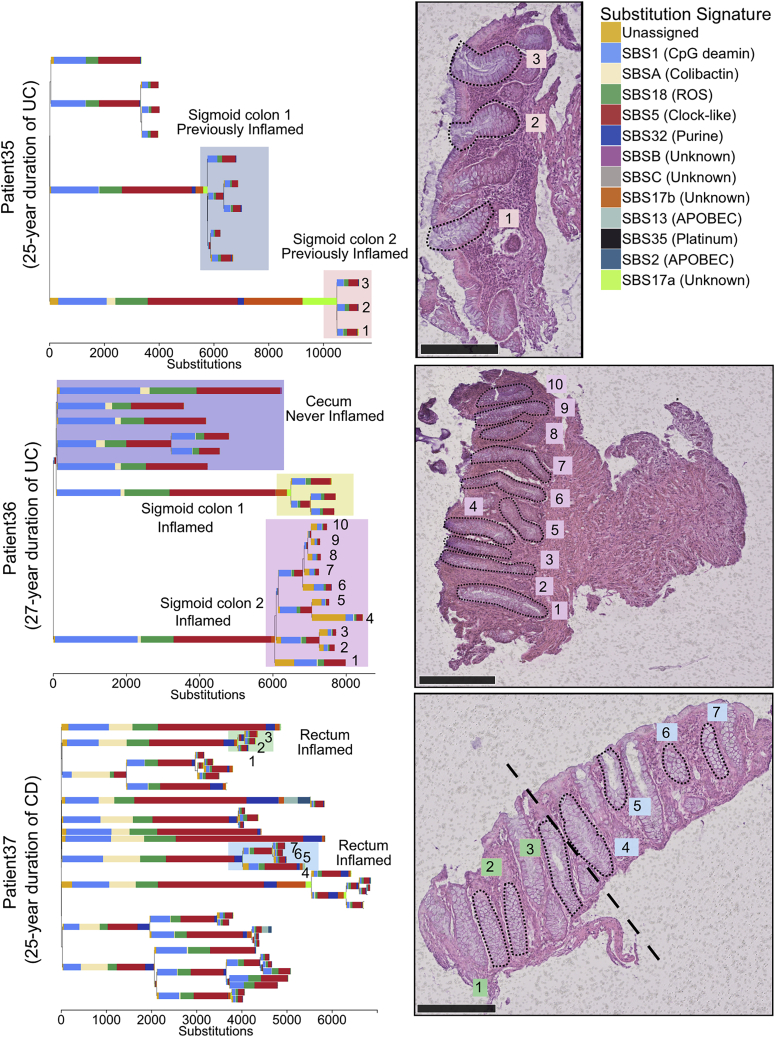
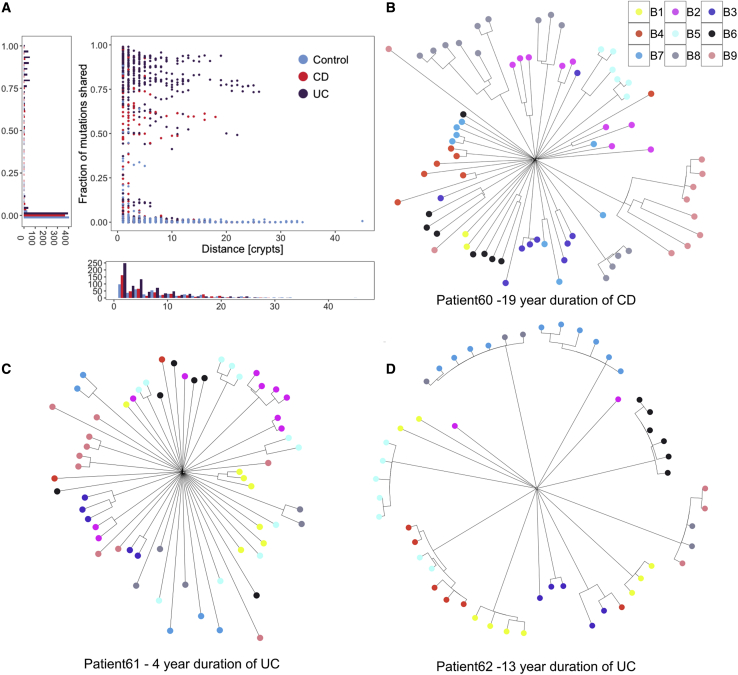
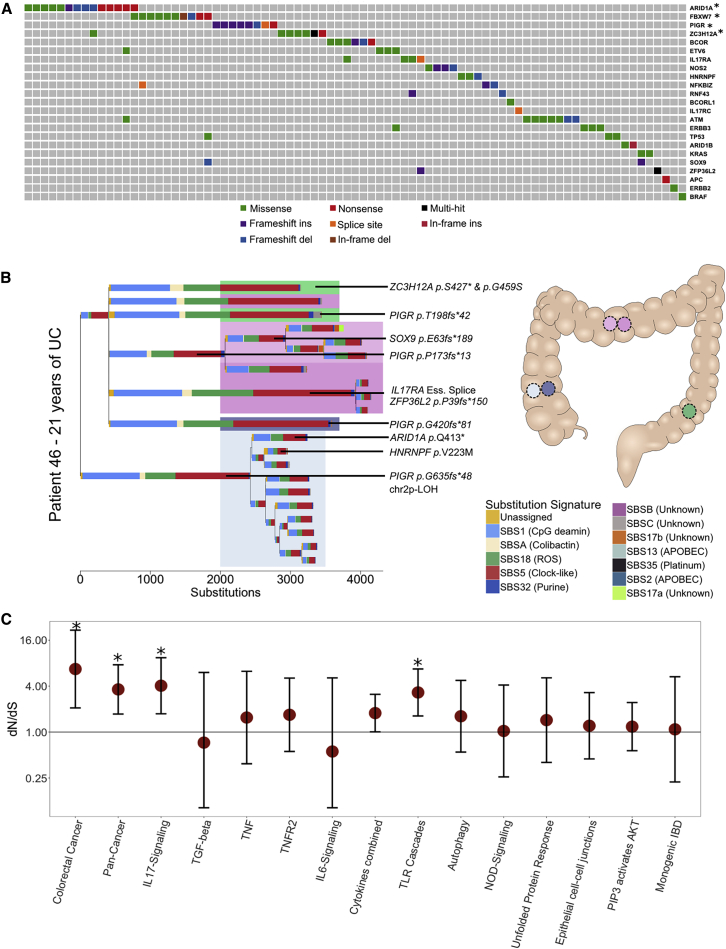
Inflammatory bowel disease (IBD) is a chronic inflammatory disease associated with increased risk of gastrointestinal cancers. We whole-genome sequenced 446 colonic crypts from 46 IBD patients and compared these to 412 crypts from 41 non-IBD controls from our previous publication on the mutation landscape of the normal colon. The average mutation rate of affected colonic epithelial cells is 2.4-fold that of healthy colon, and this increase is mostly driven by acceleration of mutational processes ubiquitously observed in normal colon. In contrast to the normal colon, where clonal expansions outside the confines of the crypt are rare, we observed widespread millimeter-scale clonal expansions. We discovered non-synonymous mutations in ARID1A, FBXW7, PIGR, ZC3H12A, and genes in the interleukin 17 and Toll-like receptor pathways, under positive selection in IBD. These results suggest distinct selection mechanisms in the colitis-affected colon and that somatic mutations potentially play a causal role in IBD pathogenesis.

Keywords: Crohn's disease; IL17; PIGR; ZC3H12A; inflammatory bowel disease; intestinal epithelia; mutation rate; mutational signatures; somatic mutations; ulcerative colitis.


Conflict of interest statement

Declaration of Interests C.A.A. is a paid consultant for Genomics plc and Bristol-Myers Squibb. All other authors declare no competing interests.

Figures

None
Graphical abstract
Figure S1
Figure S1
Clonality, Coverage, and Sensitivity of Crypts and Mutations Calls, Related to Figure 1 (A) The median variant allele fraction (VAF) of mutations called in each crypt. (B) The median coverage of sequenced crypts. (C) Internal analysis of CaveMan sensitivity. The dashed lines show interpolation of the sensitivity given the median coverage of cases (18.2X - 97% sensitivity) and controls (16.3X - 95% sensitivity). The yellow dots represent biological duplicates where sensitivity was estimated by dissecting and sequencing the same crypts twice (STAR Methods). (D) VAFs of variants called in crypts that were sequenced twice (referred to as sample 1). Each dot represents a variant. The VAFs are compared against variants called in unrelated crypts (top) and in biological duplicates (bottom). The high concordance between biological duplicates but not between unrelated samples suggests high specificity.
Figure 1
Figure 1
Mutation Burden in the IBD Colon (A) Substitution (top) and indel (bottom) burden as a function of age. Each point represents a colonic crypt and is colored by disease status. The line shows the effect of age on mutation burden as estimated by fitting a linear mixed effects model, correcting for sampling location, sequencing coverage, and the within-biopsy and within-patient correlation structure, considering both IBD cases and controls. The shaded area represents the 95% confidence interval of the age effect estimate. (B) Estimated excess of substitutions (top) and indels (bottom) in crypts from IBD patients as function of disease duration. Shaded area represents the 95% confidence interval. (C) A comparison of the effects of age and disease duration on the total mutation burden and on the burden of mutational signatures that associate with IBD duration. Error bars represent the 95% confidence intervals of the estimates. IBD, inflammatory bowel disease; CD, Crohn’s disease; UC, ulcerative colitis; SBS, single base substitution signature; ID, indel signature. See also Tables S1 and S2.
Figure S2
Figure S2
Features of Mutational Signatures Extracted, Related to Figure 2 (A) Cosine-similarities between mutational signatures extracted by hdp compared with published PCAWG signatures. (B) Correlations between identified signatures.
Figure 2
Figure 2
Mutational Signatures in Colonic Crypts (A) A stacked barplot showing the proportional contribution of single-base-substitution (SBS) signatures (top) and indel (ID) signatures (bottom) to the mutation burden of each crypt. Crypts are grouped by patient and crypts from CD, UC, and controls are shown separately. Signature nomenclature is the same as in Alexandrov et al. (2020). The “Unassigned” component represents uncertainty of the signature extraction. (B) Phylogenetic trees of two patients with widespread ulcerative colitis. The colors of the branches reflect the relative contribution of each mutational signature extracted for those branches as in (A). The patient on the left has received azathioprine treatment for 10 years but shows no SBS32 burden (dark blue). In contrast, the patient on the right received azathioprine for 2 weeks and mercaptopurine for 2 weeks and had significant adverse reactions to both drugs. SBS32 is found in most crypts from this patient. All crypts are from inflamed biopsies. See also Figure S2 and Table S2.
Figure S3
Figure S3
Phylogenetic Trees for All Crohn’s Disease Patients, Related to Figures 2, 4, and 6 Mutational signatures are overlaid on the trees and putative driver mutations are mapped to the branch in which they occur. Crypts are labeled on the form PXBY_Z where PX is the patient number, BY the biopsy number (with a,b and c denoting biopsies taken a few millimeters apart from the same site) and Z is the crypt number. The crypts labeled in red are from never-inflamed regions of the colon.
Figure S4
Figure S4
Phylogenetic Trees for All Ulcerative Colitis Patients, Related to Figures 2, 4, and 6 Mutational signatures are overlaid on the trees and putative driver mutations are mapped to the branch in which they occur. Crypts are labeled on the form PXBY_Z where PX is the patient number, BY the biopsy number (with a,b and c denoting biopsies taken a few millimeters apart from the same site) and Z is the crypt number. The crypts labeled in red are from never-inflamed regions of the colon.
Figure S5
Figure S5
Driver Mutations and Positive Selection, Related to Figure 6 (A) Burden of the purine-signature, SBS32, as a function of the duration of purine treatment. (B) Burden of the purine-signature in patients where at least one crypt has over 150 mutations attributed to purine treatment. Large within-patient variation is apparent. (C) A lollipop plot showing the location of mutations found in genes that are enriched for non-synonymous coding mutations in the IBD dataset. (D) Pathway-level dN/dS ratios for mutations in known cancer genes and cellular pathways important in IBD pathogenesis. The plot shows dN/dS for truncating mutations. Same as Figure 6C but also showing the ratios for controls and ratios obtained when analysis is restricted to Crohn’s disease or ulcerative colitis crypts. Error bars represent 95% confidence intervals. (E) same as (D) but showing dN/dS ratios for missense mutations.
Figure 3
Figure 3
Burden of Structural Variants in Inflammatory Bowel Disease-Affected Colon Compared with IBD-Unaffected Colon (A) Number of copy number variants in IBD sub-types compared with controls. (B) Number of somatic retrotranspositions in IBD subtypes compared with controls. (C) Fraction of crypts with inflammation history that carry chromosomal aneuploidies. See also Table S3.
Figure 4
Figure 4
Examples of Clonal Expansions in Three IBD Patients Top: a phylogenetic tree of crypts sampled from a 66-year-old patient with a 25-year history of ulcerative colitis. The accompanying biopsy image shows the crypts from the orange shaded area. The clones highlighted in blue and orange come from the same previously inflamed site and were millimeters apart. A large difference in the mutation burden of these clones is driven by a local activation of signatures 17a and 17b in the orange shaded clone. Middle: a phylogenetic tree of crypts sampled from a 61-year-old patient with a 27-year history of ulcerative colitis. The clones highlighted in purple and yellow come from biopsies taken millimeters apart. The accompanying biopsy image shows the crypts from the purple clone. Bottom: a phylogenetic tree of crypts sampled from a 37-year-old patient with a 25-year history of Crohn’s disease affecting the colon. A biopsy overlaps two clones (in blue and green). Scale bars, 250 μm. See also Figures S3 and S4.
Figure 5
Figure 5
Clonal Structure of the IBD Colon (A) For pairs of crypts from the same biopsy, the figure shows the number of mutations that are shared between a pair as a fraction of the average mutation burden of the two crypts, and this is plotted as a function of the distance between the pair. (B) A phylogenetic tree showing crypts sampled from 9 biopsies from the sigmoid colon of a 36-year-old male diagnosed with Crohn’s disease 19 years prior to sampling. Biopsies were taken 1 cm apart in a three by three grid for all the patients in (B)-(D). (C) A phylogenetic tree showing crypts sampled from 9 biopsies from the rectum of a 71-year-old male diagnosed with ulcerative colitis 4 years prior to sampling. (D) A phylogenetic tree showing crypts sampled from 9 biopsies from the rectum of a 42-year-old female diagnosed with ulcerative colitis 13 years prior to sampling. See also Figures S3 and S4.
Figure 6
Figure 6
Driver Mutations and Positive Selection in IBD (A) An oncoplot showing the distribution of potential driver mutations mapped to branches of phylogenetic trees. Each column represents a branch of a phylogenetic tree and a mutation may be found in multiple crypts if the branch precedes a clonal expansion. Branches without potential drivers are not shown for simplicity. Genes showing significant enrichment of non-synonymous mutations after Benjamini-Hochberg correction for multiple testing (q < 0.05). (B) A phylogenetic tree of the crypts dissected from a 38-year-old male suffering from ulcerative colitis for 21 years. Crypts are dissected from five biopsies from three previously inflamed sites of the colon. Crypts carrying distinct PIGR truncating mutations are found in four of the biopsies and in all three colonic sites. (C) Pathway-level dN/dS ratios for truncating mutations in known cancer genes and cellular pathways important in IBD pathogenesis. Error bars represent 95% confidence intervals. *q < 0.05 after Benjamini-Hochberg correction for multiple testing. See also Figure S5 and Tables S4, S5, and S6.

References

    1. Adami H.-O., Bretthauer M., Emilsson L., Hernán M.A., Kalager M., Ludvigsson J.F., Ekbom A. The continuing uncertainty about cancer risk in inflammatory bowel disease. Gut. 2016;65:889–893. - PMC - PubMed
    1. Alexandrov L.B., Nik-Zainal S., Wedge D.C., Aparicio S.A., Behjati S., Biankin A.V., Bignell G.R., Bolli N., Borg A., Børresen-Dale A.L., Australian Pancreatic Cancer Genome Initiative. ICGC Breast Cancer Consortium. ICGC MMML-Seq Consortium. ICGC PedBrain Signatures of mutational processes in human cancer. Nature. 2013;500:415–421. - PMC - PubMed
    1. Alexandrov L.B., Kim J., Haradhvala N.J., Huang M.N., Tian Ng A.W., Wu Y., Boot A., Covington K.R., Gordenin D.A., Bergstrom E.N., PCAWG Mutational Signatures Working Group. PCAWG Consortium The repertoire of mutational signatures in human cancer. Nature. 2020;578:94–101. - PMC - PubMed
    1. Arthur J.C., Perez-Chanona E., Mühlbauer M., Tomkovich S., Uronis J.M., Fan T.J., Campbell B.J., Abujamel T., Dogan B., Rogers A.B. Intestinal inflammation targets cancer-inducing activity of the microbiota. Science. 2012;338:120–123. - PMC - PubMed
    1. Baker A.-M., Cross W., Curtius K., Al Bakir I., Choi C.-H.R., Davis H.L., Temko D., Biswas S., Martinez P., Williams M.J. Evolutionary history of human colitis-associated colorectal cancer. Gut. 2019;68:985–995. - PMC - PubMed

Publication types

MeSH terms