. 2020 Jul 21;32(3):107917.
doi: 10.1016/j.celrep.2020.107917.

The Human Integrator Complex Facilitates Transcriptional Elongation by Endonucleolytic Cleavage of Nascent Transcripts

Affiliations

The Human Integrator Complex Facilitates Transcriptional Elongation by Endonucleolytic Cleavage of Nascent Transcripts

Felipe Beckedorff et al. Cell Rep. .

Abstract

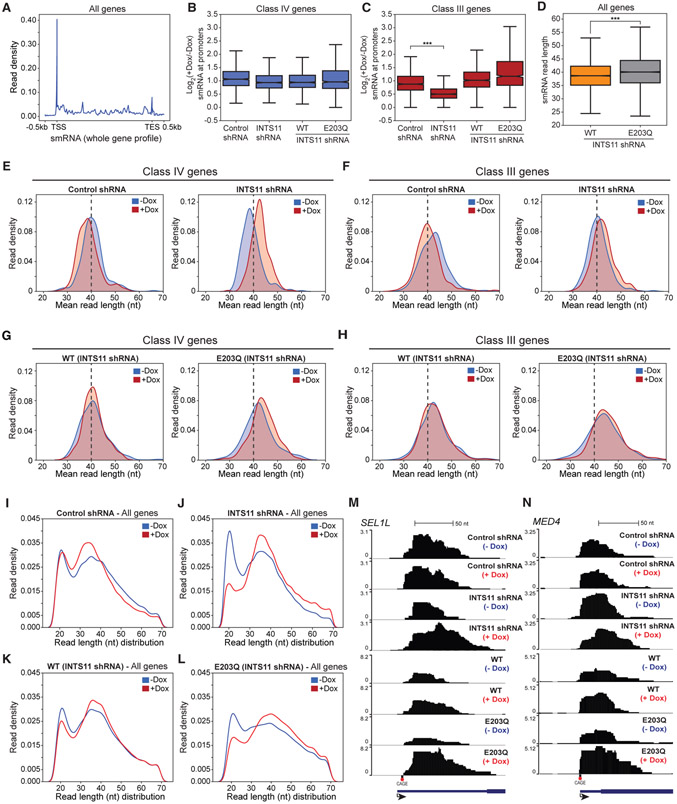
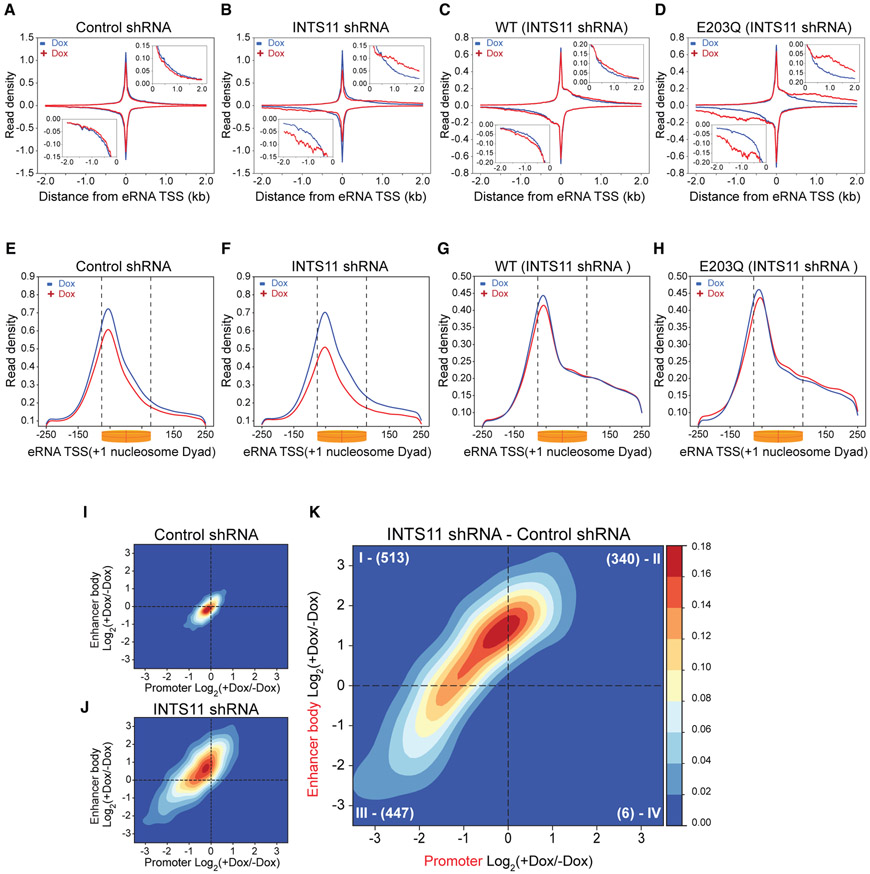
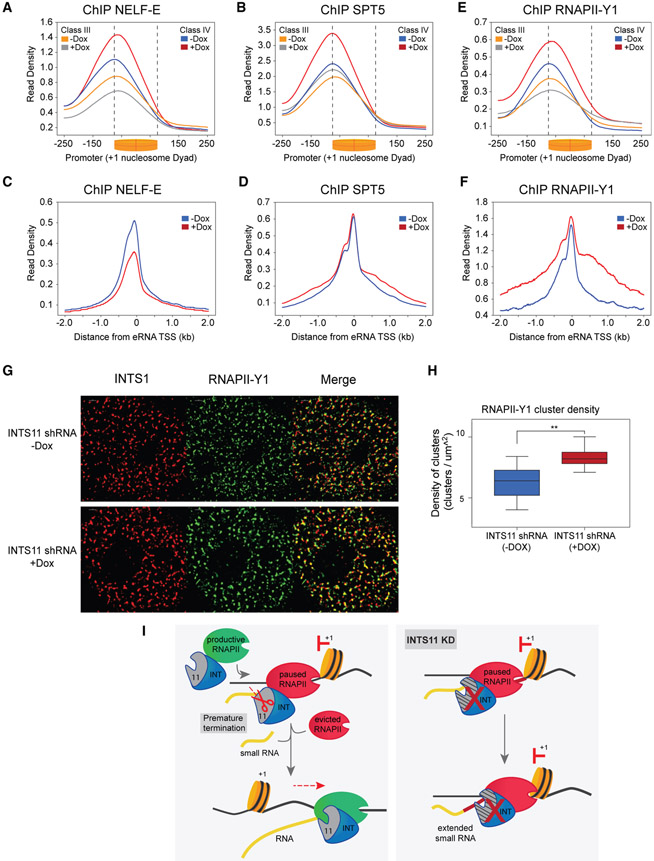
Transcription by RNA polymerase II (RNAPII) is pervasive in the human genome. However, the mechanisms controlling transcription at promoters and enhancers remain enigmatic. Here, we demonstrate that Integrator subunit 11 (INTS11), the catalytic subunit of the Integrator complex, regulates transcription at these loci through its endonuclease activity. Promoters of genes require INTS11 to cleave nascent transcripts associated with paused RNAPII and induce their premature termination in the proximity of the +1 nucleosome. The turnover of RNAPII permits the subsequent recruitment of an elongation-competent RNAPII complex, leading to productive elongation. In contrast, enhancers require INTS11 catalysis not to evict paused RNAPII but rather to terminate enhancer RNA transcription beyond the +1 nucleosome. These findings are supported by the differential occupancy of negative elongation factor (NELF), SPT5, and tyrosine-1-phosphorylated RNAPII. This study elucidates the role of Integrator in mediating transcriptional elongation at human promoters through the endonucleolytic cleavage of nascent transcripts and the dynamic turnover of RNAPII.

Keywords: RNA polymerase II; RNA processing; elongation; enhancers; integrator; pause-release; promoters; termination; transcription; traveling ratio.


Conflict of interest statement

Declaration of Interests The authors declare no competing interests.

Figures

Figure 1.
Figure 1.. Integrator Regulates Steady-State Gene Expression
(A–C) Volcano plot depicting differentially expressed genes after (A) INTS11 shRNA, (B) INTS9 shRNA, and (C) INTS4 shRNA determined by RNA-seq (n = 24,832 genes, fold change = 1.5, q-value > 0.05). (D and E) Venn diagram of common (D) downregulated genes and (E) upregulated genes among cells depleted of INTS11, INTS9, or INTS4.
Figure 2.
Figure 2.. Integrator Mediates Transcriptional Elongation
(A) Spearman correlation of RNAPII and INTS11 ChIP-seq occupancy centered on the TSS (CAGE peak ±200 bp) of 8,000 genes. (B) Hypothetical schematic of control condition “A” whereby treatments producing conditions “B” and “C” generate identical traveling ratio (TR) values by distinct transcriptional mechanisms. (C and D) TM of control shRNA cells (C) and INTS11 shRNA cells (D). (E) Differential TM of INTS11 shRNA cells. (F and G) ChIP-seq promoter profiles of INTS11 (F) and RNAPII (G) centered on the +1 nucleosome dyad at gene classes defined by the differential TM. Kolmogorov-Smirnov (KS) test p value < 0.001 for classes paired against class IV. (H and I) PRO-seq examples of class IV genes SEL1L (H) and MED4 (I) in control shRNA cells and INTS11 shRNA cells without and with shRNA induction.
Figure 3.
Figure 3.. Integrator Relieves RNAPII Pausing Adjacent to the +1 Nucleosome Dyad
(A and B) PRO-seq promoter-proximal read density and gene body profile at class I and II genes in control shRNA cells (A) and INTS11 shRNA cells (B) without and with shRNA induction. KS test p value = 0.01 of class I promoter and gene body profiles (−Dox versus +Dox). KS test p value <0.001 of class II promoter and gene body profiles (−Dox versus +Dox). (C and D) PRO-seq promoter-proximal read density and gene body profile at class III and IV genes in control shRNA cells (C) and INTS11 shRNA cells (D) without and with shRNA induction. KS test p value < 0.001 for class III and IV (−Dox versus +Dox) promoter and gene body profiles. (E) RNAPII ChIP-seq promoter and gene body profiles at class I and II genes without and with INTS11 shRNA induction. KS test p value < 0.05 and 0.01 for class I and II (−Dox versus +Dox) promoter profiles, respectively, and KS test p value < 0.05 for gene body profiles. (F) RNAPII ChIP-seq promoter and gene body profiles at class III and IV genes without and with INTS11 shRNA induction. KS test p value < 0.0001 and 0.05 for class III and IV (−Dox versus +Dox) promoter profiles, respectively, and KS test p value < 0.001 for gene body profiles. (G and H) Mononucleosome profile at class I and II genes in control shRNA cells (G) and INTS11 shRNA cells (H) without and with shRNA induction. (I and J) Mononucleosome profile at class III and IV genes in control shRNA cells (I) and INTS11 shRNA cells (J) without and with shRNA induction.
Figure 4.
Figure 4.. INTS11 Catalysis Facilitates RNAPII Elongation
(A and B) PRO-seq promoter-proximal read density and gene body profile at class I and II genes in INTS11 shRNA cells expressing WT-INTS11 (A) and INTS11 shRNA cells expressing E203Q-INTS11 (B) without and with shRNA induction. KS test p value < 0.0001 for class II (−Dox versus +Dox) promoter profile and KS test p value < 0.05 and 0.01 for class I and II (−Dox versus +Dox) gene body profiles, respectively. (C and D) PRO-seq promoter-proximal read density and gene body profile at class III and IV genes in INTS11 shRNA cells expressing WT-INTS11 (C) and INTS11 shRNA cells expressing E203Q-INTS11 (D) without and with shRNA induction. KS test p value < 0.0001 for class IV (−Dox versus +Dox) promoter profile and KS test p value < 0.001 for class III and IV (−Dox versus +Dox) gene body profiles. PRO-seq promoter profiles are centered on the +1 nucleosome dyad. PRO-seq examples of class IV genes. (E and F) SEL1L (E) and MED4 (F) in INTS11 shRNA cells expressing WT-INTS11 and INTS11 shRNA cells expressing E203Q-INTS11 without and with shRNA induction.
Figure 5.
Figure 5.. INTS11 Catalyzes the Termination of Small RNA Associated with Paused RNAPII
(A) smRNA whole gene profile of all expressed genes (n = 8000) in INTS11 shRNA cells. (B and C) Boxplot of log2(+Dox/−Dox) smRNA counts per million (CPM) at (B) Class IV and (C) Class III genes, t test; ***p value < 0.001. (D) Boxplot of smRNA read length at all genes in INTS11 shRNA cells expressing WT-INTS11 and INTS11 shRNA cells expressing E203Q-INTS11. t test; ***p value < 0.001. (E and F) smRNA mean size distribution centered on the TSSs of class IV (E) and class III (F) genes in control shRNA cells and INTS11 shRNA cells without and with shRNA induction. (G and H) smRNA mean size distribution centered on the TSSs of class IV (G) and class III (H) genes in INTS11 shRNA cells expressing WT-INTS11 and INTS11 shRNA cells expressing E203Q-INTS11 without and with shRNA induction. (I–L) smRNA read length distribution at all genes in control shRNA cells (I), INTS11 shRNA cells (J), INTS11 shRNA cells expressing WT-INTS11 (K), and INTS11 shRNA cells expressing E203Q-INTS11 (L) without and with shRNA induction. (M and N) smRNA examples of class IV genes SEL1L (M) and MED4 (N) in control shRNA cells, INTS11 shRNA cells, INTS11 shRNA cells expressing WT-INTS11, and INTS11 shRNA cells expressing E203Q-INTS11 without and with shRNA induction.
Figure 6.
Figure 6.. Enhancer RNA Transcriptional Termination Requires INTS11 Catalysis
(A–D) PRO-seq enhancer profile (n = 2,293) in control shRNA cells (A), INTS11 shRNA cells (B), INTS11 shRNA cells expressing WT-INTS11 (C), and INTS11 shRNA cells expressing E203Q-INTS11 (D) without and with shRNA induction. (E–H) PRO-seq enhancer TSS profile in control shRNA cells (E), INTS11 shRNA cells (F), INTS11 shRNA cells expressing WT-INTS11 (G), and INTS11 shRNA cells expressing E203Q-INTS11 (H) without and with shRNA induction. KS test p value < 0.001 for all conditions (−Dox versus +Dox). (I and J) Enhancer TM of control shRNA cells (I) and INTS11 shRNA cells (J). (K) Differential enhancer TM of INTS11 shRNA cells.
Figure 7.
Figure 7.. Pausing Factors and Tyrosine-1-Phosphorylated RNAPII Convey Integrator Functions
(A) NELF-E ChIP-seq promoter profile at class III and -IV genes without and with shRNA induction in INTS11 shRNA cells. KS test p value < 0.0001 for class III and IV (−Dox versus +Dox), respectively. (B) SPT5 ChIP-seq promoter profile at class III and IV genes without and with shRNA induction in INTS11 shRNA cells. KS test p value < 0.0001 for class III and IV (−Dox versus +Dox), respectively. (C) NELF-E ChIP-seq enhancer profile without and with shRNA induction in INTS11 shRNA cells. (D) SPT5 ChIP-seq enhancer profile without and with shRNA induction in INTS11 shRNA cells. (E) RNAPII-Y1 ChIP-seq promoter profile at class III and IV genes without and with shRNA induction in INTS11 shRNA cells. KS test p value < 0.0001 for class III and IV (−Dox versus +Dox), respectively. (F) RNAPII-Y1 ChIP-seq enhancer profile without and with shRNA induction in INTS11 shRNA cells. (G) STORM images of INTS1, RNAPII-Y1, and a merge without and with shRNA induction in INTS11 shRNA cells. (H) Quantification of RNAPII-Y1 cluster density without and with shRNA induction in INTS11 shRNA cells (n = 8, **p < 0.01). (I) Model depicting Integrator mediating premature termination of nascent transcripts and subsequent recruitment of elongation-competent RNAPII complex.

References

    1. Albrecht TR, Shevtsov SP, Wu Y, Mascibroda LG, Peart NJ, Huang KL, Sawyer IA, Tong L, Dundr M, and Wagner EJ (2018). Integrator subunit 4 is a ‘Symplekin-like’ scaffold that associates with INTS9/11 to form the Integrator cleavage module. Nucleic Acids Res. 46, 4241–4255. - PMC - PubMed
    1. Baillat D, Hakimi MA, Näär AM, Shilatifard A, Cooch N, and Shiekhattar R (2005). Integrator, a multiprotein mediator of small nuclear RNA processing, associates with the C-terminal repeat of RNA polymerase II. Cell 123, 265–276. - PubMed
    1. Bintu L, Ishibashi T, Dangkulwanich M, Wu YY, Lubkowska L, Kashlev M, and Bustamante C (2012). Nucleosomal elements that control the topography of the barrier to transcription. Cell 151, 738–749. - PMC - PubMed
    1. Bolger AM, Lohse M, and Usadel B (2014). Trimmomatic: a flexible trimmer for Illumina sequence data. Bioinformatics 30, 2114–2120. - PMC - PubMed
    1. Chan HL, Beckedorff F, Zhang Y, Garcia-Huidobro J, Jiang H, Colaprico A, Bilbao D, Figueroa ME, LaCava J, Shiekhattar R, and Morey L (2018). Polycomb complexes associate with enhancers and promote oncogenic transcriptional programs in cancer through multiple mechanisms. Nat. Commun 9, 3377. - PMC - PubMed

Publication types