. 2020 Jul 21;32(3):107909.
doi: 10.1016/j.celrep.2020.107909.

Structural Insights into the SPRED1-Neurofibromin-KRAS Complex and Disruption of SPRED1-Neurofibromin Interaction by Oncogenic EGFR

Affiliations

Structural Insights into the SPRED1-Neurofibromin-KRAS Complex and Disruption of SPRED1-Neurofibromin Interaction by Oncogenic EGFR

Wupeng Yan et al. Cell Rep. .

Abstract

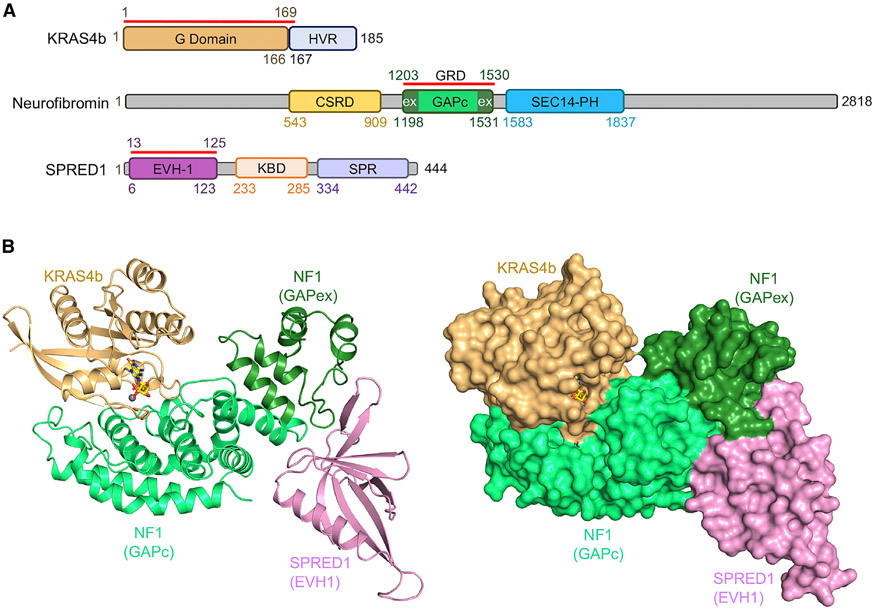
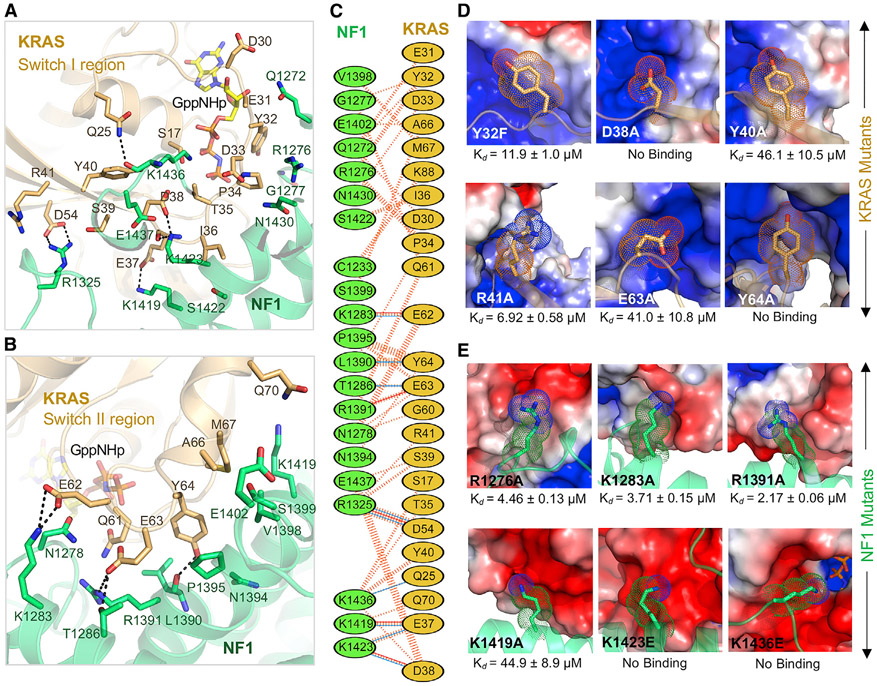
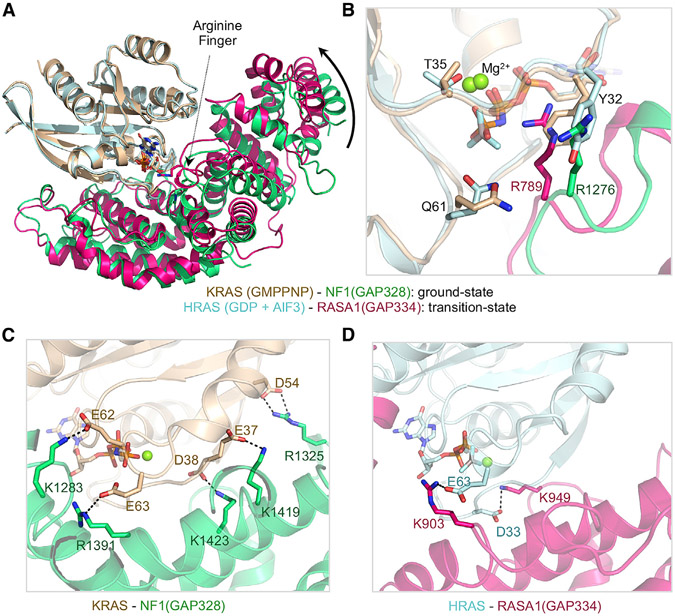
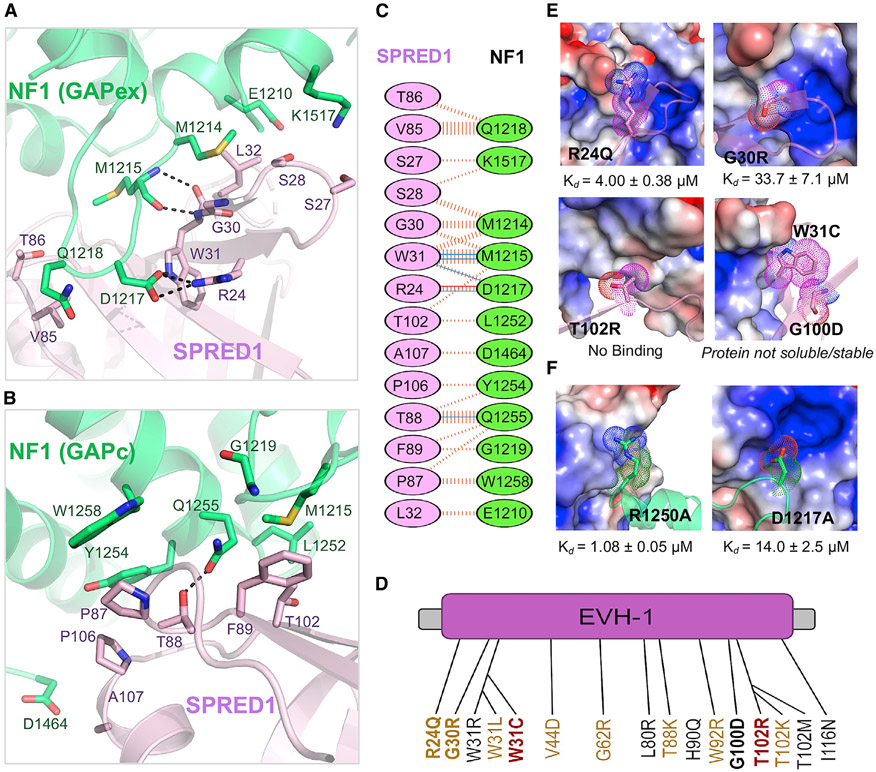
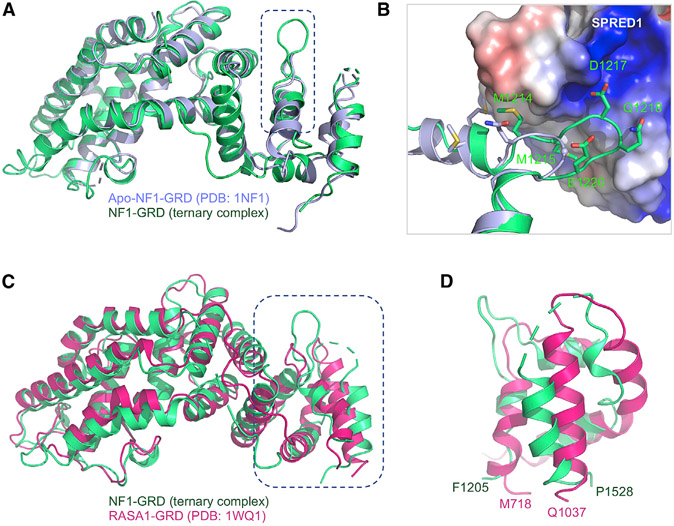
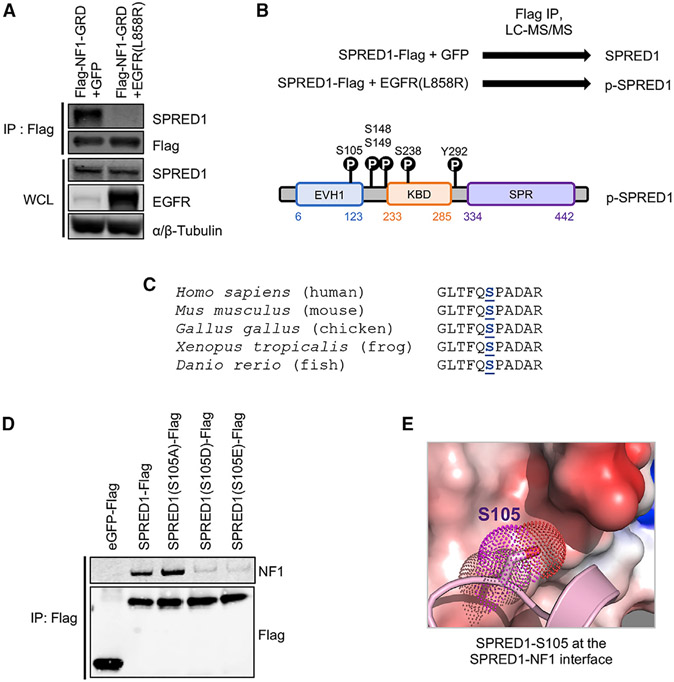
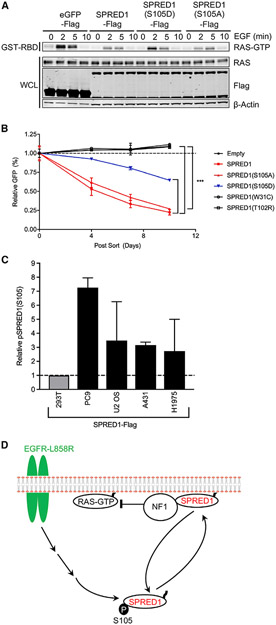
Sprouty-related, EVH1 domain-containing (SPRED) proteins negatively regulate RAS/mitogen-activated protein kinase (MAPK) signaling following growth factor stimulation. This inhibition of RAS is thought to occur primarily through SPRED1 binding and recruitment of neurofibromin, a RasGAP, to the plasma membrane. Here, we report the structure of neurofibromin (GTPase-activating protein [GAP]-related domain) complexed with SPRED1 (EVH1 domain) and KRAS. The structure provides insight into how the membrane targeting of neurofibromin by SPRED1 allows simultaneous interaction with activated KRAS. SPRED1 and NF1 loss-of-function mutations occur across multiple cancer types and developmental diseases. Analysis of the neurofibromin-SPRED1 interface provides a rationale for mutations observed in Legius syndrome and suggests why SPRED1 can bind to neurofibromin but no other RasGAPs. We show that oncogenic EGFR(L858R) signaling leads to the phosphorylation of SPRED1 on serine 105, disrupting the SPRED1-neurofibromin complex. The structural, biochemical, and biological results provide new mechanistic insights about how SPRED1 interacts with neurofibromin and regulates active KRAS levels in normal and pathologic conditions.

Keywords: Legius syndrome; RAS-RAF-ERK pathway; RASopathy; RasGAP; neurofibromatosis type 1.


Conflict of interest statement

Declaration of Interests F.M. is a consultant for the following companies: Aduro Biotech, Amgen, Daiichi, Ideaya Biosciences, Kura Oncology, Leidos Biomedical Research, PellePharm, Pfizer, PMV Pharma, Portola Pharmaceuticals, and Quanta Therapeutics; has received research grants from Daiichi; is a recipient of funded research from Gilead Sciences; is a consultant and cofounder for the following companies (with ownership interest, including stock options): BridgeBio Pharma, DNAtrix, Olema Pharmaceuticals, and Quartz.

Figures

Figure 1.
Figure 1.. Domain Organization and Overall Structure of the Ternary Complex Formed by Neurofibromin (GRD), SPRED1(EVH1), and KRAS Proteins
(A) Domain organization of KRAS, neurofibromin (NF1), and SPRED1 showing the presence of various domains in the full-length protein. The red line drawn above each protein indicates the domains involved in complex formation and used for our structural studies. In NF1, the GAPc and GAPex regions are highlighted in light and dark green, respectively. (B) The overall structure of the complex formed by GMPPNP-bound KRAS (light brown), NF1(GRD) (light green), and SPRED1(EVH1) (light pink) proteins. In the left panel, the ternary complex is indicated in ribbon representation, whereas in the right panel, proteins are indicated in surface representation. In both panels, GMPPNP and Mg2+ bound to KRAS are indicated as sticks and spheres, respectively. See also Figure S1 and Table S1.
Figure 2.
Figure 2.. Structural Analyses of the NF1-KRAS Interaction Interface in the Ternary Complex and the Impact of Point Mutations in KRAS and NF1 on the NF1-KRAS Interaction
(A and B) Enlarged view of the NF1-KRAS interaction interface formed by residues present in the (A) switch I and (B) switch II regions of KRAS. KRAS and NF1 are colored light brown and green, respectively. The nucleotide GMPPNP and residues that participate in the protein–protein interaction are indicated in stick (yellow) representation. Intermolecular hydrogen bonds and salt bridges are indicated by dashed black lines. (C) Schematic representation of the NF1-KRAS interaction interface as identified by PDBSum (http://www.ebi.ac.uk/thornton-srv/databases/cgi-bin/pdbsum/GetPage.pl?pdbcode=index.html). The interactions are indicated using the following notation: hydrogen bonds, blue solid lines; salt bridge, red solid lines; non-bonded contacts, striped lines (width of the striped line is proportional to the number of atomic contacts). (D) Binding affinities (measured using ITC) for KRAS point mutants (stick representation) located at the NF1-KRAS interaction interface. NF1 is indicated in an electrostatic surface representation. (E) Binding affinities (measured using ITC) for NF1 point mutants (stick representation) located at the NF1-KRAS interaction interface. KRAS is indicated in an electrostatic surface representation. See also Figure S2.
Figure 3.
Figure 3.. Structural Comparison between Ground-State and Transition-State Structures of RAS-RasGAP Complexes
(A) The ground-state structure of GMPPNP-bound KRAS (light brown) in complex with NF1(GRD) (light green) superposed over the transition-state structure of GDP+AlF3-bound HRAS (cyan) in complex with RASA1(GRD) (hot pink). Structures were superposed using the RAS molecules present in these complexes. (B) Enlarged view of the active site pocket showing structural changes that occur between the ground state and the transition state. (C and D) Protein-protein interaction interface highlighting the presence of salt-bridge interactions in (C) NF1-KRAS and (D) RASA1-HRAS complexes. The color coding is the same as in (A).
Figure 4.
Figure 4.. Details of the SPRED1-NF1 Interaction Interface in the Ternary Complex and the Impact of Pathogenic Mutations in SPRED1 and NF1 on the SPRED1-NF1 Interaction
(A and B) Enlarged view of the SPRED1(EVH1)-NF1(GRD) interface formed by residues present in the (A) GAPex and (B) GAPc regions of NF1 in the ternary complex. SPRED1(EVH1) and NF1(GRD) are colored light magenta and green, respectively. The residues that participate in the protein-protein interaction are indicated in stick representation. Intermolecular hydrogen bonds and salt bridges are indicated by dashed black lines. (C) Schematic representation of the SPRED1-NF1 interaction interface as identified by PDBSum (http://www.ebi.ac.uk/thornton-srv/databases/cgi-bin/pdbsum/GetPage.pl?pdbcode=index.html/). The interactions are indicated in colors using the notation described for Figure 2C. (D) The missense mutations reported in the SPRED1(EVH1) domain in Legius syndrome. The text color represents the mutation type: red, confirmed pathogenic; yellow, suspected pathogenic; black, unclassified or uncertain. The mutations tested in this study are indicated in bold. (E) Binding affinities (measured using ITC) for Legius syndrome pathogenic mutations (stick representation) in SPRED1. NF1 is indicated in an electrostatic surface representation. (F) Binding affinities (measured using ITC) for neurofibromatosis type 1 pathogenic mutations (stick representation) in NF1. SPRED1 is shown in an electrostatic surface representation. See also Figure S3.
Figure 5.
Figure 5.. Structural Changes in NF1 upon Binding to SPRED1, along with Comparison of the GAPex Domains of NF1 and RASA1
(A) The NF1(GRD) (light green) present in the ternary complex superposed on the previously solved structure of the apo-form of NF1(GRD) (light blue). (B) Enlarged view of the GAPex region of NF1 that undergoes conformational change upon binding to SPRED1. SPRED1 is shown in an electrostatic surface representation, whereas NF1(GAPex) from the apo and ternary complexes are indicated in ribbon representation and colored light blue and green, respectively. The residues that undergo conformational changes are indicated in stick representation. (C) The NF1(GRD) (light green) present in the ternary complex superposed on the previously solved structure of RASA1(GRD) (hot pink). (D) Enlarged view of the superposed structures shown in (C), highlighting the structural differences between the GAPex region of NF1 and RASA1. See also Figure S4.
Figure 6.
Figure 6.. Identification of SPRED1 Phosphorylation that Disrupts SPRED1-NF1 Interaction
(A) Proteins precipitated from extracts of HEK293T cells transiently transfected with FLAG-NF1 and EGFR(L858R) constructs were assessed by western blot for endogenous SPRED1 binding. WCL, whole-cell lysate; IP, immunoprecipitation. (B) Identification of SPRED1 phosphorylation sites downstream of EGFR(L858R) in HEK293T cells by SPRED1-FLAG and EGFR(L858R) transient transfection, anti-FLAG IP, and LC-MS/MS. (C) Amino acid sequence alignment of SPRED1 flanking serine 105 across indicated species shows evolutionary conservation. (D) Proteins precipitated from extracts of HEK293T cells transiently transfected with phosphomimetic and phosphodeficient SPRED1(S105) mutant constructs were assessed by western blot for endogenous NF1 binding. (E) Enlarged view of the NF1 electrostatic surface that interacts with SPRED1(S105). The S105E mutation results in a significant loss of binding affinity between SPRED1 and NF1. See also Figure S5.
Figure 7.
Figure 7.. Phosphomimetic and Phosphodeficient SPRED1(S105) Alter RAS-GTP Signaling following EGF Stimulation and K562 Proliferation, along with a Model of SPRED1(S105) Phosphorylation
(A) HEK293T cells were transiently transfected with indicated SPRED1-FLAG constructs, serum starved for 16 h, and stimulated with 10 ng/mL EGF for the indicted time points. Downstream signaling was then assessed by western blot and RAS-GTP pull-down assay. (B) K562 cells were infected with SPRED1-IRES-GFP, SPRED1-IRES-GFP mutants, and empty vector expressing retrovirus. Three days after infection, baseline GFP-positive cells were measured by flow cytometry and normalized to 1. During this competition assay, GFP-positive cells were monitored over time to measure the effect of SPRED1 expression on proliferation. The statistical significance of the difference between indicated samples was determined using a two-way ANOVA: ***p < 0.001. (C) Cancer cell lines were infected with SPRED1-FLAG-expressing retrovirus, selected with 1 μg/mL puromycin, anti-FLAG IP, and LC-MS/MS as described above. The y axis: MS1 chromatographic peak areas, arbitrary units relative to control. (D) Oncogenic EGFR-mediated SPRED1(S105) phosphorylation model. Phosphorylated SPRED1(S105) is unable to bind NF1 and inhibit RAS-GTP signaling. See also Figure S6.

References

    1. Adams PD, Afonine PV, Bunkóczi G, Chen VB, Davis IW, Echols N, Headd JJ, Hung LW, Kapral GJ, Grosse-Kunstleve RW, et al. (2010). PHENIX: a comprehensive Python-based system for macromolecular structure solution. Acta Crystallogr. D Biol. Crystallogr 66, 213–221. - PMC - PubMed
    1. Agamasu C, Ghirlando R, Taylor T, Messing S, Tran TH, Bindu L, Tonelli M, Nissley DV, McCormick F, and Stephen AG (2019). KRAS Prenylation Is Required for Bivalent Binding with Calmodulin in a Nucleotide-Independent Manner. Biophys. J 115, 1049–1063. - PMC - PubMed
    1. Ahmadian MR, Wiesmüller L, Lautwein A, Bischoff FR, and Wittinghofer A (1996). Structural differences in the minimal catalytic domains of the GTPase-activating proteins p120GAP and neurofibromin. J. Biol. Chem 271, 16409–16415. - PubMed
    1. Ahmadian MR, Hoffmann U, Goody RS, and Wittinghofer A (1997a). Individual rate constants for the interaction of Ras proteins with GTPase-activating proteins determined by fluorescence spectroscopy. Biochemistry 35, 4535–4541. - PubMed
    1. Ahmadian MR, Stege P, Scheffzek K, and Wittinghofer A (1997b). Confirmation of the arginine-finger hypothesis for the GAP-stimulated GTP-hydrolysis reaction of Ras. Nat. Struct. Biol 4, 686–689. - PubMed

Publication types

MeSH terms

Supplementary concepts