Comparative Study
. 2020 Sep;40(9):2195-2211.
doi: 10.1161/ATVBAHA.120.314670. Epub 2020 Jul 23.

Single-Cell Transcriptomic Profiling of Vascular Smooth Muscle Cell Phenotype Modulation in Marfan Syndrome Aortic Aneurysm

Affiliations
Comparative Study

Single-Cell Transcriptomic Profiling of Vascular Smooth Muscle Cell Phenotype Modulation in Marfan Syndrome Aortic Aneurysm

Albert J Pedroza et al. Arterioscler Thromb Vasc Biol. 2020 Sep.

Abstract

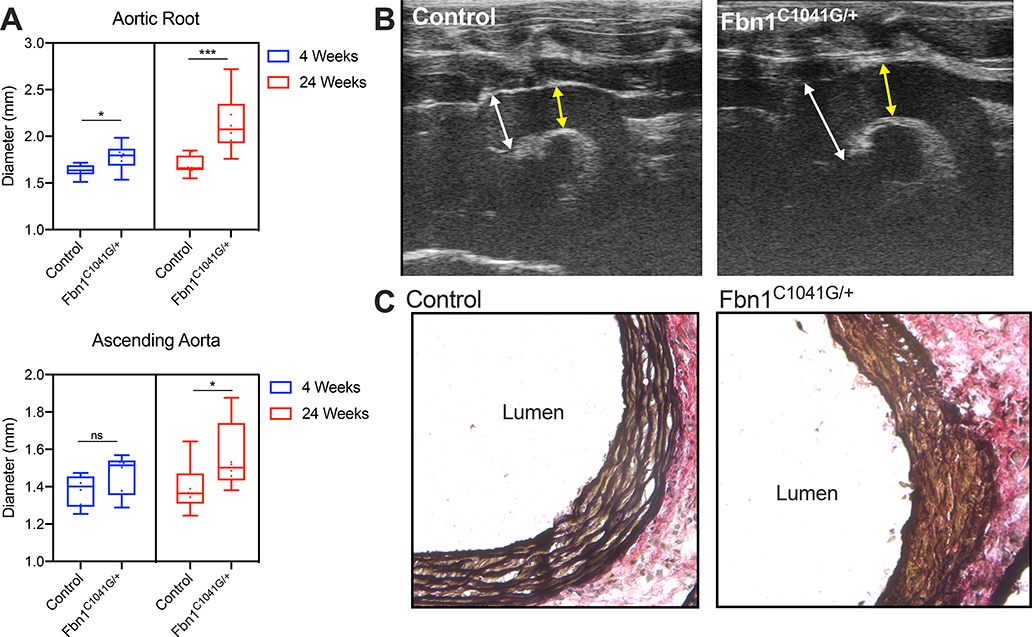
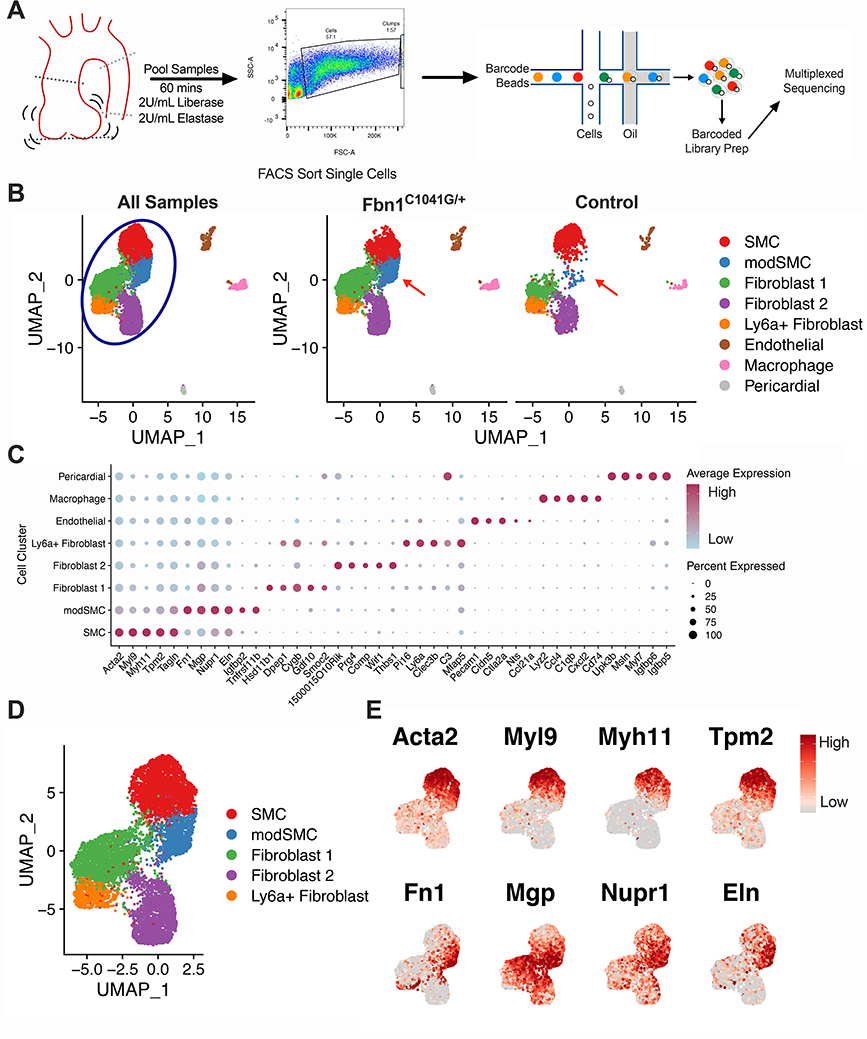
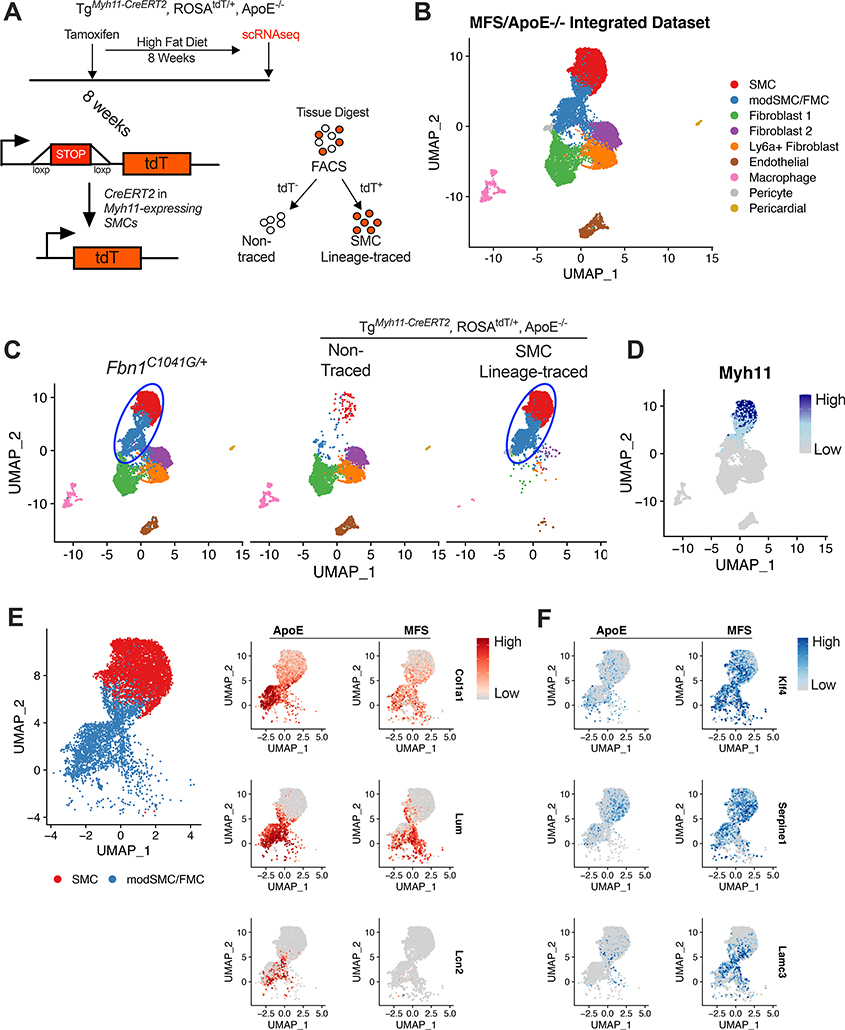
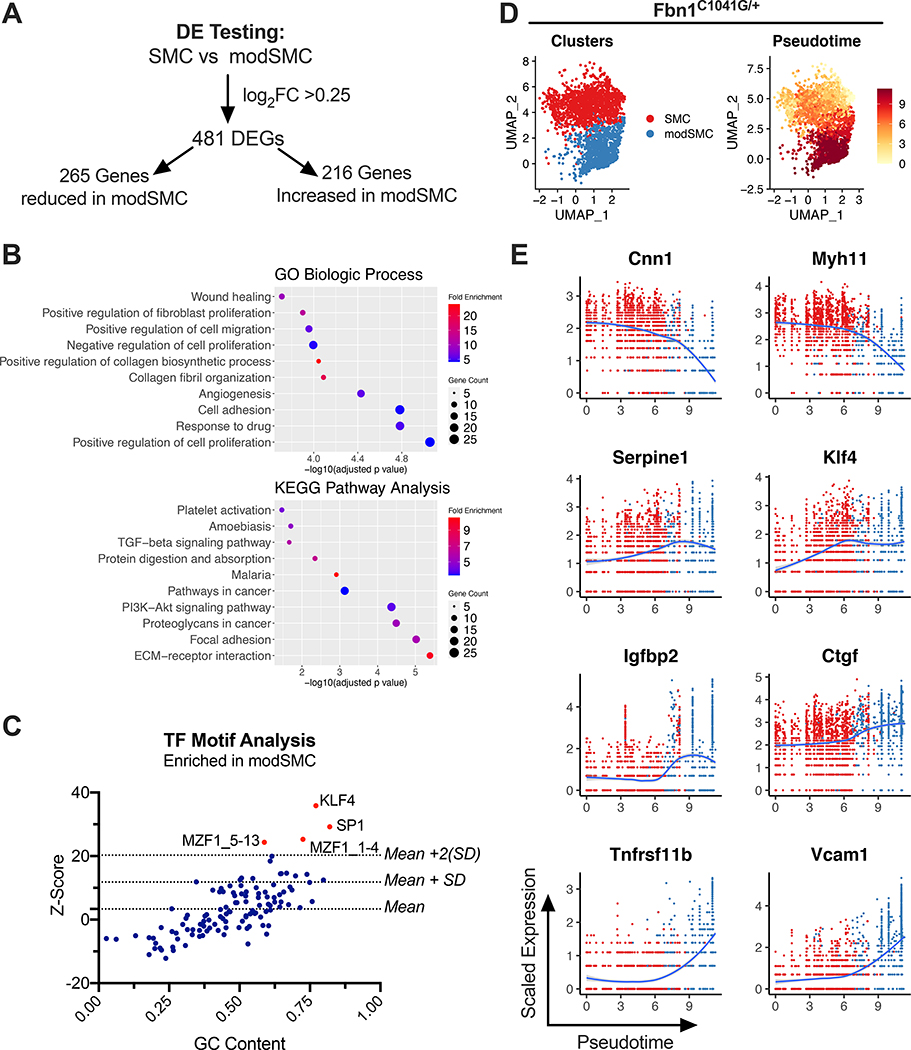
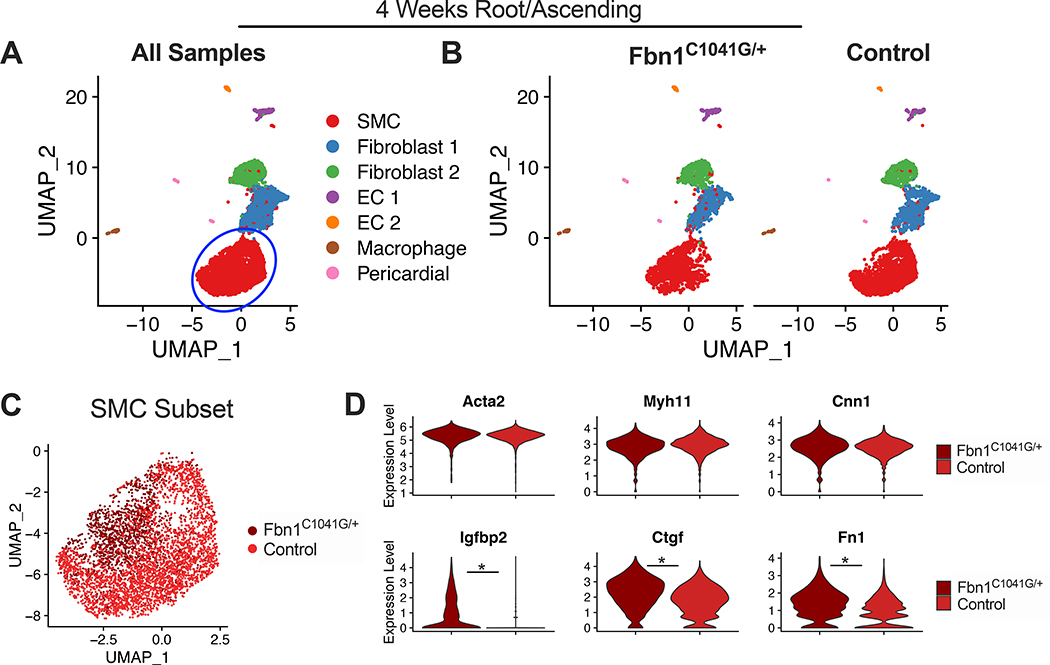
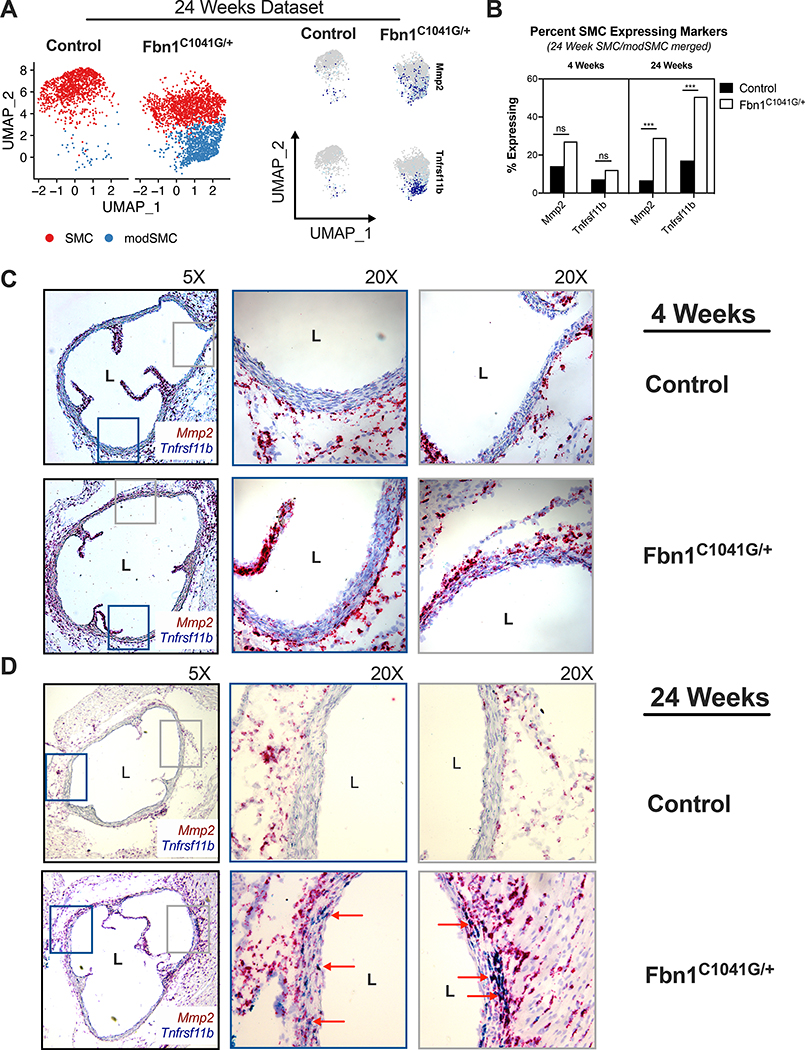
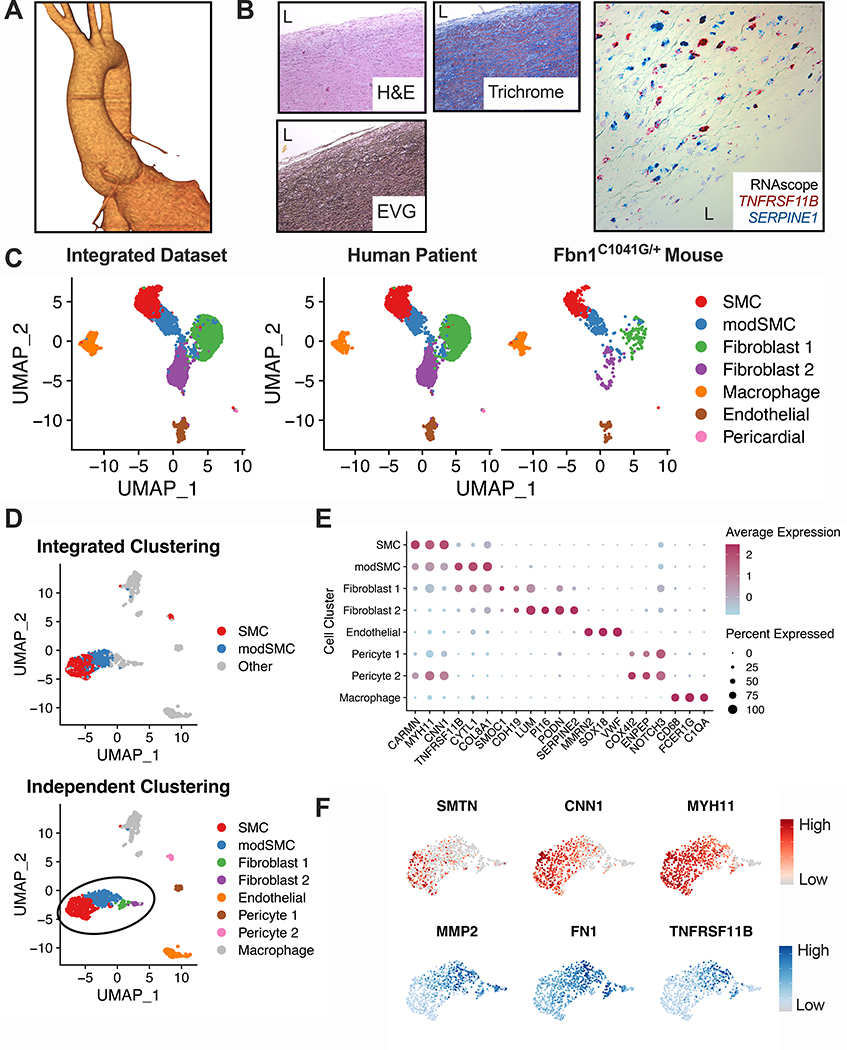
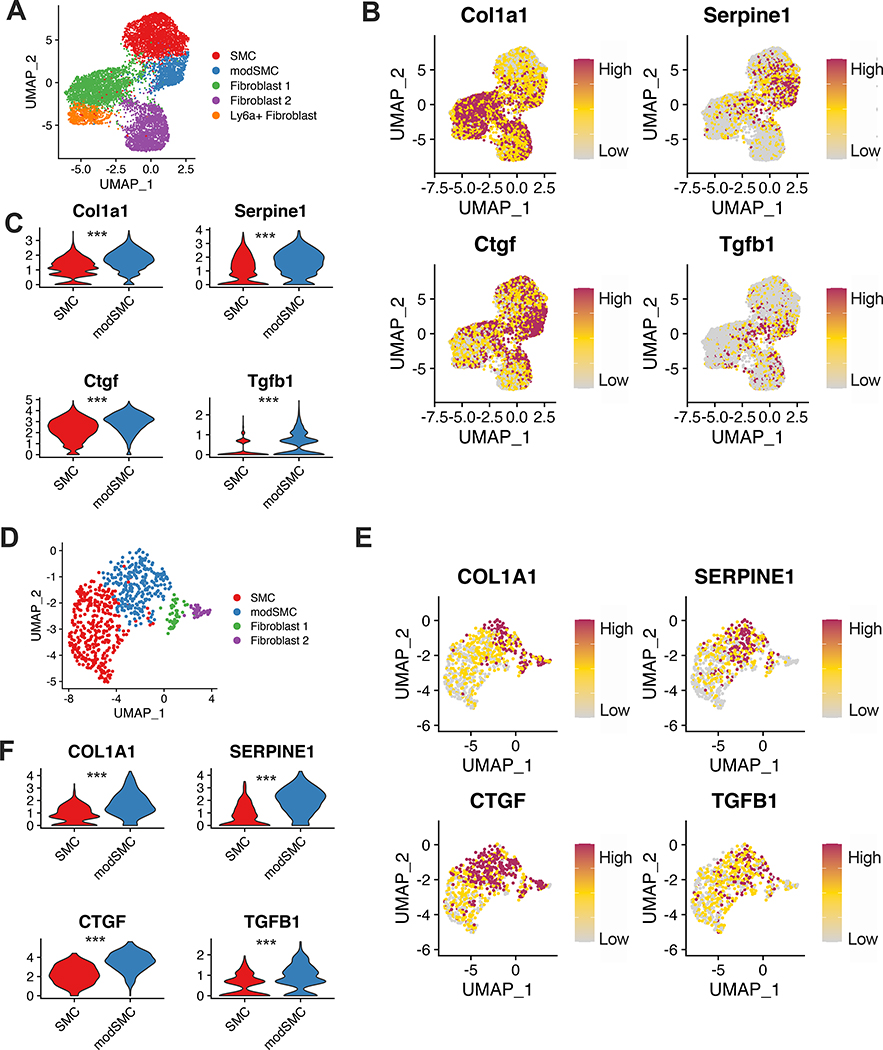
Objective: To delineate temporal and spatial dynamics of vascular smooth muscle cell (SMC) transcriptomic changes during aortic aneurysm development in Marfan syndrome (MFS). Approach and Results: We performed single-cell RNA sequencing to study aortic root/ascending aneurysm tissue from Fbn1C1041G/+ (MFS) mice and healthy controls, identifying all aortic cell types. A distinct cluster of transcriptomically modulated SMCs (modSMCs) was identified in adult Fbn1C1041G/+ mouse aortic aneurysm tissue only. Comparison with atherosclerotic aortic data (ApoE-/- mice) revealed similar patterns of SMC modulation but identified an MFS-specific gene signature, including plasminogen activator inhibitor-1 (Serpine1) and Kruppel-like factor 4 (Klf4). We identified 481 differentially expressed genes between modSMC and SMC subsets; functional annotation highlighted extracellular matrix modulation, collagen synthesis, adhesion, and proliferation. Pseudotime trajectory analysis of Fbn1C1041G/+ SMC/modSMC transcriptomes identified genes activated differentially throughout the course of phenotype modulation. While modSMCs were not present in young Fbn1C1041G/+ mouse aortas despite small aortic aneurysm, multiple early modSMCs marker genes were enriched, suggesting activation of phenotype modulation. modSMCs were not found in nondilated adult Fbn1C1041G/+ descending thoracic aortas. Single-cell RNA sequencing from human MFS aortic root aneurysm tissue confirmed analogous SMC modulation in clinical disease. Enhanced expression of TGF-β (transforming growth factor beta)-responsive genes correlated with SMC modulation in mouse and human data sets.

Conclusions: Dynamic SMC phenotype modulation promotes extracellular matrix substrate modulation and aortic aneurysm progression in MFS. We characterize the disease-specific signature of modSMCs and provide temporal, transcriptomic context to the current understanding of the role TGF-β plays in MFS aortopathy. Collectively, single-cell RNA sequencing implicates TGF-β signaling and Klf4 overexpression as potential upstream drivers of SMC modulation.

Keywords: Marfan syndrome; aortic aneurysm; extracellular matrix; phenotype; transcriptome.


Conflict of interest statement

Disclosures

The authors confirm that there are no financial disclosures or conflicts of interest.

Figures

Figure 1:
Figure 1:
Progressive aortopathy in Fbn1C1041G/+ mice. A Long axis echocardiographic aortic root and ascending aorta measurements in 4-week (n=6 mice per genotype) and 24-week old (n=8 per genotype) control and Fbn1C1041G/+ mouse cohorts. B Representative 24-week transthoracic echocardiographic images demonstrating severe dilatation of the aortic root in Fbn1C1041G/+ mice. White arrows depict sinus of Valsalva measurement. Yellow arrow depicts ascending aorta measurement. C Representative elastic Van Gieson (EVG) stain demonstrating severe elastin fiber fragmentation in Fbn1C1041G/+ mice. Box and whisker plots display 95% confidence interval (box), mean (line) and range (whiskers). ***p<0.001, *p<0.05 (Mann-Whitney U non-parametric test).
Figure 2:
Figure 2:
Single cell RNA sequencing (scRNAseq) of Fbn1C1041G/+ and control mouse aortic Root/AS tissue reveals disease-associated cluster. A Experiment workflow for scRNAseq. Aortic root and proximal ascending aorta tissue are digested in enzyme mixture to suspend cells. FACS eliminates debris, cell clumps, and dead cells prior to single cell capture and sequencing. B Uniform Manifold Approximation and Projection (UMAP) dimensional reduction of >9,800 aortic cells from Fbn1C1041G/+ (n=4) and control (n=3) mice. Blue circle denotes major clusters selected for further analysis, red arrows indicate modulated SMC (modSMC) cluster enriched in Fbn1C1041G/+. C Dotplot for highest specificity gene markers of cell clusters. Dot size represents percent of cells expressing denoted gene, color represents average normalized expression level within the denoted cluster. D UMAP projection of modSMC cluster positioned between SMC and fibroblast clusters. E Feature plots demonstrate reduced expression of contractile genes (Acta2, Myl9, Myh11, Tpm2) and enriched expression of fibronectin 1 (Fn1), matrix gla protein (Mgp), nuclear protein 1 (Nupr1) and elastin (Eln) in modSMCs. Color scale indicates range from 5th (Low) to 95th (High) percentile of normalized expression levels by individual cells.
Figure 3:
Figure 3:
Fbn1C1041G/+ modSMCs co-cluster with analogous cell type in SMC lineage-traced atherosclerosis model. A Cartoon depiction of SMC lineage-tracing in TgMyh11-CreERT2, ROSAtdT/+, ApoE−/− mouse model. Tamoxifen at 8 weeks induces Cre recombinase-mediated activation of the tandem dimeric Tomato (tdT) in cells expressing Myh11 leading to permanent fluorescence in SMCs. High fat diet induces atherosclerosis prior to scRNAseq. B Integrated scRNAseq datasets from TgMyh11-CreERT2, ROSAtdT/+, ApoE−/− and Fbn1C1041G/+ mice with all cell clusters. C UMAP projection of scRNAseq data split by input sample. Blue oval indicates common SMC sub-clusters in each model. 99% of cells assigned modSMC identity in Fbn1C1041G/+ dataset co-clustered with SMC lineage-traced clusters from the ApoE−/− dataset. D Myh11 expression in integrated dataset. E UMAP projection of SMC/modSMC clusters from both models and feature plots depicting expression of Col1a1, Lum, and Lcn2 (enriched in ApoE−/−) split by model. F Analogous plots for example genes enriched in Fbn1C1041G/+ (‘MFS’) mice (Klf4, Serpine1, Lamc3). Color scale indicates range from 5th (Low) to 95th (High) percentile of normalized expression levels by individual cells.
Figure 4:
Figure 4:
Dynamic phenotype modulation across SMC spectrum in Fbn1C1041G/+ mice. A Results of dichotomous differential expression test comparing modSMC to SMC clusters from Fbn1C1041G/+ and control mouse merged dataset. B Top 10 significant gene ontology (GO) terms and KEGG pathway terms overrepresented by genes with enhanced expression in modSMCs (n=216 genes). C Transcription factor (TF) motif analysis for genes upregulated in modSMC cluster (n=216 genes). TFs with Z score >2 standard deviations above mean considered significant. D UMAP projections of Fbn1C1041G/+ SMC/modSMC clusters and pseudotime trajectory analysis scores demonstrate dynamic modulation across spectrum. E Scatter plots for example DEGs depicting expression level as a function of pseudotime score. Each point represents a single cell, color scheme depicts Seurat clustering (red=SMC, blue=modSMC).
Figure 5:
Figure 5:
scRNAseq from 4-week Fbn1C1041G/+ and control Root/AS tissue. A UMAP dimensional reduction of merged data (>7,200 cells) with clustering of major aortic cell types. Blue circle indicates subsampled SMC cluster. B UMAP plot split by genotype with similar clustering projection and no disease-specific clusters. C UMAP projection of SMC subset color-coded by genotype. D Consistent expression of contractile genes Acta2, Myh11, and Cnn1 across genotypes. Violin plots for markers of Fbn1C1041G/+ SMCs (Igfbp2, Ctgf and Fn1). * denotes adjusted p-value <0.01.
Figure 6:
Figure 6:
RNAscope assay for modSMC markers. A UMAP projection of 24-week Fbn1C1041G/+ and control SMC/modSMC clusters with expression plots for matrix metalloproteinase-2 (Mmp2) and osteoprotegerin (Tnfrsf11b) expression enriched in modSMC cluster. B Fraction of SMCs expressing Mmp2 and Tnfrsf11b in 4- and 24-week scRNAseq datasets. Cells with >1 transcript for denoted gene considered positive. *** denotes adjusted p <0.01 (Wilcoxon rank sum test). C Chromogenic amplified in-situ hybridization using sequence-specific probes for Tnfrsf11b (blue) and Mmp2 (red) in 4-week Fbn1C1041G/+ and control aortas identifies qualitatively increased Mmp2 expression with minimal Tnfrsf11b positivity in diseased samples. D 24-week aortic tissue RNAscope. Rare Mmp2-positive cells identified in littermate control animals, double-positive cells in Fbn1C1041G/+ samples (red arrows) represent modSMCs in tunica media. Adventitial fibroblasts display significant Mmp2 and rare Tnfrsf11b staining, confirming efficient hybridization and amplification in all samples. Images shown are representative of results for n=3 animals of each genotype.
Figure 7:
Figure 7:
Human MFS aortic root aneurysm scRNAseq. A Three-dimensional CTA reconstruction of 4.8cm aortic root aneurysm. B Representative histologic stains and RNAscope in-situ hybridization (20× magnification) for SERPINE1 (blue) and TNFRSF11B (red) from human MFS aortic tissue. ‘L’ indicates aortic lumen. C Results from dataset integration of human and Fbn1C1041G/+ mouse scRNAseq. modSMC cluster (blue) is present within both individual datasets. D Independent dimensional reduction and cell clustering of MFS human scRNAseq data. Similar clustering results are observed when plotted based on integrated dataset clustering (top) or independent clustering (human sample only, bottom). E DotPlot for top cluster markers in human dataset. Dot size denotes percentage of cells expressing noted gene, color scale denotes relative expression values. F Representative expression plots for (DEGs) in human modSMCs compared to SMCs. Reduced genes (top) in red, enriched genes (bottom) in blue. Color scale indicates range from 5th (Low) to 95th (High) percentile of normalized expression levels by individual cells.
Figure 8:
Figure 8:
Transcriptomic signature of TGF-β signaling is enhanced in modSMCs. A UMAP dimensional reduction plot of Fbn1C1041G/+ and control adult mice SMC, modSMC and fibroblast clusters. B expression plots and C violin plots demonstrating individual cell transcript levels for canonical TGF-β signaling-responsive genes collagen 1 (Col1a1), connective tissue growth factor (Ctgf), plasminogen activator inhibitor-1 (Serpine1) and TGF-β1 ligand (Tgfb1). D-F Analogous data from human MFS patient aortic root tissue. ***p<0.001 by Wilcoxon rank sum test. Color scale indicates range from 5th (Low) to 95th (High) percentile of normalized expression levels by individual cells.

References

    1. Dietz HC, Cutting GR, Pyeritz RE, Maslen CL, Sakai LY, Corson GM, Puffenberger EG, Hamosh A, Nanthakumar EJ, Curristin SM, et al. Marfan syndrome caused by a recurrent de novo missense mutation in the fibrillin gene. Nature. 1991;352(6333):337–339. doi:10.1038/352337a0 - DOI - PubMed
    1. Judge DP, Dietz HC. Marfan’s syndrome. Lancet. 2005;366(9501):1965–1976. doi:10.1016/S0140-6736(05)67789-6 - DOI - PMC - PubMed
    1. Saeyeldin A, Zafar MA, Velasquez CA, Ip K, Gryaznov A, Brownstein AJ, Li Y, Rizzo JA, Erben Y, Ziganshin BA, Elefteriades JA. Natural history of aortic root aneurysms in Marfan syndrome. Ann Cardiothorac Surg. 2017;6(6):625–632. doi:10.21037/acs.2017.11.10 - DOI - PMC - PubMed
    1. Judge DP, Dietz HC. Therapy of Marfan Syndrome. Annu Rev Med. Published online 2008. doi:10.1146/annurev.med.59.103106.103801 - DOI - PubMed
    1. Habashi JP, Judge DP, Holm TM, et al. Losartan, an AT1 antagonist, prevents aortic aneurysm in a mouse model of Marfan syndrome. Science (80- ). 2006;312(5770):117–121. doi:10.1126/science.1124287 - DOI - PMC - PubMed

Publication types

MeSH terms