. 2020 Sep 15;94(19):e00985-20.
doi: 10.1128/JVI.00985-20. Print 2020 Sep 15.

Type I and Type III Interferons Restrict SARS-CoV-2 Infection of Human Airway Epithelial Cultures

Affiliations

Type I and Type III Interferons Restrict SARS-CoV-2 Infection of Human Airway Epithelial Cultures

Abigail Vanderheiden et al. J Virol. .

Abstract

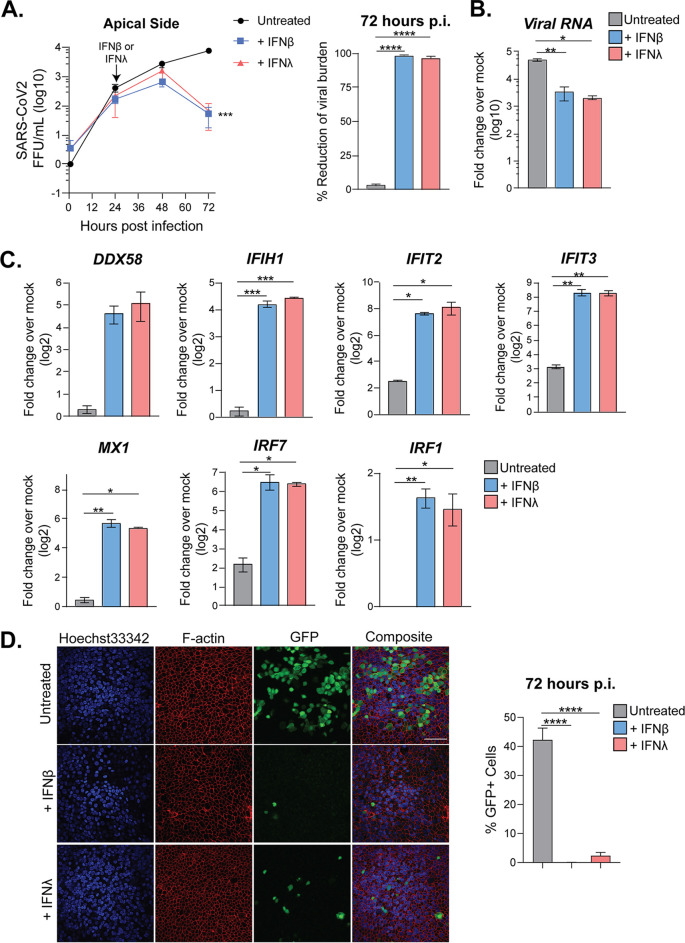
The newly emerged human coronavirus, severe acute respiratory syndrome coronavirus 2 (SARS-CoV-2), has caused a pandemic of respiratory illness. Current evidence suggests that severe cases of SARS-CoV-2 are associated with a dysregulated immune response. However, little is known about how the innate immune system responds to SARS-CoV-2. In this study, we modeled SARS-CoV-2 infection using primary human airway epithelial (pHAE) cultures, which are maintained in an air-liquid interface. We found that SARS-CoV-2 infects and replicates in pHAE cultures and is directionally released on the apical, but not basolateral, surface. Transcriptional profiling studies found that infected pHAE cultures had a molecular signature dominated by proinflammatory cytokines and chemokine induction, including interleukin 6 (IL-6), tumor necrosis factor alpha (TNF-α), and CXCL8, and identified NF-κB and ATF-4 as key drivers of this proinflammatory cytokine response. Surprisingly, we observed a complete lack of a type I or III interferon (IFN) response to SARS-CoV-2 infection. However, pretreatment and posttreatment with type I and III IFNs significantly reduced virus replication in pHAE cultures that correlated with upregulation of antiviral effector genes. Combined, our findings demonstrate that SARS-CoV-2 does not trigger an IFN response but is sensitive to the effects of type I and III IFNs. Our studies demonstrate the utility of pHAE cultures to model SARS-CoV-2 infection and that both type I and III IFNs can serve as therapeutic options to treat COVID-19 patients.IMPORTANCE The current pandemic of respiratory illness, COVID-19, is caused by a recently emerged coronavirus named SARS-CoV-2. This virus infects airway and lung cells causing fever, dry cough, and shortness of breath. Severe cases of COVID-19 can result in lung damage, low blood oxygen levels, and even death. As there are currently no vaccines approved for use in humans, studies of the mechanisms of SARS-CoV-2 infection are urgently needed. Our research identifies an excellent system to model SARS-CoV-2 infection of the human airways that can be used to test various treatments. Analysis of infection in this model system found that human airway epithelial cell cultures induce a strong proinflammatory cytokine response yet block the production of type I and III IFNs to SARS-CoV-2. However, treatment of airway cultures with the immune molecules type I or type III interferon (IFN) was able to inhibit SARS-CoV-2 infection. Thus, our model system identified type I or type III IFN as potential antiviral treatments for COVID-19 patients.

Keywords: COVID-19; SARS-CoV-2; cytokines; innate immunity; lung; type I interferon.


Figures

FIG 1
FIG 1
pHAE cultures are permissive to SARS-CoV-2 infection. (A) Differentiated pHAE cultures were infected by adsorption to the apical side at the indicated MOI. Supernatant was collected from the apical or basolateral side of the epithelial layer and the virus was measured by plaque assay. (B) Viral RNA was measured by probing for the SARS-CoV-2 RDRP RNA at 48 h p.i. by qRT-PCR. CT values are represented as relative fold change over mock (log10). (C) pHAE cultures were infected with 2019-nCoV/WA isolate or icSARS-CoV-2-mNG at an MOI of 0.5. At 72 h p.i., viral burden was measured via FFA for the apical side. (D) Representative images of mock or icSARS-CoV-2-mNG infected (MOI = 0.5, 72 h p.i.) cultures stained for nuclei and phalloidin and imaged at ×60 on a confocal microscope. Percentage of GFP+ cells was determined using ImageJ software; z-stack reconstruction was created using Imaris software. All experiments were repeated twice with biological triplicates. Statistical analysis was performed using Prism software; a t test was performed to determine significance of qRT-PCR data and percent GFP+. *, P < 0.05; ****=, P < 0.0001.
FIG 2
FIG 2
Bulk RNA-Seq analysis of SARS-CoV-2-infected pHAE cultures. pHAE cultures were infected apically with SARS-CoV-2 (MOI = 0.25) for 48 h, at which point mock- and SARS-CoV-2-infected (n = 3) samples were harvested for bulk RNA-Seq analysis. (A) Volcano plot demonstrating DEGs. Lines indicate cutoffs; P value < 0.01; fold change less than −1.5 or greater than 1.5. Highlighted in red are the most highly upregulated genes (P value < 0.001; fold change > 1.5), in blue are most highly downregulated genes (P value < 0.001; fold change less than −1.5). (B) Normalized read counts (log2) of SARS-CoV-2 RNA products, using the MT246667.1 reference sequence.
FIG 3
FIG 3
SARS-CoV-2 infection promotes a proinflammatory and ER stress response in pHAE cultures. pHAE cultures were infected apically with SARS-CoV-2 (MOI = 0.25) for 48 h, at which point mock- and SARS-CoV-2-infected (n = 3) samples were harvested for bulk RNA-Seq analysis. For global DEG analysis, see Fig. 2. (A) Volcano plot with all DEGs in gray and the indicated gene set highlighted (purple, proinflammatory signaling). (B) GSEA plots of the enrichment score plotted against gene rank. Individual gene hits are indicated by the solid black line below the enrichment score curve. NES and P value are indicated on the plot. Gene sets are from the Hallmarks gene set from MSigDB. (C) Volcano plot illustrating barrier immunity-associated genes in orange. (D) Network map illustrating regulatory nodes for our DEGs. (E) GSEA plots for the indicated gene sets.
FIG 4
FIG 4
pHAE cultures produce proinflammatory cytokines and chemokines in response to SARS-CoV-2 infection. RNA-Seq analysis of the cytokine and chemokine response is shown. For global DEG analysis, see Fig. 2. (A) Heat map illustrating z-scores for the indicated genes in mock- and SARS-CoV-2-infected samples. (B) Supernatants were harvested from the apical and basolateral sides of SARS-CoV-2-infected pHAE cultures (MOI = 0.5) at 72 h p.i. Cytokine protein levels were determined by Luminex assay. Values below the limit of detection are designated nd. All statistical analysis was performed using Prism software. All data were analyzed using one-way or two-way ANOVA. *, P < 0.05; **, P < 0.01; ***, P < 0.001; ****, P < 0.0001.
FIG 5
FIG 5
pHAE cultures do not upregulate type I or III IFNs in response to SARS-CoV-2 infection. RNA-Seq analysis of the IFN response is shown; for global DEG analysis, see Fig. 2. (A) Normalized read counts in mock-infected (white) and SARS-CoV-2-infected (gray) samples of type I and type III IFNs. (B and C) Volcano plots illustrating all genes in gray and genes associated with IFN production in green (B) and genes associated with IFN signaling in pink (C). (D and E) Bar graphs indicating the normalized read count for interferon-stimulated genes (D) and type I and type III IFN receptors (E) for mock- and SARS-CoV-2-infected samples. (F and G) pHAE cultures were infected at an MOI of 0.5 with SARS-CoV-2 or H1N1 (California 2009) for 24 or 48 h, and qRT-PCR was used to quantify viral RNA for SARS-CoV-2 RdRp or H1N1 nucleoprotein (NP) (F) and type I or III IFNs and selected ISGs (G). All qRT-PCR data are represented as fold change over mock, untreated pHAE samples. Data are representative of those from two independent experiments, performed in biological triplicate. All statistical analysis was performed using Prism software. All data were analyzed using one-way or two-way ANOVA. *, P < 0.05; **, P < 0.01; ***, P < 0.001; ****, P < 0.0001.
FIG 6
FIG 6
Pretreatment with type I or III IFNs restricts SARS-CoV-2 replication in pHAE cultures. pHAE cultures were pretreated from the basolateral side with IFN-β1 or IFN-λ1 (100 IU/ml) for 24 h, after which cultures were infected apically (MOI = 0.25) and harvested at 24 h p.i. (A) Experimental schematic. (B) SARS-CoV-2 burden in untreated, IFN-β1-treated, and IFN-λ1-treated cultures as assessed via focus-forming assay. Percent reduction was calculated as the percentage of the untreated sample at 24 h p.i. (C and D) qRT-PCR analysis was performed at 24 h p.i. for viral RNA (C) or ISGs (D). qRT-PCR data are represented as fold change over mock, untreated pHAE samples. Data are representative of those from two independent experiments, performed in biological triplicate. All statistical analysis was performed using Prism software. All data were analyzed using one-way ANOVA. *, P < 0.05; **, P < 0.01; ***, P < 0.001; ****, P < 0.00001.
FIG 7
FIG 7
Posttreatment with type I or III IFNs decreases viral burden in pHAE cultures. pHAE cultures were infected with SARS-CoV-2 (MOI = 0.5) apically. At 24 h p.i., cultures were treated from the basolateral side with IFN-β1 or IFN-λ1 (100 IU/ml). At 72 h p.i. (48 h posttreatment), cultures were harvested for qRT-PCR analysis. (A) SARS-CoV-2 burden was assessed via FFA for the apical side of untreated, IFN-β1-treated, and IFN-λ1-treated cultures. Percent reduction was calculated for the 72-h time point. (B and C) qRT-PCR analysis at 72 h p.i. compared to mock, untreated samples, measuring viral RNA (B) or ISGs (C). qRT-PCR data are represented as fold change over mock. (D) Representative images of icSARS-CoV-2-mNG-infected pHAE cultures (MOI = 0.5), untreated or treated with IFN-β1 or IFN-λ1 at 72 h p.i. Percentage of GFP+ cells was counted using ImageJ software. Results are representative of those from two independent experiments performed in triplicate. All statistical analysis was performed using Prism 8 software. Growth curves were analyzed using two-way ANOVA. qRT-PCR data and microscopy data were analyzed using one-way ANOVA. *, P < 0.05; **, P < 0.01; ***, P < 0.001; ****, P < 0.0001.

References

    1. Zhou P, Yang XL, Wang XG, Hu B, Zhang L, Zhang W, Si HR, Zhu Y, Li B, Huang CL, Chen HD, Chen J, Luo Y, Guo H, Jiang RD, Liu MQ, Chen Y, Shen XR, Wang X, Zheng XS, Zhao K, Chen QJ, Deng F, Liu LL, Yan B, Zhan FX, Wang YY, Xiao GF, Shi ZL. 2020. A pneumonia outbreak associated with a new coronavirus of probable bat origin. Nature 579:270–273. doi: 10.1038/s41586-020-2012-7. - DOI - PMC - PubMed
    1. Zhu N, Zhang D, Wang W, Li X, Yang B, Song J, Zhao X, Huang B, Shi W, Lu R, Niu P, Zhan F, Ma X, Wang D, Xu W, Wu G, Gao GF, Tan W, China Novel Coronavirus Investigating and Research Team. 2020. A novel coronavirus from patients with pneumonia in China, 2019. N Engl J Med 382:727–733. doi: 10.1056/NEJMoa2001017. - DOI - PMC - PubMed
    1. World Health Organization. 2020. COVID-19 dashboard. https://covid19.who.int/.
    1. Wang W, Xu Y, Gao R, Lu R, Han K, Wu G, Tan W. 11 March 2020. Detection of SARS-CoV-2 in different types of clinical specimens. JAMA doi: 10.1001/jama.2020.3786. - DOI - PMC - PubMed
    1. Guan W-J, Ni Z-Y, Hu Y, Liang W-H, Ou C-Q, He J-X, Liu L, Shan H, Lei C-L, Hui DSC, Du B, Li L-J, Zeng G, Yuen K-Y, Chen R-C, Tang C-L, Wang T, Chen P-Y, Xiang J, Li S-Y, Wang J-L, Liang Z-J, Peng Y-X, Wei L, Liu Y, Hu Y-H, Peng P, Wang J-M, Liu J-Y, Chen Z, Li G, Zheng Z-J, Qiu S-Q, Luo J, Ye C-J, Zhu S-Y, Zhong N-S. 2020. Clinical characteristics of coronavirus disease 2019 in China. N Engl J Med 382:1708–1720. doi: 10.1056/NEJMoa2002032. - DOI - PMC - PubMed

Publication types

MeSH terms