

Life expectancy: what does it measure?
- PMID: 32699164
- PMCID: PMC7380844
- DOI: 10.1136/bmjopen-2019-035932
Life expectancy: what does it measure?
Abstract
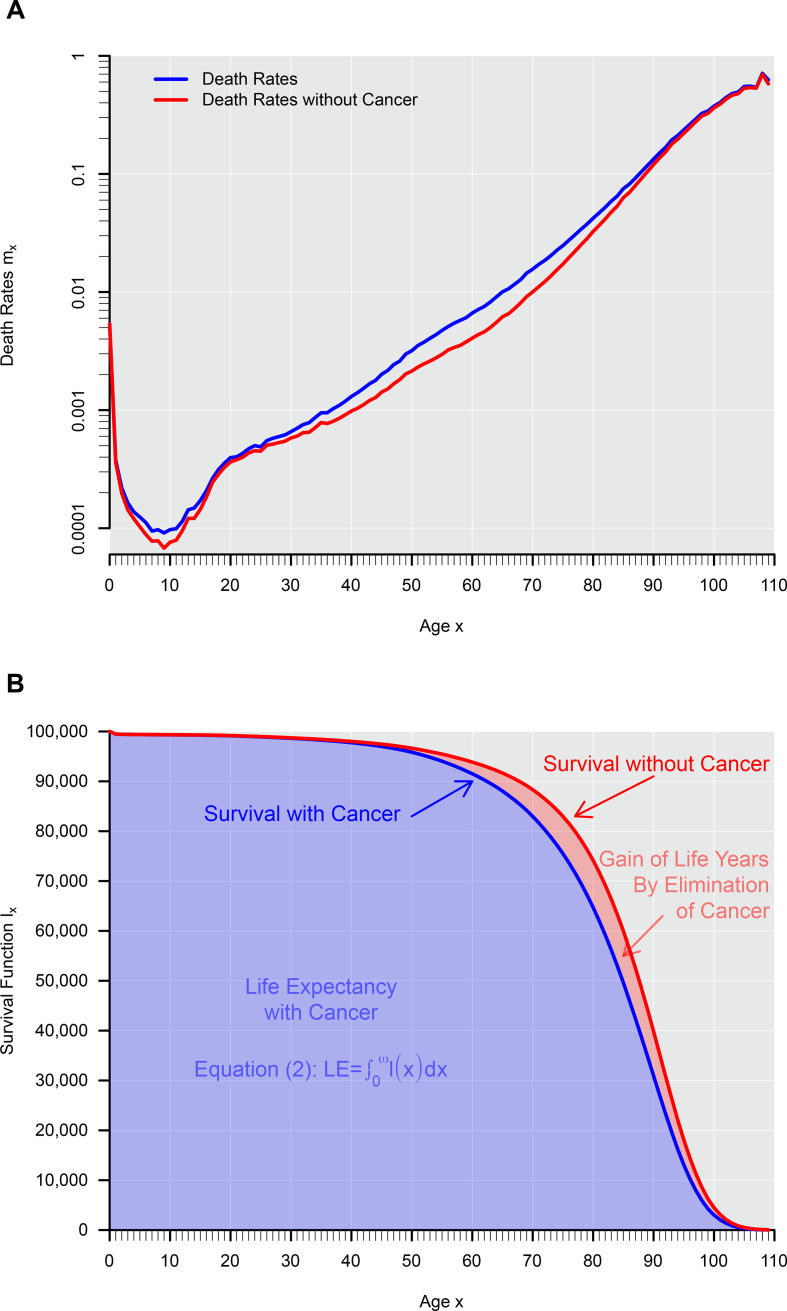
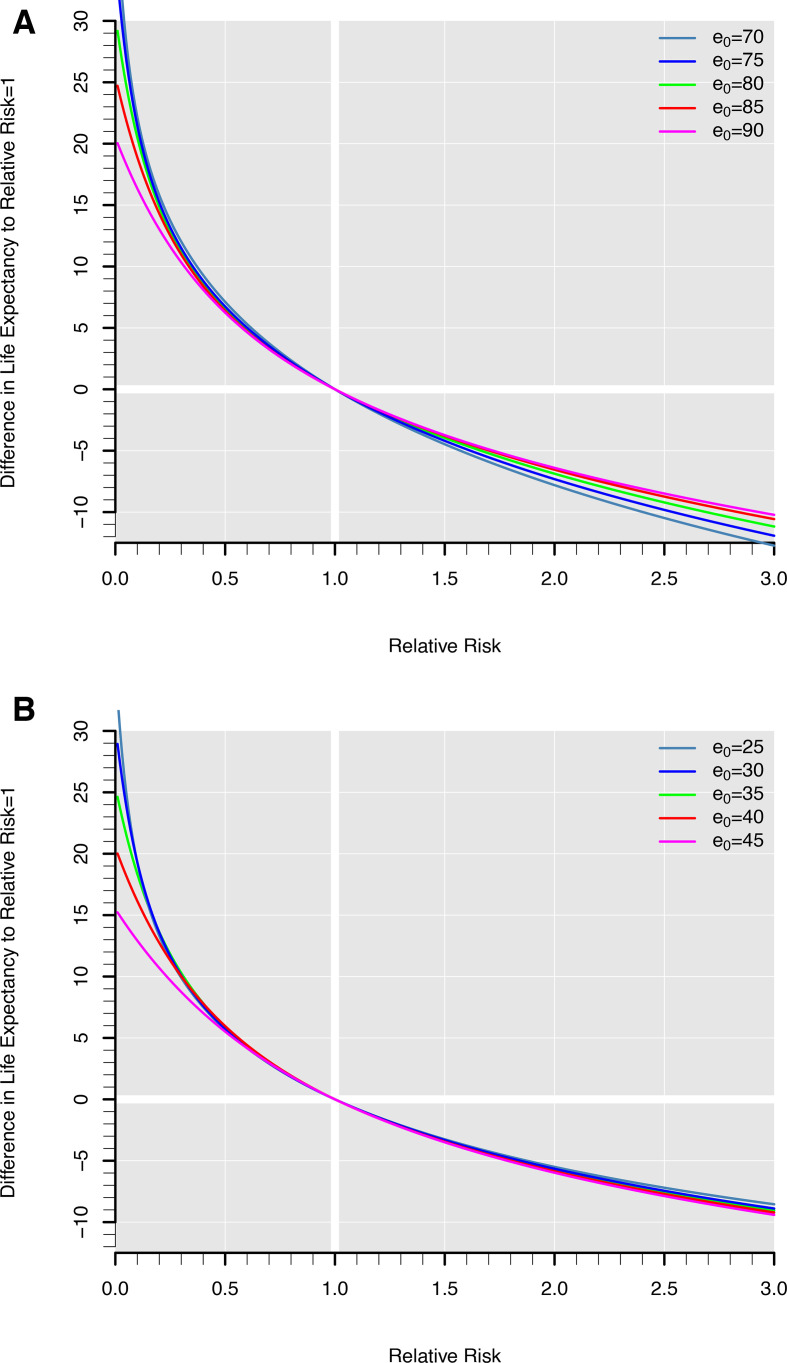
Life expectancy (LE) is considered a straightforward summary measure of mortality that comes with an implicit age standardisation. Thus, it has become common to present differences in mortality across populations as differences in LE, instead of, say, relative risks. However, most of the time LE does not quite provide what the term promises. LE is based on a synthetic cohort and is therefore not the true LE of anyone. Also, the implicit age standardisation is construed in such a way that it can be questioned whether it standardises age at all. In this paper, we examine LE from the point of view of its applicability to epidemiological and public health research and provide examples on the relation between an LE difference and a relative risk. We argue that the age standardisation in estimations of LE is not straightforward since it is standardised against different age distributions and that the translation of changes in age specific mortality into change in remaining LE will depend on the level and the distribution of mortality in the population. We conclude that LE is not the measure of choice in aetiological research or in research with the aim to identify risk factors of death, but that LE may be a compelling choice in public health contexts. One cannot escape the thought that the mathematical elegance of LE has contributed to its popularity.
Keywords: epidemiology; public health; statistics & research methods.
© Author(s) (or their employer(s)) 2020. Re-use permitted under CC BY-NC. No commercial re-use. See rights and permissions. Published by BMJ.
Conflict of interest statement
Competing interests: None declared.
Figures
References
-
- Preston SH, Heuveline P, Guillot M. Demography: measuring and modeling population processes. London: Wiley-Blackwell, 2001.
-
- USDoHaHScfDCaPPN Health, United States, 2016: with Chartbook on long-term trends in health, 2017. - PubMed
-
- Human Mortality Database University of California BU, and max Planck institute for demographic research (Germany). Available: www.mortality.org
Publication types
MeSH terms
LinkOut - more resources
Full Text Sources