. 2020 Jul 22;10(1):12156.
doi: 10.1038/s41598-020-68487-0.

Variations in foliar carbon:nitrogen and nitrogen:phosphorus ratios under global change: a meta-analysis of experimental field studies

Affiliations

Variations in foliar carbon:nitrogen and nitrogen:phosphorus ratios under global change: a meta-analysis of experimental field studies

Shan Xu et al. Sci Rep. .

Abstract

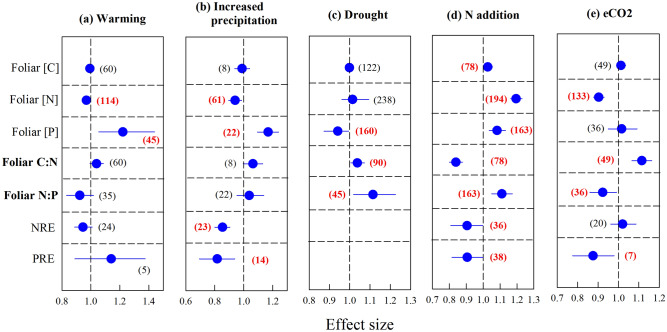
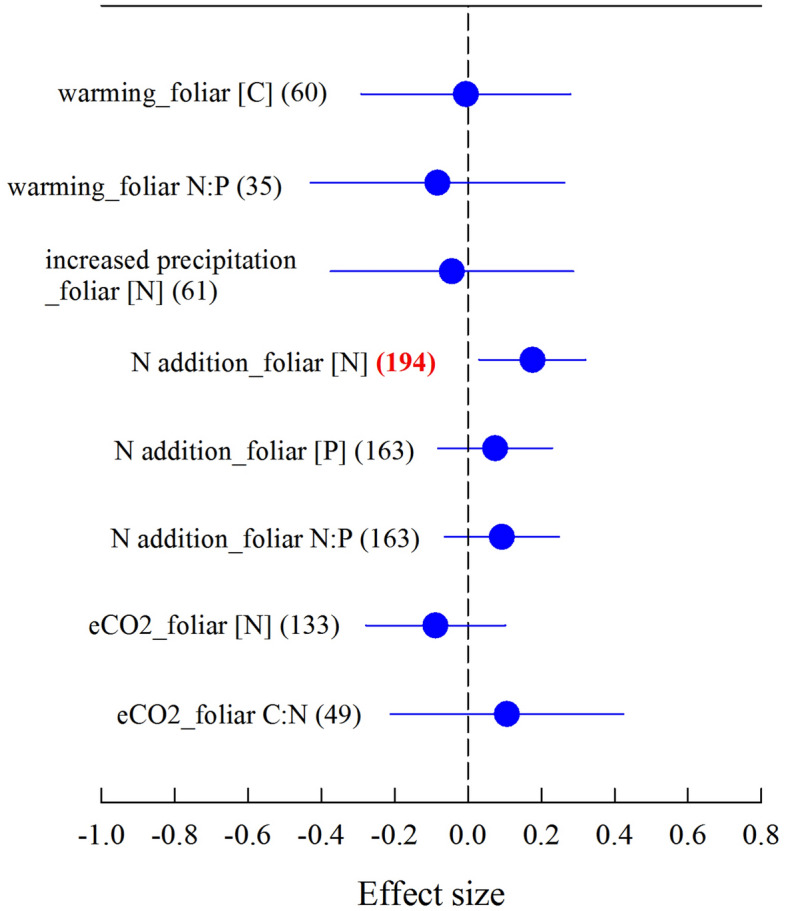
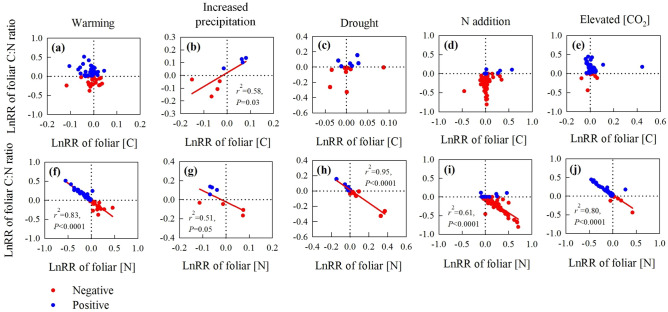
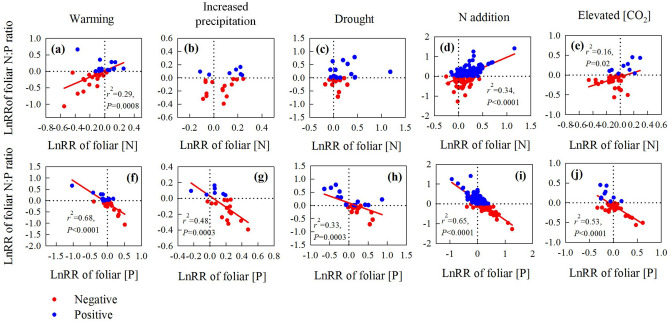
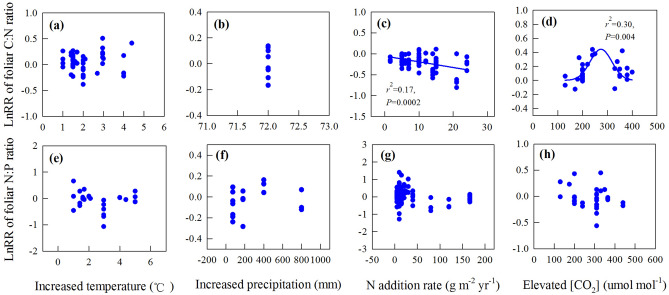
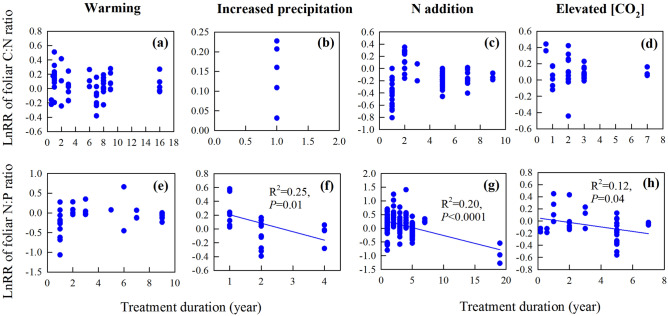
Foliar-level stoichiometry plays an important role in ecosystem elemental cycling. Shifts in foliar ratios of carbon to nitrogen (C:N) and nitrogen to phosphorus (N:P) in response to global change can therefore have a large impact upon ecosystem function. We conducted a meta-analysis with 2,236 paired observations from 123 published studies to investigate the responses of foliar C:N and N:P ratios to experimental global change treatments, i.e. warming, increased precipitation, drought, N addition and elevated carbon dioxide concentration (eCO2), in field conditions. Foliar C:N and N:P ratios were neither affected by warming nor by increased precipitation. Foliar C:N ratio increased with drought and eCO2, and decreased with N addition. Foliar N:P ratios declined with eCO2, and increased under drought and N addition. Our results suggested the responses of the C:N ratio to global change were mainly related to shifts in foliar [N], whereas changes in the N:P ratio were related to the responses of both [N] and [P]. Moreover, the response magnitude of foliar N:P ratio decreased with treatment duration under increased precipitation, N addition and eCO2. Our findings are important for our understanding of plant nutrient dynamic and modeling of nutrient biogeochemistry under global change.


Conflict of interest statement

The authors declare no competing interests.

Figures

Figure 1
Figure 1
Changes in foliar carbon ([C]), nitrogen ([N]) and phosphorus ([P]) concentrations, foliar carbon to nitrogen (C:N) and nitrogen to phosphorus (N:P) ratios, and N resorption efficiency (NRE) and P resorption efficiency (PRE) under (a) warming, (b) increased precipitation, (c) drought, (d) N addition and (e) elevated carbon dioxide concentration (e[CO2]), showing effect sizes as natural log response ratios for n studies (numbers in parenthesis) per response variable, where an effect size of 1 (dashed line) indicates no change relative to controls. Numbers in parenthesis in bold and red color represent the significant results. The figure was performed using Sigmaplot version 11.0 (Systat Software, Inc.).
Figure 2
Figure 2
Phylogenetic meta-analysis for the variables having phylogenetic signal (we have also included those variables for which phylogenetic signal was marginally significant, i.e. P < 0.1), showing effect sizes as natural log response ratios for n studies (numbers in parenthesis) per response variable, where an effect size of 0 (dashed line) indicates no change relative to controls. Numbers in parenthesis in bold and red color represent the significant results. The figure was performed using Sigmaplot version 11.0 (Systat Software, Inc.). The figure legends follow that of Fig. 1.
Figure 3
Figure 3
Correlations between the natural log response ratio (lnRR) of the foliar C:N ratio and [C] under (a) warming, (b) increased precipitation, (c) drought, (d) N addition and (e) eCO2 and the relationship between the lnRR of the foliar C:N ratio and [N] under (f) warming, (g) increased precipitation, (h) drought, (i) N addition and (j) eCO2. See Fig. 2 for definitions of the abbreviations. Red and blue dots represent negative and positive responses of the C:N ratio, respectively. The figure was performed using Sigmaplot version 11.0 (Systat Software, Inc.).
Figure 4
Figure 4
Correlations between the natural log response ratio (lnRR) of foliar N:P ratios and foliar [N] under (a) warming, (b) increased precipitation, (c) drought, (d) N addition and (e) eCO2 and the relationship between the lnRR of the foliar N:P ratio and [P] under (f) warming, (g) increased precipitation, (h) drought, (i) N addition and (j) eCO2. See Fig. 2 for definitions of the abbreviations. Red and blue dots represent negative and positive responses of the N:P ratio, respectively. The figure was performed using Sigmaplot version 11.0 (Systat Software, Inc.).
Figure 5
Figure 5
Correlations between the natural log response ratio (lnRR) of the foliar C:N ratio with (a) increased temperature (°C), (b) altered precipitation (mm), (c) N-addition rate (g m−2 years−1) and (d) eCO2 (µmol mol−1) and between lnRR of the N:P ratio with (e) increased temperature (°C), (f) altered precipitation (mm), (g) N-addition rate (g m−2 years−1) and (h) eCO2 (µmol mol−1). See Figs. 2 and 3 for the definitions of the abbreviations. The figure was performed using Sigmaplot version 11.0 (Systat Software, Inc.).
Figure 6
Figure 6
Correlations between the response ratios of foliar C:N ratio, foliar N:P ratio and the treatment duration of warming, changed precipitation, N addition and eCO2. N: nitrogen, C:N ratio: carbon to nitrogen ratio, N:P ratio: nitrogen to phosphorus ratio, [CO2]: carbon dioxide concentration, LnRR: natural log of the response ratio. The correlation was significant when P < 0.05. The figure was performed using Sigmaplot version 11.0 (Systat Software, Inc.).

References

    1. He JS, et al. Stoichiometry and large-scale patterns of leaf C and nitrogen in the grassland biomes of China. Oecologia. 2006;149:115–122. - PubMed
    1. Townsend AR, Cleveland CC, Asner GP, Bustamante MMC. Controls over foliar N:P ratios in tropical rain forests. Ecology. 2007;88:107–118. - PubMed
    1. Hättenschwiler S, et al. High variation in foliage and leaf litter chemistry among 45 tree species of a neotropical rainforest community. New Phytol. 2008;179:165–175. - PubMed
    1. Zhou G, et al. Climate and litter C/N ratio constrain soil organic carbon accumulation. Nat. Sci. Rev. 2019;6:746–757. - PMC - PubMed
    1. Vitousek PM, Porder S, Houlton BZ, Chadwick OA. Terrestrial phosphorus limitation: Mechanisms, implications, and nitrogen–phosphorus interactions. Ecol. Appl. 2010;20:5–15. - PubMed

Publication types