Observational Study
. 2020 Jul 22;11(1):3662.
doi: 10.1038/s41467-020-17033-7.

Rapid, deep and precise profiling of the plasma proteome with multi-nanoparticle protein corona

Affiliations
Observational Study

Rapid, deep and precise profiling of the plasma proteome with multi-nanoparticle protein corona

John E Blume et al. Nat Commun. .

Abstract

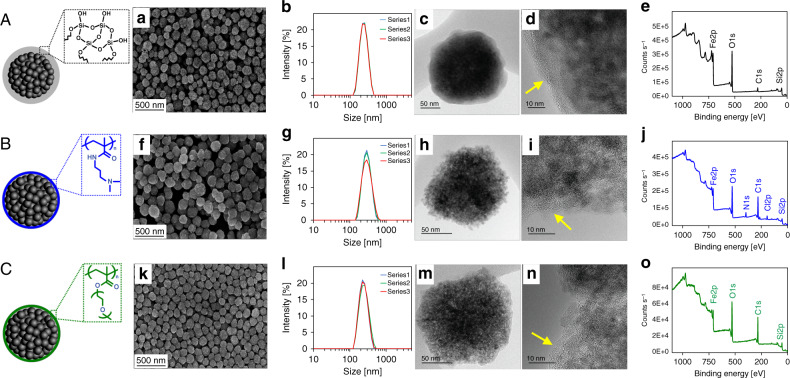
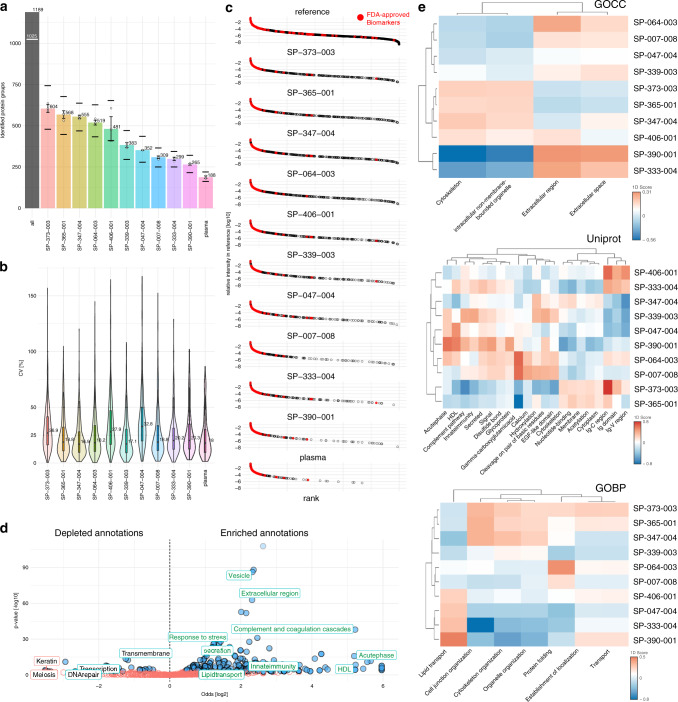
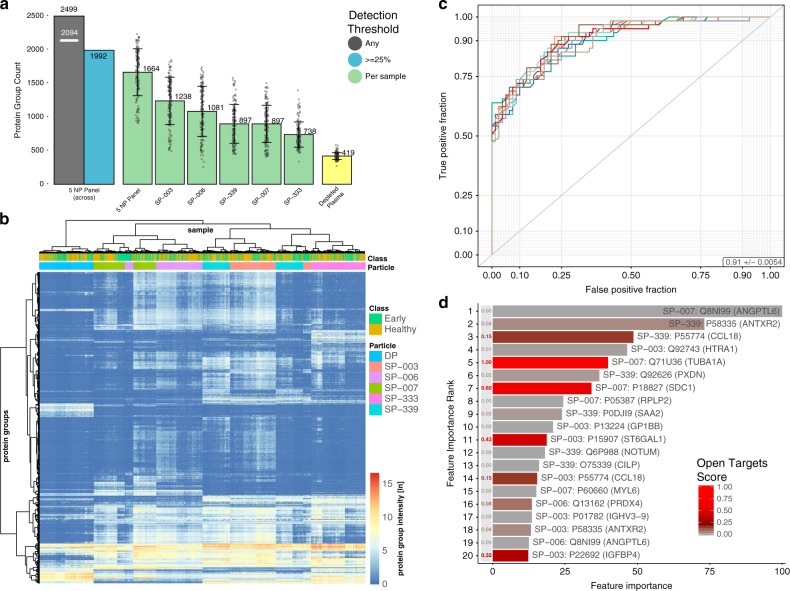
Large-scale, unbiased proteomics studies are constrained by the complexity of the plasma proteome. Here we report a highly parallel protein quantitation platform integrating nanoparticle (NP) protein coronas with liquid chromatography-mass spectrometry for efficient proteomic profiling. A protein corona is a protein layer adsorbed onto NPs upon contact with biofluids. Varying the physicochemical properties of engineered NPs translates to distinct protein corona patterns enabling differential and reproducible interrogation of biological samples, including deep sampling of the plasma proteome. Spike experiments confirm a linear signal response. The median coefficient of variation was 22%. We screened 43 NPs and selected a panel of 5, which detect more than 2,000 proteins from 141 plasma samples using a 96-well automated workflow in a pilot non-small cell lung cancer classification study. Our streamlined workflow combines depth of coverage and throughput with precise quantification based on unique interactions between proteins and NPs engineered for deep and scalable quantitative proteomic studies.


Conflict of interest statement

O.C.F. has financial interest in Selecta Biosciences, Tarveda Therapeutics, and Seer. R.L. is involved, compensated or uncompensated, in the entities listed in Supplementary Note 2. V.F. has financial interest in Celect and Seer. S.C. has financial interest in Kymera, PTM BioLabs, Pfizer, Biogen, and Seer. J.E.B, W.C.M., G.T., M.F., L.H., T.L.P., X.Z., R.A.C, P.A.E., M.K., H.L., E.M.E., M.M., S.F., C.S., R.B., B.H., H.X., D.H., A.S., and P.M. have financial interest in Seer. Only Seer, and no other companies mentioned here, was involved in the study design, data collection and analysis, and manuscript writing/editing.

Figures

Fig. 1
Fig. 1. Schematic of workflow of the Proteograph.
a Formation of NP protein corona. Different NP physicochemical properties (indicated by three different colors) led to the formation of different protein corona compositions on the NP surface. b Proteograph platform workflow based on multi-NP protein corona approach and mass spectrometry for plasma proteome analysis. The Proteograph workflow includes four steps: (1) NP-plasma incubation and protein corona formation; (2) NP protein corona purification by a magnet; (3) digestion of corona proteins; and (4) LC-MS/MS analysis. In this context, each plasma-NP well is a sample, for a total of 96 samples per plate.
Fig. 2
Fig. 2. Characterization of the three SPIONs.
A SP-003, B SP-007, and C SP-011, by a, f, k SEM, b, g, l DLS, c, h, m TEM, d, i, n HRTEM, and e, j, o XPS, respectively. DLS shows three replicates of each NP. Panels d, i, and n show the HRTEM pictures recorded at the surface of individual SP-003, SP-007, and SP-011 NPs, respectively, and the yellow arrow points to the region of d amorphous SiO2 coating and i, n amorphous SiO2/polymer coatings on the NP surface. Source data are provided as a Source Data file.
Fig. 3
Fig. 3. Proteomics characterization of the three initial SPIONs.
a Protein groups from the NP corona of the three initial SPIONs, SP-003, SP-007, and SP-011 as determined by DDA LC-MSMS and MaxQuant (MaxLFQ, 1% protein and peptide FDR). All: represents proteins detected across all NPs. White line indicates the number of proteins detected with two or more peptides with at least one NP. For respective NPs median count and standard deviation across three assay replicates are shown as bar plots. Upper dashes depict number of proteins detected in any sample; lower dashes depict number of proteins detected in all three replicates. White circles show number of protein IDs for each assay replicate. b CV% for precision evaluation (MaxLFQ, filtering for three out of three valid values) of the NP protein corona-based Proteograph workflow. Inner boxplots report the 25% (lower hinge), 50%, and 75% quantiles (upper hinge). Whiskers indicate observations equal to or outside hinge ± 1.5 * interquartile range (IQR). Outliers (beyond 1.5 * IQR) are not plotted. Violin plots capture all data points. c Correlation of the maximum intensities of NP corona proteins vs. plasma proteins to the published concentration of the same proteins (median of assay triplicates). The black lines are linear regression models, and the grey shaded regions represent 95% confidence interval. d Linearity of response for measurement for CRP protein on the SP-007 NP in a spike-recovery experiment. Error bars denote standard deviations around the mean. All data were acquired in n = 3 independent assay replicates. Source data are provided as a Source Data file.
Fig. 4
Fig. 4. Optimized panel of 10 SPIONs in comparison to neat plasma.
a Protein groups from the NP corona of 10 SPIONs, quantified by DDA LC-MS/MS (1% protein and peptide FDR). All: number of quantified protein groups across all NPs (excluding neat plasma). White line indicates the number of proteins detected with two or more peptides with at least one NP. For respective NPs median count and standard deviation across three assay replicates are shown as bar plots. Upper dashes depict number of proteins detected in any sample; lower dashes depict number of proteins detected in all three replicates. White circles show number of protein IDs for each assay replicate. b CV% distribution (precision) of the NP protein corona-based workflow for neat plasma and 10 SPIONs (filtering for three out of three valid values across assay replicates). Inner boxplots report the 25% (lower hinge), 50%, and 75% quantiles (upper hinge). Whiskers indicate observations equal to or outside hinge ± 1.5 * interquartile range (IQR). Outliers (beyond 1.5 * IQR) are not plotted. violin plots capture all data points. c Matching 10 SPIONs to a plasma protein database of MS intensities. Ranked intensities for the database proteins are shown in the top panel. Most intense protein is in the upper left corner of the panel; least intense is in the lower right corner. Intensities for proteins from neat plasma are shown in the bottom panel (plasma). Intensities for 10 SPIONs are shown in the remaining panels. Red dots indicated FDA-approved protein biomarkers. d Volcano plot depicting annotation enrichment analysis (Fisher’s exact test) for functional pathways (GOCC,GOBP, KEGG, Uniprot Keywords, Pfam) of proteins detected in the optimized panel of 10 NPs in comparison to the database. Enriched = Log2 Odds > 0; depleted = Log2 Odds < 0. Blue circles indicated pathways with a Benjamini–Hochberg (B.H.) false discovery rate (FDR) < 1%. Green annotations indicate some enriched annotations enriched for NPs. Selected depleted annotatons are depicted in black. Keratin and Meiosis are depleted annotations with a B.H. FDR > 5%. e 1D annotation enrichment analysis comparing the protein intensity distribution (median intensity across assay triplicates, requiring three out of three quantifications) of each NP against the average of all. 1D scores are plotted as heat maps for annotations (minimal size 11) that are significantly enriched or depleted (2% B.H. FDR) for at least 1 NP. All data were acquired in n = 3 independent assay replicates. Source data are provided as a Source Data file.
Fig. 5
Fig. 5. Classification of early NSCLC vs healthy using five NPs.
a Protein group counts by NP and depleted plasma (filtered for 1% peptide and protein FDR). The green bars show the mean number of proteins in the cohort of 141 subjects found with the five NPs. The yellow bar shows the mean number of proteins in the cohort of 141 subjects for depleted plasma, the black bar shows the number of proteins across the five NP panel and all 141 subjects. The white line indicates the proteins that were detected with two peptides or more with one or more NP. The blue bar shows number of proteins across the five NP panel that were detected in at least 25% of all 141 subjects. Error bars depict standard deviation of identifications. White circles show number of protein IDs for each biological sample. b Heatmap showing the median normalized intensities (natural logarithm) of protein groups (rows) detected with five NPs (columns) or depleted plasma across 141 subjects (early NSCLC and healthy). Protein groups were filtered for 1% peptide and protein FDR and detection in at least 10% of the samples. Missing values were set to 0 (dark blue). Hierarchical clustering was performed in R using the ward.d2 method. c Receiver operating characteristic (ROC) curves quantifying the classification performance of healthy vs. early-stage NSCLC patients. Each colored curve represents one of the 10 repeats of the 10-fold cross validation where the performance was assessed on the hold-out test splits. The ROC average area under the curve (AUC) for across the 10 repeats is 0.91. d Top 20 most important features to classify healthy vs early NSCLC, with the color gradient showing the associated Open Targets Score for lung carcinoma targets. Source data are provided as a Source Data file.

References

    1. Anderson NL. The clinical plasma proteome: a survey of clinical assays for proteins in plasma and serum. Clin. Chem. 2010;56:177–185. - PubMed
    1. Crutchfield CA, Thomas SN, Sokoll LJ, Chan DW. Advances in mass spectrometry-based clinical biomarker discovery. Clin. Proteom. 2016;13:1. - PMC - PubMed
    1. Geyer PE, Holdt LM, Teupser D, Mann M. Revisiting biomarker discovery by plasma proteomics. Mol. Syst. Biol. 2017;13:942. - PMC - PubMed
    1. Geyer PE, et al. Plasma proteome profiling to assess human health and disease. Cell Syst. 2016;2:185–195. - PubMed
    1. Keshishian H, et al. Quantitative, multiplexed workflow for deep analysis of human blood plasma and biomarker discovery by mass spectrometry. Nat. Protoc. 2017;12:1683–1701. - PMC - PubMed

Publication types

MeSH terms