. 2020 Jul 22;10(1):12142.
doi: 10.1038/s41598-020-68662-3.

Annotation-free learning of plankton for classification and anomaly detection

Affiliations

Annotation-free learning of plankton for classification and anomaly detection

Vito P Pastore et al. Sci Rep. .

Abstract

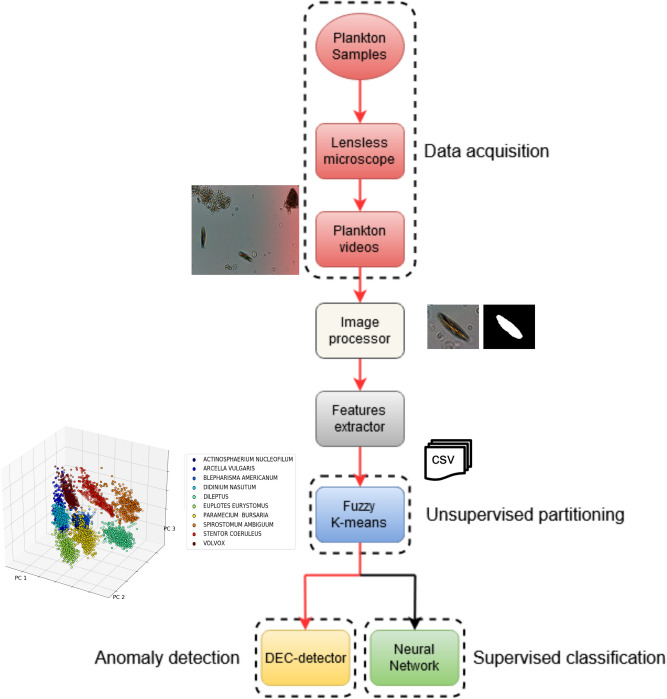
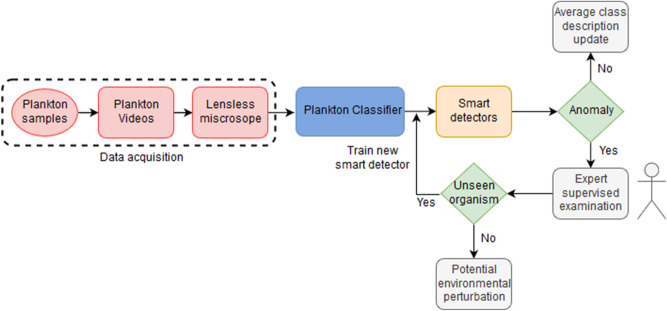
The acquisition of increasingly large plankton digital image datasets requires automatic methods of recognition and classification. As data size and collection speed increases, manual annotation and database representation are often bottlenecks for utilization of machine learning algorithms for taxonomic classification of plankton species in field studies. In this paper we present a novel set of algorithms to perform accurate detection and classification of plankton species with minimal supervision. Our algorithms approach the performance of existing supervised machine learning algorithms when tested on a plankton dataset generated from a custom-built lensless digital device. Similar results are obtained on a larger image dataset obtained from the Woods Hole Oceanographic Institution. Additionally, we introduce a new algorithm to perform anomaly detection on unclassified samples. Here an anomaly is defined as a significant deviation from the established classification. Our algorithms are designed to provide a new way to monitor the environment with a class of rapid online intelligent detectors.


Conflict of interest statement

The authors declare no competing interests.

Figures

Figure 1
Figure 1
Schematic overview of the pipeline used to detect and classify plankton species with minimal supervision. Our preferred embodiment is represented by the red lines.
Figure 2
Figure 2
Unsupervised clustering results. a,b We performed a PCA analysis on the lensless digital microscope dataset to provide a graphical representation of the data distribution into the features space. We plot the first three principal components that account for ~ 67% of the total variance. We assigned different colors to the different plankton species. a Species are assigned using ground truth labels. b Species are assigned to the most overlapping cluster resulting from the unsupervised partitioning procedure. c,d Same analysis and procedure applied on the WHOI dataset. c Species are assigned using ground truth labels. d Species are assigned to the most overlapping cluster, resulting from the unsupervised partitioning procedure. e Distribution of number of clusters computed using our PE algorithm for a random subset of species in the lensless microscope dataset. Results are reported for different initial number of species. f Effect of class imbalance. For each of the ten species included into the lensless microscope dataset, we simulated class imbalance by increasing the number of images available to the clustering algorithm for the considered species. g,h PCA analysis on the lensless digital microscope dataset provides a graphical representation of the data distribution into the deep features space. The unsupervised partitioning using deep features is highly accurate. The first three principal components are plotted and different colors to the different plankton species are assigned. g Species are assigned using ground truth labels. h Species are assigned to the most overlapping cluster resulting from the unsupervised partitioning.
Figure 3
Figure 3
Feature space representation and classification performances. a, b Multidimensional visualization of the geometric subset of the ten species in the lensless microscope dataset, obtained using the following methods (see Supporting Information): a Andrew’s curve. b Parallel coordinates. c ROC curves obtained for the neural network classifier trained on the labels provided by the clustering algorithm for the lensless microscope dataset. d Corresponding confusion matrix.
Figure 4
Figure 4
Delta-enhanced class detector performances and results. a Confusion matrix corresponding to each of the ten neural networks trained on the lensless microscope dataset. b Overall testing accuracy performances for each of the ten testing classes. The number used on x axis to label each species correspond to the species number in panel ac,d DEC detector anomaly detection performances tested on in silico generated data. c Testing accuracy performances for varying percentage values of in silico species similarity with the trained species. d Example of average features space parallel coordinates plot for the in-silico species obtained using the species Spirostomum Ambiguum. By increasing the similarity, the features of the surrogate species approach the features of the real species, resulting in an increased average anomaly misclassification rate, decreasing the overall accuracy levels. e Detection of unknown species. The panel shows the percentage of samples detected by all the DEC detectors as anomaly, when removing one training species from the set, for each of the ten training species. These numbers reflect the level of accuracy of the proposed algorithm in detecting unseen species. The number used on x axis to label each species correspond to the species number in panel a.
Figure 5
Figure 5
Proposed real-time smart environmental monitoring pipeline.
Figure 6
Figure 6
Deep features extraction. Deep CNN implemented for the purpose of deep features extraction. The blue layers represent convolutional layers, the grey ones represent a max pooling 2D operation. The fully connected layer with 128 neurons output has been used as feature set to the subsequent modules in our pipeline.
Figure 7
Figure 7
ANN architectures implemented for classification based on the extracted features.
Figure 8
Figure 8
Schematic representation of DEC detector architecture.

References

    1. Sournia A, Chrdtiennot-Dinet M-J, Ricard M. Marine phytoplankton: How many species in the world ocean? J. Plankton Res. 1991;13(5):1093–1099. doi: 10.1093/plankt/13.5.1093. - DOI
    1. Behrenfeld MJ, et al. Biospheric primary production during an ENSO transition. Science. 2001;291(5513):2594–2597. doi: 10.1126/science.1055071. - DOI - PubMed
    1. Richardson AJ, et al. Using continuous plankton recorder data. Prog. Oceanogr. 2006;68(1):27–74. doi: 10.1016/j.pocean.2005.09.011. - DOI
    1. Fossum TO, et al. Toward adaptive robotic sampling of phytoplankton in the coastal ocean. Sci. Robot. 2019;4(27):eaav3041. doi: 10.1126/scirobotics.aav3041. - DOI - PubMed
    1. Zimmerman, T. G. & Smith, B. A. Lensless stereo microscopic imaging. In ACM SIGGRAPH 2007 Emerging Technologies, New York, NY, USA (2007). 10.1145/1278280.1278296.

Publication types