. 2020 Jul 22;10(1):12242.
doi: 10.1038/s41598-020-69021-y.

Vitamin D protects against immobilization-induced muscle atrophy via neural crest-derived cells in mice

Affiliations

Vitamin D protects against immobilization-induced muscle atrophy via neural crest-derived cells in mice

Satoshi Nakamura et al. Sci Rep. .

Abstract

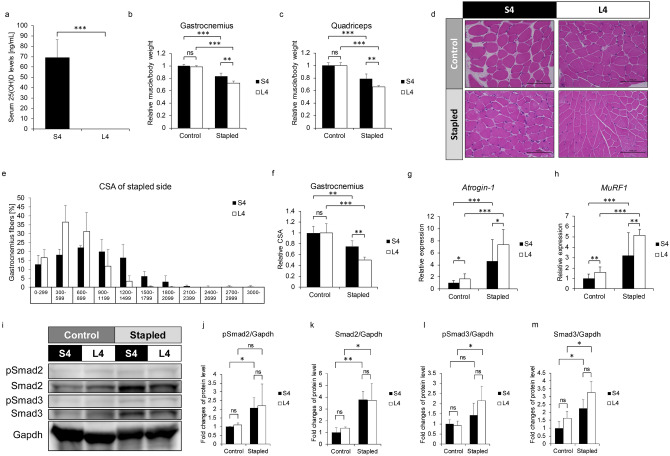
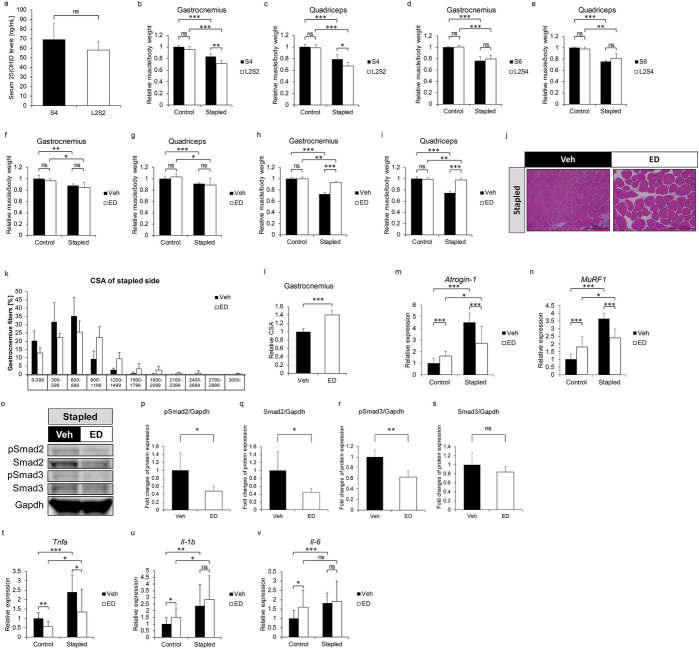
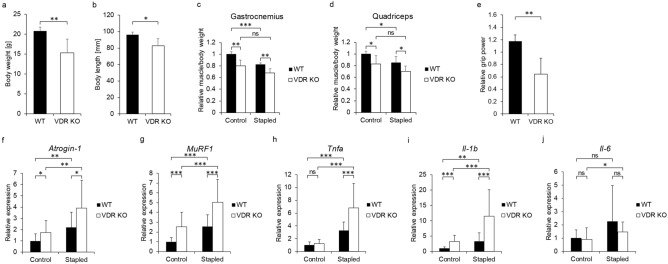
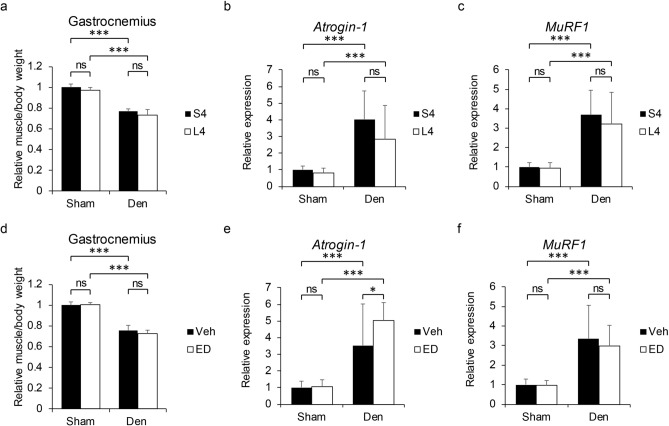
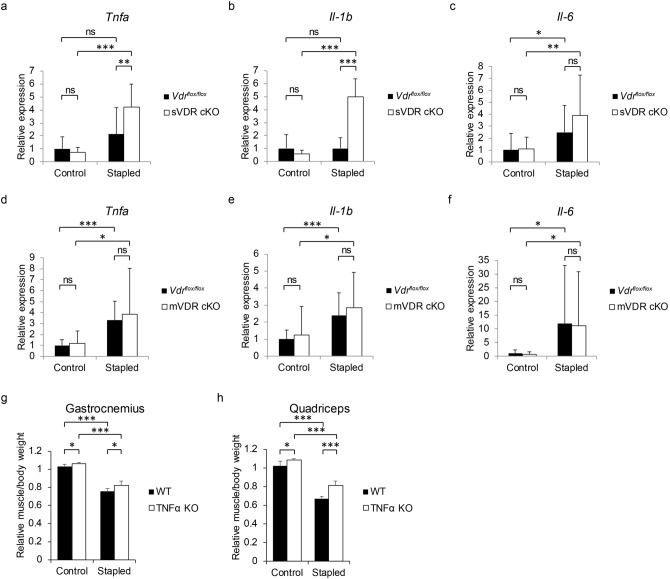
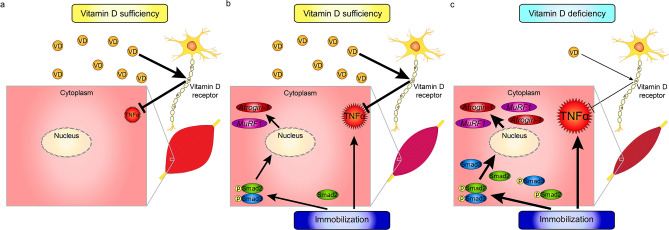
Vitamin D deficiency is a recognized risk factor for sarcopenia development, but mechanisms underlying this outcome are unclear. Here, we show that low vitamin D status worsens immobilization-induced muscle atrophy in mice. Mice globally lacking vitamin D receptor (VDR) exhibited more severe muscle atrophy following limb immobilization than controls. Moreover, immobilization-induced muscle atrophy was worse in neural crest-specific than in skeletal muscle-specific VDR-deficient mice. Tnfα expression was significantly higher in immobilized muscle of VDR-deficient relative to control mice, and was significantly elevated in neural crest-specific but not muscle-specific VDR-deficient mice. Furthermore, muscle atrophy induced by limb immobilization in low vitamin D mice was significantly inhibited in Tnfα-deficient mice. We conclude that vitamin D antagonizes immobilization-induced muscle atrophy via VDR expressed in neural crest-derived cells.


Conflict of interest statement

The authors declare no competing interests.

Figures

Figure 1
Figure 1
Vitamin D deficiency worsens immobilization-induced skeletal muscle atrophy. 6-week-old C57BK/6 female mice were fed a low (L) or standard (S) vitamin D diet for 4 weeks (L4 or S4 groups). Their left hind limbs were stapled at 9-weeks of age and mice were sacrificed 1 week after stapling. (a) Sera were collected at sacrifice (each group n = 5). Serum 25(OH)D levels were analyzed by radio immunoassay. (b, c) Wet weights of gastrocnemius (b) and quadriceps (c) muscles adjusted to body weight in the stapled versus the control side in S4 and L4 groups. Representative data of 2 independent experiments are shown. (d) Hematoxylin and eosin staining of gastrocnemius muscles in control and stapled sides of S4 and L4 groups. Scale bar, 100 µm. (e) Frequency distribution of fiber area of gastrocnemius muscles in the stapled side of S4 and L4 groups (x axis, fiber area; y axis, % of cross-sectional area (CSA) of muscle fiber; data represent mean % CSA ± SD). (f) Relative mean cross-sectional areas (CSA) of gastrocnemius muscles on control and stapled sides of S4 and L4 groups. (gh) Relative Atrogin-1 (g) and MuRF1 (h) expression in control and stapled gastrocnemius muscles of S4 and L4 groups based on quantitative realtime PCR. (i) Western blot of Smad2 and 3 protein in control and stapled gastrocnemius muscles of S4 and L4 groups. Representative images are shown. (jm) Quantitation of levels of phosphorylated Smad2 (j), total Smad2 (k), phosphorylated Smad3 (l) and total Smad3 (m) per Gapdh shown as means ± SD relative to control side of S4 and L4 groups (S4, n = 3; L4, n = 3). (b, c and f) Means ± SD relative to control side of S4 group are shown. (g and h) Shown is mean indicated expression relative to Gapdh ± SD relative to control side of S4 group. Statistical analysis was done by Student’s t-test (*P < 0.05; **P < 0.01; ***P < 0.001; ns, not significant).
Figure 2
Figure 2
Refeeding a normal vitamin D diet or treatment with a vitamin D analogue rescues atrophy phenotypes following muscle immobilization. (ac) 6-week-old female WT mice were fed the L diet for 2 weeks and then the S diet for 2 weeks (L2S2 group), or fed the S diet for 4 weeks (S4 group). Hind limbs were stapled at 9-weeks of age during the diet regime. Mice were sacrificed 1 week after stapling, and Sera were collected (Each group n = 5). (a) Serum 25(OH)D levels in indicated groups were analyzed by radioimmunoassay. (b, c) Weights of gastrocnemius (b) and quadriceps (c) muscles adjusted to body weight relative to those of control sides of the S4 and L2S2 groups. (d, e) 6-week-old female WT mice were fed the L diet for 2 weeks and then the S diet for 4 weeks (L2S4 group), or fed the S diet for 6 weeks (S6 group). Left hind limbs were stapled at 11-weeks of age and mice were sacrificed 1 week after stapling (each group n = 5). Wet weights of gastrocnemius (d) and quadriceps (e) muscles adjusted to body weight of S6 and L2S4 groups relative to control sides of the S6 group. (fv) 6-week-old female WT mice were fed the S (f and g) or L (hv) diet, and treated with 3.5 ng ED71 (ED group) or vehicle (Veh group) twice per week starting at 8 weeks of age. Left hind limbs stapled at 9 weeks of age and mice were sacrificed a week later (each group n = 5). (fi) Wet weights of gastrocnemius (f and h) and quadriceps (g and i) adjust to body weight in Veh and ED groups fed the S (f and g) or L (h and i) diet. (j) Hematoxylin and eosin staining of gastrocnemius muscles on stapled side of indicated groups fed an L diet. Scale bar, 100 µm. (k) Frequency distribution of fiber area of gastrocnemius muscles on stapled side of indicated groups fed the L diet (h; x axis, fiber area; y axis, % of cross-sectional area (CSA) of muscle fiber; data are mean % of CSA ± SD). (l) Relative mean CSA. (m, n) Relative Atrogin-1 (m) and MuRF1 (n) expression in control and stapled gastrocnemius muscles of indicated group fed the L diet as analyzed by quantitative realtime PCR. (o) Smad2 and 3 total and phosphorylated protein levels in stapled gastrocnemius muscles of indicated groups fed the L diet, based on western blotting. Representative images are shown. (ps) Quantitation of data shown in (o). (tv) Relative expression of indicated cytokines in control and stapled gastrocnemius muscles of Veh and ED group fed the L diet, based on quantitative realtime PCR. (be and f–i) Means ± SD were shown relative to control side of S4 (be) or Veh (fi) group. (m, n and tv) Shown is mean indicated expression relative to Gapdh ± SD relative to control side of Veh group. (ps) Shown is mean indicated protein levels relative to Gapdh ± SD relative to the Veh group. Statistical analysis was done by Student’s t-test (*P < 0.05; **P < 0.01; ***P < 0.001; ns, not significant). (bi, m, n and tv) Shown are representative data of 2 independent experiments.
Figure 3
Figure 3
VDR KO mice exhibit worsened atrophy after immobilization and elevated expression of Atrogin-1, MuRF1, Tnfa and Il-1b. VDR KO or WT mice were fed a high calcium diet after weaning, their left hind limbs were stapled at 9 weeks of age, and animals were sacrificed 1 week later (each mouse n = 5). (a, b) Body weight (a) and length (b) of WT and VDR KO mice at sacrifice. (c, d) Wet weights of gastrocnemius (c) and quadriceps (d) muscles adjusted to body weight on control and stapled sides of WT and VDR KO mice relative to values on WT control side. (e) Forelimb grip power of VDR KO mice relative to WT mice. (gi) Relative Atrogin-1 (f), MuRF1 (g), Tnfa (h), Il-1b (i) and Il-6 (j) expression in control and stapled gastrocnemius muscles of indicated mice relative to WT control side, as determined by quantitative realtime PCR (each mouse n = 6). (c, d) means ± SD relative to control side of WT mice are shown. (e) mean ± SD relative to WT mice is shown. (f–j) Mean expression relative to Gapdh ± SD relative to WT mice is shown. Statistical analysis was done by Student’s t-test (*P < 0.05; **P < 0.01; ***P < 0.001; ns, not significant). (ae) Representative data of 2 independent experiments.
Figure 4
Figure 4
Vitamin D attenuates immobilization-induced muscle atrophy through VDR expressed in neural crest-derived cells. Neural-crest-specific sVDR cKO (P0 Cre;VDRflox/flox), skeletal-muscle-specific mVDR KO (CkmmCre;Vdrflox/flox) and control (Vdrflox/flox) female mice were fed the S diet, their hind limbs were stapled at 9 weeks of age, and they were sacrificed 1 week later. (ae, fj) Wet weights of gastrocnemius (a, f) and quadriceps (b, g) muscles adjusted to body weight in control and stapled sides of sVDR cKO (a, b), mVDR cKO (f, g) or Vdrflox/flox mice (a, b, f and g) relative to the control side of Vdrflox/flox mice. Hematoxylin and eosin staining (c, h), frequency distribution of fiber area (d, i) and relative mean CSA (e, j) of gastrocnemius muscles in stapled side of sVDR cKO (ce), mVDR cKO (hj) and Vdrflox/flox mice (c, h; Scale bar, 100 µm. d, i; x axis, fiber area; y axis, % of cross-sectional area (CSA) of muscle fiber; data are mean % of CSA ± SD). (k-n) Relative Atrogin-1 (k, m) or MuRF1 (l, n) expression in control or stapled gastrocnemius muscles of indicated genotypes. (a, b, eg and j) Means ± SD of sVDR cKO (a, b and e), mVDR cKO (f, g and j) or Vdrflox/flox mice relative to those in control side of Vdrflox/flox mice. (kn) Mean expression relative to Gapdh ± SD of sVDR cKO (k and l), mVDR cKO (m, n) or Vdrflox/flox mice relative to Vdrflox/flox mice is shown. Statistical analysis was done by Student’s t-test (*P < 0.05; **P < 0.01; ***P < 0.001; ns, not significant). (a, b, f, g, m and n) Representative data of 2 independent experiments are shown.
Figure 5
Figure 5
Denervation-induced skeletal muscle atrophy is not affected by vitamin D deficiency and vitamin D analogue treatment. 6-week-old C57BK/6 female mice were fed a standard (S) or low (L) vitamin D diet for 4 weeks (S4 or L4 group), and treated with 3.5 ng ED71 (ED group) or vehicle (Veh group) by intraperitoneal injection 2 times per week from 8-week old. Their left sciatic nerve was cut, and 1-mm portion was removed to denervate gastrocnemius muscle at 9-week of age. Their right hind limb was receipted only skin incision as sham surgery. They were sacrificed 1 week after surgery. (each group n = 5). (a, d) Wet weights of gastrocnemius muscles adjusted with body weight of S4 or L4 group with vehicle injection (a), and L4 group with vehicle or ED71 injection (d). (b, c, e, f) Relative expressions of Atrogin-1 (b, e) and MuRF1 (c and f) in control (sham) and denervated gastrocnemius muscles of S4 or L4 group with vehicle injection (b, c), and L4 with vehicle or ED71 injection (e, f). Mean ± SD relative to sham side of S4 (ac) or Veh (df) group are shown. Statistical analysis was done by Student’s t-test (*P < 0.05; **P < 0.01; ***P < 0.001; ns, not significant).
Figure 6
Figure 6
VDR in neural crest derived cells protects skeletal muscles from increased levels of Tnfa expression and immobilization-induced atrophy. (a-f) sVDR (neural-crest-specific) or mVDR (skeletal-muscle-specific) KO or control (Vdrflox/flox) female mice were fed the S diet, their hind limbs stapled at 9 weeks of age, and mice were sacrificed 1 week after stapling for analysis of expression of Tnfa (a, d), Il-b (b, e) and Il-6 (c, f) relative to Gapdh in gastrocnemius muscles of indicated genotypes. (g, h) 6-week-old female TNFα KO (Tnfα-/-) or WT mice were fed the L diet and subjected to the same protocol as described above (each group n = 5). Wet weights of gastrocnemius (g) and quadriceps (h) muscles adjusted to body weight in control and stapled sides of TNFα KO and WT mice were determined relative to values on the WT control side. (ah) Mean indicated parameters in sVDR cKO, mVDR cKO, Vdrflox/flox (af), TNFα KO or WT (g and h) mice ± SD relative to those on the stapled side of Vdrflox/flox (af) of WT (g and h) mice are shown. Statistical analysis was done by Student’s t-test (*P < 0.05; **P < 0.01; ***P < 0.001; ns, not significant).
Figure 7
Figure 7
Model showing relationship of vitamin D activity to immobilization-induced skeletal muscle atrophy. Depicted is (a) the normal state in conditions of vitamin D sufficiency, (b) that same state subjected to immobilization, and (c) immobilization in the presence of a vitamin D-deficient state.

References

    1. Cruz-Jentoft AJ, et al. Sarcopenia: European consensus on definition and diagnosis: Report of the European Working Group on Sarcopenia in Older People. Age Ageing. 2010;39:412–423. - PMC - PubMed
    1. Conzade R, et al. Vitamin D in relation to incident sarcopenia and changes in muscle parameters among older adults: the KORA-age study. Calcif. Tissue Int. 2019;105:173–182. - PubMed
    1. Scott D, Blizzard L, Fell J, Ding C, Winzenberg T, Jones G. A prospective study of the associations between 25-hydroxy-vitamin D, sarcopenia progression and physical activity in older adults. Clin. Endocrinol. 2010;73:581–587. - PubMed
    1. Cummings SR, et al. Bone density at various sites for prediction of hip fractures. The Study of Osteoporotic Fractures Research Group. Lancet. 1993;341:72–75. - PubMed
    1. Odvina CV, Wergedal JE, Libanati CR, Schulz EE, Baylink DJ. Relationship between trabecular vertebral body density and fractures: a quantitative definition of spinal osteoporosis. Metabolism. 1988;37:221–228. - PubMed