. 2020 Jul;583(7817):578-584.
doi: 10.1038/s41586-020-2486-3. Epub 2020 Jul 22.

Six reference-quality genomes reveal evolution of bat adaptations

Affiliations

Six reference-quality genomes reveal evolution of bat adaptations

David Jebb et al. Nature. 2020 Jul.

Abstract

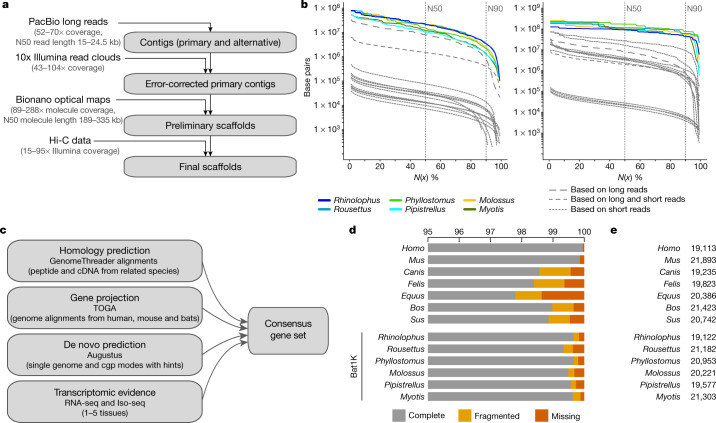
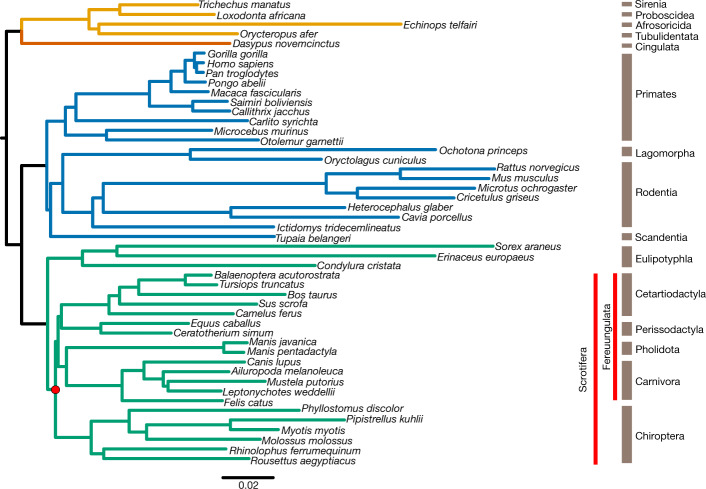
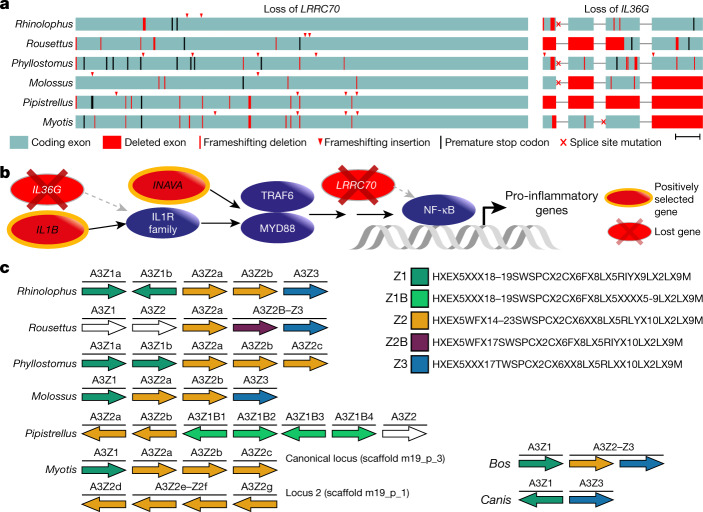
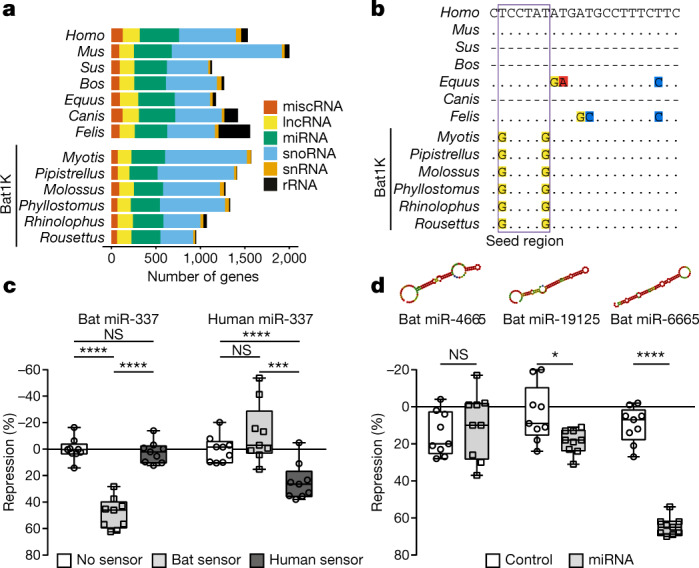
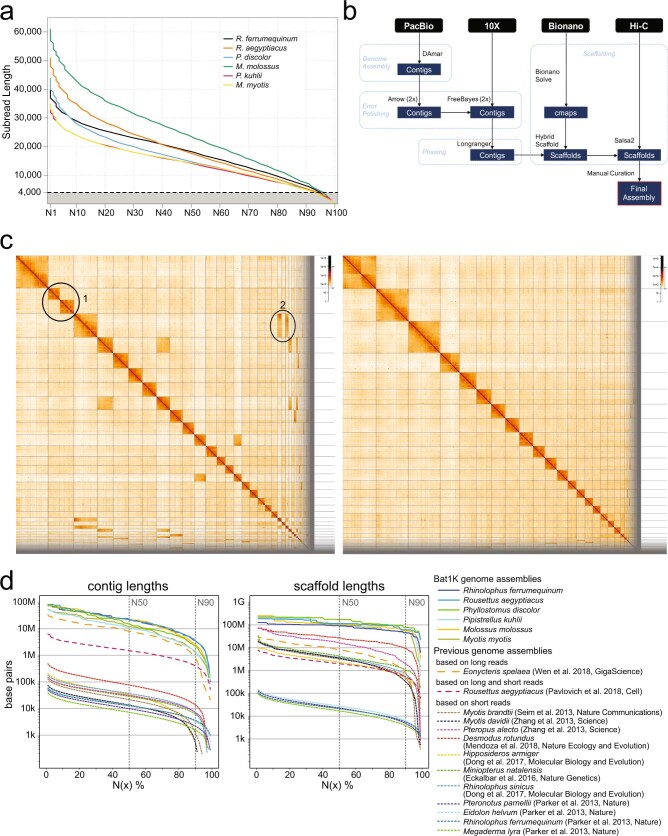
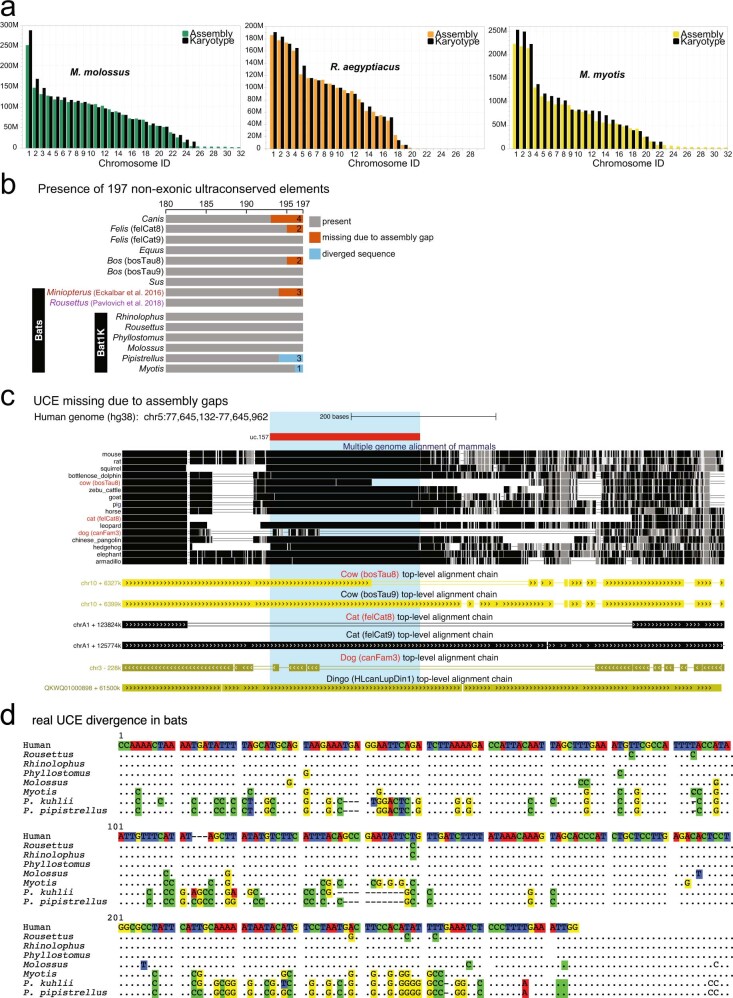
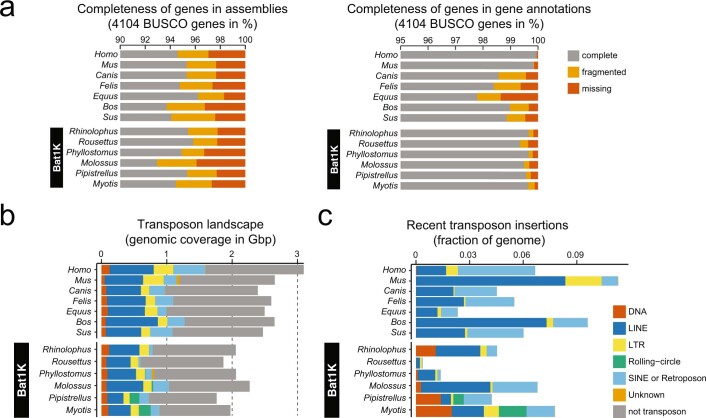
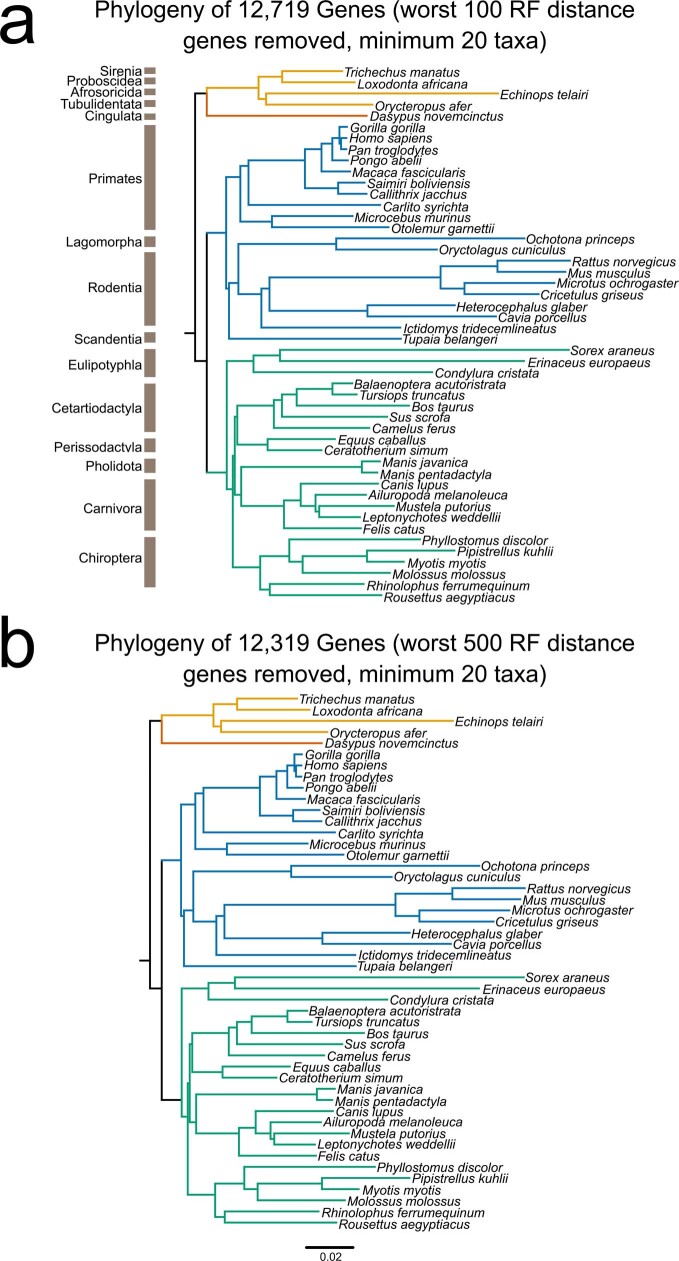
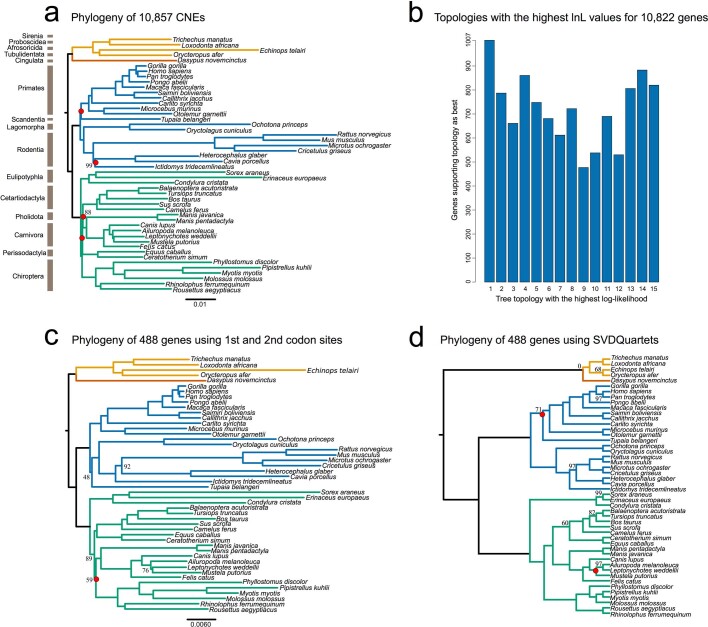
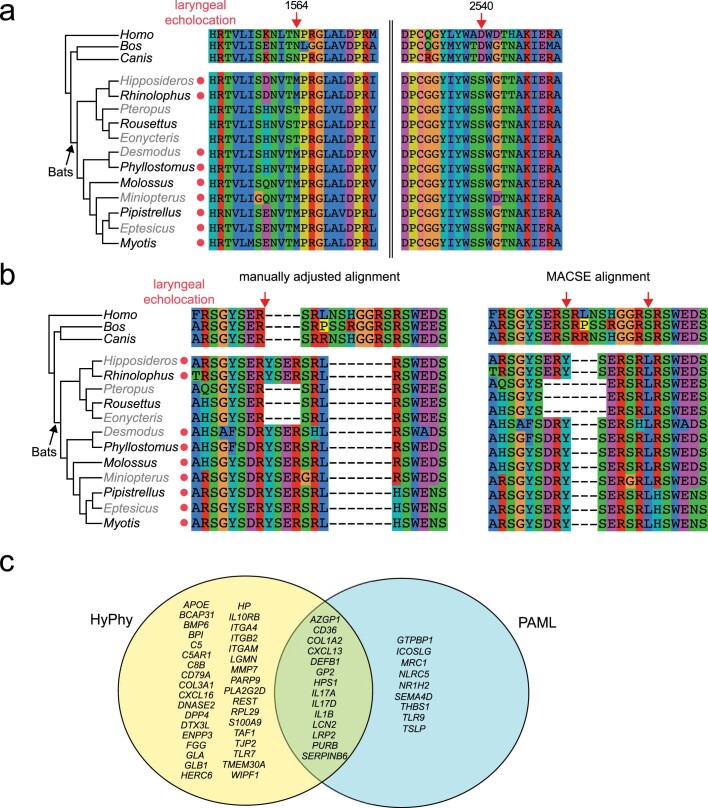
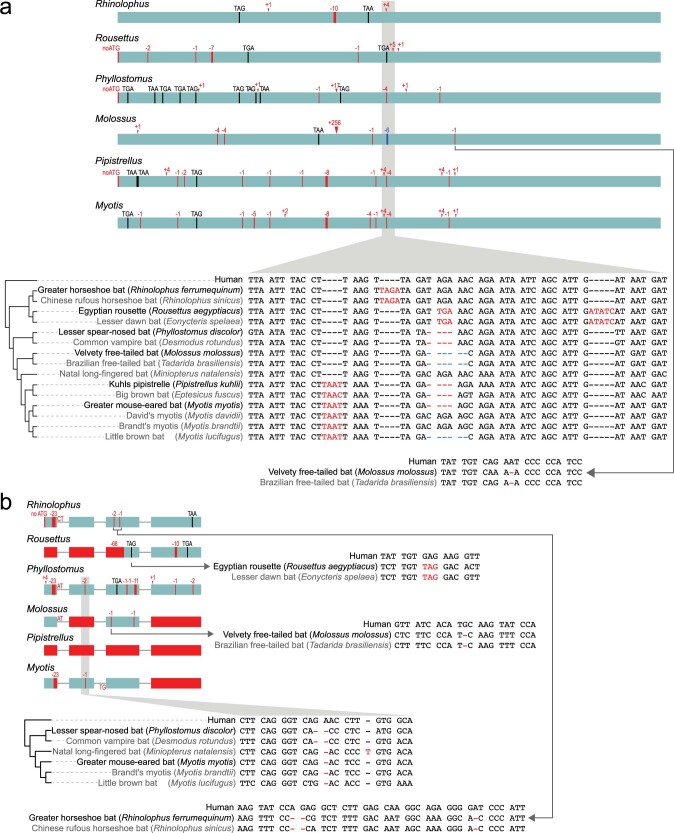
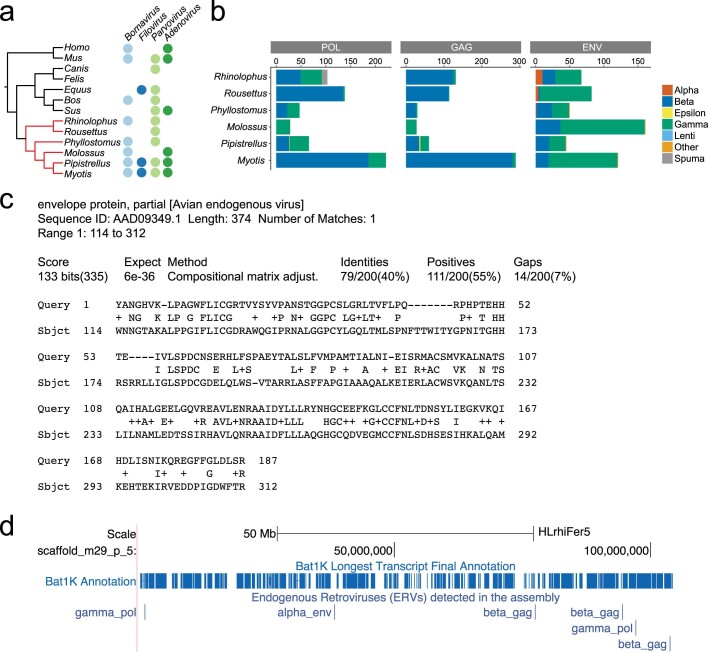
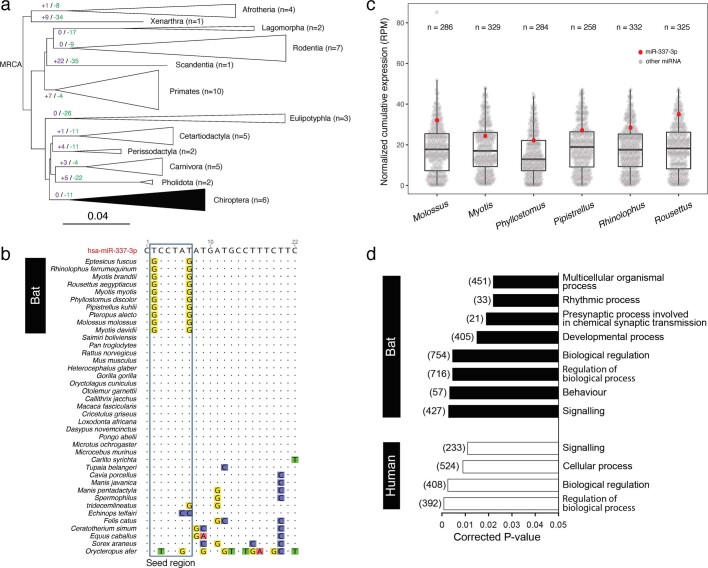
Bats possess extraordinary adaptations, including flight, echolocation, extreme longevity and unique immunity. High-quality genomes are crucial for understanding the molecular basis and evolution of these traits. Here we incorporated long-read sequencing and state-of-the-art scaffolding protocols1 to generate, to our knowledge, the first reference-quality genomes of six bat species (Rhinolophus ferrumequinum, Rousettus aegyptiacus, Phyllostomus discolor, Myotis myotis, Pipistrellus kuhlii and Molossus molossus). We integrated gene projections from our 'Tool to infer Orthologs from Genome Alignments' (TOGA) software with de novo and homology gene predictions as well as short- and long-read transcriptomics to generate highly complete gene annotations. To resolve the phylogenetic position of bats within Laurasiatheria, we applied several phylogenetic methods to comprehensive sets of orthologous protein-coding and noncoding regions of the genome, and identified a basal origin for bats within Scrotifera. Our genome-wide screens revealed positive selection on hearing-related genes in the ancestral branch of bats, which is indicative of laryngeal echolocation being an ancestral trait in this clade. We found selection and loss of immunity-related genes (including pro-inflammatory NF-κB regulators) and expansions of anti-viral APOBEC3 genes, which highlights molecular mechanisms that may contribute to the exceptional immunity of bats. Genomic integrations of diverse viruses provide a genomic record of historical tolerance to viral infection in bats. Finally, we found and experimentally validated bat-specific variation in microRNAs, which may regulate bat-specific gene-expression programs. Our reference-quality bat genomes provide the resources required to uncover and validate the genomic basis of adaptations of bats, and stimulate new avenues of research that are directly relevant to human health and disease1.


Conflict of interest statement

The authors declare no competing interests.

Figures

Fig. 1
Fig. 1. Assembly and annotation of the genomes of six bat species.
a, Genome assembly strategy and data produced. b, Comparison of assembly contiguity. N(x) % graphs show contig (left) and scaffold (right) sizes (y-axis), in which x per cent of the assembly consists of contigs and scaffolds of at least that size. Coloured lines refer to species with Bat1K assemblies. Extended Data Figure 1 labels all previous bat assemblies (shown as grey lines here). c, Overview of our strategy to annotate coding genes combining various types of evidence. cgp, comparative gene prediction. d, Comparison of the completeness of gene annotations, as a percentage of 4,101 mammalian genes from BUSCO. e, Total number of annotated genes.
Fig. 2
Fig. 2. Phylogenetic analysis of Laurasiatheria.
We inferred a mammalian phylogram using a supermatrix of 12,931 concatenated genes and the maximum likelihood method of tree reconstruction (topology 1 in Supplementary Fig. 4). All nodes received 100% bootstrap support. The divergence of Chiroptera and Fereuungulata is highlighted with a red dot. The mammalian superordinal groups are denoted as follows: green, Laurasiatheria; blue, Euarchontoglires; orange, Xenarthra; yellow, Afrotheria.
Fig. 3
Fig. 3. Genome-wide screens highlight changes in genes that are potentially involved in exceptional immunity in bats.
a, Inactivation of the immune-stimulating genes LRRC70 and IL36G. Boxes represent coding exons proportional to their size, overlaid with gene-inactivating mutations present in six bat species. Scale bar, 100 bp. b, Diagram showing the canonical NF-κB signalling pathway (purple) and interacting proteins that have experienced positive selection or have been lost in bats. c, Expansion of the APOBEC3 gene locus. Each arrow represents a cytidine deaminase domain, coloured by domain subtypes as defined by the given motifs (right), with likely pseudogenes shown in white. Genes containing multiple deaminase domains are indicated with a single bar over more than one domain. A transposition event in Myotis created two APOBEC3 loci on different chromosomes. Cow and dog are two Laurasiatheria outgroups; cow also represents the likely mammalian ancestral state. Within the given motifs, X denotes any amino acid.
Fig. 4
Fig. 4. Evolution of noncoding RNAs in bats.
a, Landscape of noncoding RNA genes. Number of noncoding RNA genes annotated in six bat and seven reference mammalian genomes. lncRNA, long noncoding RNA; miscRNA, miscellaneous RNA; rRNA, ribosomal RNA; snoRNA, small nucleolar RNA; snRNA, small nuclear RNA. b, Multispecies alignment of mature miR-337-3p. Dots represent bases identical to human; dashes represent species in which a functional miR-337-3p could not be identified. Extended Data Figure 9b gives alignment of mature miR-337-3p sequences across 40 mammals. c, Specificity differences of human and bat miR-337-3p activity is shown using species-specific sensors in luciferase reporter assays (n = 9 biologically independent samples in 3 independent experiments). Significance calculated using two-way analysis of variance test, followed by post hoc Tukey calculation. ****P < 0.0001, ***P = 0.0008; for bat-miR-337, not significant (NS) P = 0.9269; for human-miR-337, NS P = 0.1485. d, Validation of novel miRNA activity in ancestral bats. Predicted secondary structures are shown for each miRNA. Luciferase assays compare a negative control (unrelated miRNA not predicted to bind the sensor) and the cognate miRNA (n = 9 biologically independent samples in 3 independent experiments). Significance for each control–miRNA pair calculated using pairwise t-tests, type 2. *P = 0.0157; ****P < 0.0001; NS, P = 0.5475. Box plots extend from 25th to 75th percentiles, central line represents the median value, and whiskers extend to the smallest and largest values.
Extended Data Fig. 1
Extended Data Fig. 1. Genome assembly of six bats.
a, Distribution of PacBio read lengths. The dashed line at 4 kb marks the minimum read length that was used in the assemblies. b, Detailed Bat1K assembly pipeline, listing the steps and methods used to assemble the genomes. c, Hi-C maps for M. myotis prior to (left) and post manual curation (right). Hi-C maps were created by mapping and filtering the Hi-C read pairs by using the tools bwa, pairsamtools, pairix and cooler following the Hi-C data processing pipeline on https://github.com/hms-dbmi/hic-data-analysis-bootcamp. Left, ellipse 1 shows that scaffold 2 contains a false join. It was split in the manual curation step. Ellipse 2 highlights two scaffolds, which were not joined in automated scaffolding steps but were manually integrated into scaffold 3. d, Detailed comparison of assembly contiguity of bat genomes. N(x)% graphs show the contig (left) and scaffold (right) sizes (y-axis), in which x% of the assembly consists of contigs and scaffolds of at least that size. Solid lines show assemblies generated by Bat1K (this study), dashed lines show previous assemblies of bat genomes (Myotis brandtii, Myotis davidii, Pteropus alecto, Desmodus rotundus, Eonycteris spelaea, Hipposideros armiger, Rhinolophus sinicus, Miniopterus natalensis, Rousettus aegyptiacus, Pteronotus parnellii, Eidolon helvum, Rhinolophus ferrumequinum and Megaderma lyra). Eonycteris spelaea was assembled using only PacBio long reads; the previous Rousettus aegyptiacus assembly is based on both long and short reads. All other previous assemblies were assembled using only short reads. Assembly gaps were defined as runs of ≥ 10 Ns.
Extended Data Fig. 2
Extended Data Fig. 2. Chromosome lengths and comparison of assembly completeness in nonexonic genomic regions.
a, Comparison of scaffold lengths and chromosome lengths that were estimated from published karyotype images of M. molossus, M. myotis and R. aegyptiacus. b, To assess completeness in nonexonic genomic regions, we determined how many of 197 nonexonic ultraconserved elements (UCEs) align at ≥ 85% identity to the human sequence. UCEs are highly conserved among mammals and are expected to be present in complete assemblies. Bar charts show the number of detected UCEs that align at these stringent parameters. As expected, the vast majority of UCEs were detected in all assemblies. UCEs not detected are separated into those that are missing owing to assembly incompleteness and those that exhibit real sequence divergence. In the bat genomes we report, no UCEs were missing owing to assembly incompleteness. Instead, one to three UCEs were not detected in our Myotis and Pipistrellus assemblies because the UCE sequences are more than 85% diverged (Supplementary Fig. 1). Human and mouse are not shown here because both genomes were used to define ultraconserved elements. For cow and cat, we also compared new assemblies (bosTau9 and felCat9) that recently became available. c, Example of a UCE that is not fully present in the assemblies of cow (bosTau8), cat (felCat8) and dog (canFam3) because of assembly gaps. UCSC genome browser screenshot shows a multiple genome alignment of mammals of the locus around UCE.157 (highlighted) and pairwise chains of co-linear alignments (blocks represent local alignments, double lines represent unaligning sequence and single lines represent deletions). The top-level pairwise alignment chains between human (reference species) and cow, cat and dog show that UCE.157 only partially aligns (cow bosTau8 and dog canFam3) or does not align at all (cat felCat8). The unaligning region overlaps an assembly gap in all three cases, indicating that the UCE sequence is not present because of assembly incompleteness. Indeed, the UCE is entirely present in more-recent assemblies of cow (bosTau9) and cat (felCat9). Furthermore, the alignment chains of the dingo—a close relative of the dog—show that the dingo assembly also contains the entire UCE.157. d, Example of a UCE that shows real sequence divergence in Pipistrellus bats. Dots in the alignment represent nucleotides that are identical to the human sequence shown at the top. Compared to other bats, Pipistrellus kuhlii shows an increased number of mutations in this UCE sequence; however, M. myotis also shows an increased number of mutations. Because most mutations are shared between P. kuhlii and Pipistrellus pipistrellus, base errors in the assembly are highly unlikely to account for the increased sequence divergence.
Extended Data Fig. 3
Extended Data Fig. 3. Comparison of assembly completeness in coding genomic regions and transposon content.
a, BUSCO applied to genomic sequences markedly underestimates gene completeness of assemblies. Bar charts show the percent of 4,104 highly conserved mammalian BUSCO genes that are completely present, fragmented or missing in the assembly. Left, applying BUSCO to genome assemblies. Right, applying BUSCO to the gene annotations (protein sequences of annotated genes; this panel is reproduced from Fig. 1d to enable a direct comparison). The direct comparison shows that BUSCO applied to the whole genome detects markedly fewer genes than BUSCO applied to the gene annotation. Because every annotated gene is by definition present in the assembly, this shows that BUSCO applied to the whole genome underestimates gene completeness—probably because it is substantially more difficult to detect complete genes in assemblies. b, Comparison of genomic transposon composition between six bats and other representative boreoeutherian mammals (Laurasiatheria + Euarchontoglires), selected for the highest genome contiguity. We used a previously described workflow and manual curation to annotate TEs. Bar charts compare genome sizes and the proportion that consist of major transposon classes. TE content generally relates with genome size. Our assemblies also revealed noticeable genome size differences within bats, with assembly sizes ranging from 1.78 Gb for Pipistrellus to 2.32 Gb for Molossus. c, Fraction of the genome that consists of recent transposon insertions. We compared TE copies to their consensus sequence to obtain a relative age from each TE family. This revealed an extremely variable repertoire of TE families with evidence of recent accumulation (defined as TE insertions that diverged less than 6.6% from their consensus sequence). For example, while only about 0.38% of the 1.89-Gb Rousettus genome exhibits recent TE accumulations, about 4.2% of the similarly sized 1.78-Gb Pipistrellus genome is derived from recent TE insertions. The types of TE that underwent recent expansions also differ substantially in bats compared to other mammals, particularly with regards to the evidence of recent accumulation by rolling-circle and DNA transposons in the vespertilionid bats. These two TE classes have been largely dormant in most mammals for the past approximately 40 million years and recent insertions are essentially absent from other boreoeutherian genomes. These results add to previous findings revealing a substantial diversity in TE content within bats, with some species exhibiting recent and ongoing accumulation from TE classes that are extinct in most other mammals while other species show negligible evidence of TE activity.
Extended Data Fig. 4
Extended Data Fig. 4. Exploring the effect of gene alignment quality using Robinson–Foulds distances.
a, We set a minimum taxa number to 20, excluding all genes that did not meet this criterion. Additionally, we calculated the Robinson–Foulds (RF) distance for each individual gene tree relative to topology 1 (Supplementary Fig. 4), and excluded the 100 most distant gene alignments from the supermatrix. This was done to explore the effects of low taxa number and homology error (Supplementary Note 4.2.2) on species tree topology. The resulting topology showed no difference in branching pattern compared to the full supermatrix analyses (Fig. 2). b, We also excluded the 500 most divergent genes, to determine the effect that putative homology errors might have on the overall topology, and observed no difference.
Extended Data Fig. 5
Extended Data Fig. 5. Phylogenetic analyses of Laurasiatheria.
a, A total of 10,857 conserved noncoding elements (CNEs) were used to determine a mammalian phylogeny using noncoding regions (topology 2 in Supplementary Fig. 4). Bootstrap support values less than 100 are displayed, with internal nodes that differ to the protein-coding supermatrix highlighted in red. The position of Chiroptera as basal to Fereuungulata, as in Fig. 2, is maintained. b, All gene alignments were fit to the 15 laurasiatherian topologies (Supplementary Fig. 4) we explored, to determine which tree had the highest likelihood score for each gene. The number of genes supporting each topology is displayed. c, A supermatrix consisting of 1st and 2nd codon sites from 448 genes that are evolving under homogenous conditions—thus considered optimal ‘fit’ for phylogenetic analysis—was used to infer a phylogeny using maximum likelihood (topology 13 in Supplementary Fig. 4). Bootstrap support values less than 100 are displayed, with internal nodes that differ to the protein-coding supermatrix phylogeny highlighted in red. Unlike Fig. 2, Chiroptera is now sister to (Carnivora + Pholidota); however, this split has low bootstrap support (58%). d, Using the 488 genes considered fit for phylogenetic analyses, the position of bats within Laurasiatheria under a model of coalescence using SVDquartets. The resulting phylogeny is displayed. The tree is rooted on Atlantogenata, with support values from bootstrap pseudoreplicates. Only nodes with support less than 100 have their values displayed. The position of Chiroptera as basal to Fereuungulata, as in Fig. 2, is maintained.
Extended Data Fig. 6
Extended Data Fig. 6. Screens for positive selection in genes in bats.
a, Sites under positive selection in bats in the LRP2 gene. Multiple sequence alignments of local regions surrounding two bat-specific mutations, which were found to be under positive selection (BEB > 0.95) using codeml (PAML). Site 1564 shows bat-specific changes at a conserved residue. The paraphyletic echolocating bats (indicated by a red dot) all share a methionine at this site, whereas pteropodid bats—which do not use laryngeal echolocation—have a threonine at this site. Site 2540 shows a bat-specific change, shared by all bats. The presence and patterns of mutations found in our six bats were confirmed in six previously published bat genomes, to increase taxonomic representation. Human (Homo), cow (Bos) and dog (Canis) are also shown. b, Echolocator-specific changes in the TJP2 gene. We initially identified positive selection in the bat ancestor in the hearing-related gene TJP2 (tight junction protein 2), which is expressed in cochlear hair cells and associated with hearing loss. The right side shows the multiple sequence alignment produced by MACSE of local regions surrounding bat-specific mutations (red arrows), which were found to be under positive selection (BEB > 0.95) using codeml (PAML). The paraphyletic echolocating bats are indicated by a red dot. However, as shown on the left, manual inspection revealed a putative alignment ambiguity and manual adjustment produced an alignment with two bat-specific indels. This manually corrected alignment had a reduced significance for positive selection (aBSREL raw P = 0.009, not significant after multiple test correction considering 12,931 genes). The corrected alignment revealed a four-amino-acid microduplication found only in echolocating bats (n = 9) and not in pteropodid bats that lack laryngeal echolocation. This may be explained by incomplete lineage sorting or convergence. Insertions and deletions may also affect protein function, but are not considered by tests for positive selection; however, a phylogenetic interpretation of these events may uncover functional adaptations. c, Ageing and immune candidate genes showing evidence of significant positive selection using aBSREL (HyPhy, yellow) and codeml (PAML, blue). Genes identified by both methods are displayed at the intersection.
Extended Data Fig. 7
Extended Data Fig. 7. Inactivating mutations in LRRC70 and IL36G genes in bats.
a, b, LRRC70 (a) is expressed in a broad range of tissues and potentiates cellular responses to multiple cytokines and is well-conserved among Laurasiatheria. Importantly, LRRC70 strongly amplifies bacterial-lipopolysaccharide-mediated NF-κB activation. Our finding of LRRC70 loss in bats makes this poorly characterized gene an interesting target for future mechanistic studies. IL36G (b) encodes a proinflammatory interleukin belonging to the interleukin-1 family. Increased expression of IL36G was detected in patients with psoriasis or inflammatory bowel disease, and IL36G is probably involved in the pathophysiology of these diseases by inducing the canonical NF-κB pathway and other proinflammatory cytokines. Coding exons are represented as boxes (LRRC70 has only a single coding exon), superimposed with all detected inactivating mutations. Vertical red lines show frameshifting deletions; arrowheads indicate frameshifting insertions. Red boxes indicate complete or partial exon deletions. The size of deletions or insertions is given on top of the mutation. Premature stop codons are indicated by black vertical lines and the corresponding triplet. Mutated ATG start codons are indicated as ‘noATG’. Splice site mutations are shown by red letters at the end of an exon (donor mutation) or the beginning of an exon (acceptor mutation). One representative mutation for each bat is shown in detail in the alignment between human and bats (red font indicates the inactivating mutation). Genome assemblies produced in this study are in black; publicly available assemblies of sister species are in grey font. For both genes, the presence of the exact same mutation in independently sequenced and assembled genomes of sister species excludes the possibility that the representative mutations are erroneous. This analysis also reveals that both genes were in fact lost multiple times within Chiroptera, suggesting these genes came under relaxed selection in bats followed by with subsequent gene losses. In a, the position of the −4-bp frameshifting deletion in LRRC70 in Pipistrellus and Myotis is ambiguous and can be shifted by up to 3 bp to the right without affecting alignment identity.
Extended Data Fig. 8
Extended Data Fig. 8. Viral sequences integrated in bat genomes.
a, Viral families identified in more than one genus mapped to phylogenetic tree of six bat species and seven additional mammals. Using reciprocal BLAST searches and a custom comprehensive library of viral protein sequences, we screened our six bat genomes and seven mammalian outgroups for the presence of non-retroviral EVEs. Endogenous sequences identified as Adenoviridae, Parvoviridae, Filoviridae and Bornaviridae were represented across several mammalian genera. b, Bar plots show numbers of viral proteins of all seven Retroviridae genera detected in the genomes of our six bats. Beta-like integrations are most common for pol and gag proteins and gamma-like integrations are most common for env proteins. Overall, the highest number of integrations was observed in Myotis (n = 630), followed by Rousettus (n = 334) with Phyllostomus containing the lowest. c, Alignment exemplifies that an ERV found in Rhinolophus (scaffold_m29_p_13:24821733-24822323) best matches the env protein of an avian endogenous virus, which belongs to the alpharetrovirus group. d, UCSC genome browser screenshot (https://genome-public.pks.mpg.de/) of a 104 Mb scaffold (scaffold_m29_p_5) of the Rhinolophus assembly shows detected ERVs as an annotation track.
Extended Data Fig. 9
Extended Data Fig. 9. Evolution of miRNAs in bats.
a, miRNA family expansion and contraction analyses in 48 mammalian genomes. The number of miRNA families expanded and contracted are annotated at the top of branches (at the order level) in purple and green, respectively. n indicates the number of species in each order used in the analysis and the size of the triangle is proportionate to this number. The order Chiroptera is filled with black. MRCA, most recent common ancestor. In total, 11 miRNA families were contracted in the ancestral bat branch, with no evidence of expansion. Between 3 and 21 miRNA families were contracted in the different bat species and between 2 and 7 were gained (Supplementary Fig. 9). This pattern of miRNA expansion and contraction in bats is not unusual compared to that observed in other lineages. b, Alignment of mature miR-337-3p sequences across mammals, with human as reference sequence. The genomes of all 48 mammalian species (Supplementary Table 1) were screened for the presence of miR-337 on the basis of its sequence similarity and secondary structure using the Infernal pipeline. To confirm that the seed region of miR-337-3p is conserved widely in bats, we also included four previously reported Illumina bat genomes (Myotis brandtii, Myotis davidii, Eptesicus fuscus and Pteropus alecto) alongside the six Bat1K genomes we sequenced. miR-337 was not detected in cow, pig and dog genomes by our pipelines, which are therefore not represented in this figure. Two changes are present in the seed region of miR-337-3p, the combination of which is uniquely found in bats, and not in other mammals. c, Cumulative expression of miR-337-3p in the six Bat1K species based on small RNA-seq data. Cumulative abundance of conserved miRNA from brain, liver and kidney for each bat species is reported as RPM (reads per million mapped reads) and reported as individual data points to show the dispersion of the data. Box plots extend from the 25th to 75th percentiles, the central line represents the median value and whiskers extend to a maximum of 1.5× the inter quartile range beyond the box. n indicates the number of conserved miRNA detected in each species. The abundance of miR-337-3p is highlighted in red. miR-337-3p is consistently and highly expressed across these six bat species, highlighting its potential importance in bats and suggesting that alteration to this miRNA may have an effect in bat biology. d, Sequence changes in the miR-337-3p seed region are predicted to alter the repertoire of its gene targets in bats. Following predictions of miRNA binding sites in the 3′ UTRs of humans and bats, respectively, we used Gene Ontology (GO) enrichment (via DAVID) to understand the biological processes regulated by the human and bat miR-337-3p. miR-337-3p was predicted to regulate distinct biological processes in bat and human as a result of the two sequence changes found in the seed region. In bats, novel GO categories were enriched including developmental, rhythmic and neuronal processes. Target lists used for analyses were n = 1,159 for bat and n = 601 for human, and background lists were n = 13,083 for both. Corrected P values were generated by DAVID via a modified Fisher’s exact test (EASE score) and Benjamini multiple testing correction.

Comment in

References

    1. Teeling EC, et al. Bat biology, genomes, and the Bat1K project: to generate chromosome-level genomes for all living bat species. Annu. Rev. Anim. Biosci. 2018;6:23–46. doi: 10.1146/annurev-animal-022516-022811. - DOI - PubMed
    1. Simmons, N. B. & Cirranello, A. L. Bat Species of the World: A Taxonomic and Geographic Database, https://batnames.org/ (2020).
    1. Banerjee A, et al. Novel insights into immune systems of bats. Front. Immunol. 2020;11:26. doi: 10.3389/fimmu.2020.00026. - DOI - PMC - PubMed
    1. Huang Z, et al. Longitudinal comparative transcriptomics reveals unique mechanisms underlying extended healthspan in bats. Nat. Ecol. Evol. 2019;3:1110–1120. doi: 10.1038/s41559-019-0913-3. - DOI - PubMed
    1. Vernes SC, Wilkinson GS. Behaviour, biology and evolution of vocal learning in bats. Phil. Trans. R. Soc. Lond. B. 2020;375:20190061. doi: 10.1098/rstb.2019.0061. - DOI - PMC - PubMed

Publication types

Substances