. 2020 Jul;583(7818):819-824.
doi: 10.1038/s41586-020-2504-5. Epub 2020 Jul 22.

Distinct subnetworks of the thalamic reticular nucleus

Affiliations

Distinct subnetworks of the thalamic reticular nucleus

Yinqing Li et al. Nature. 2020 Jul.

Abstract

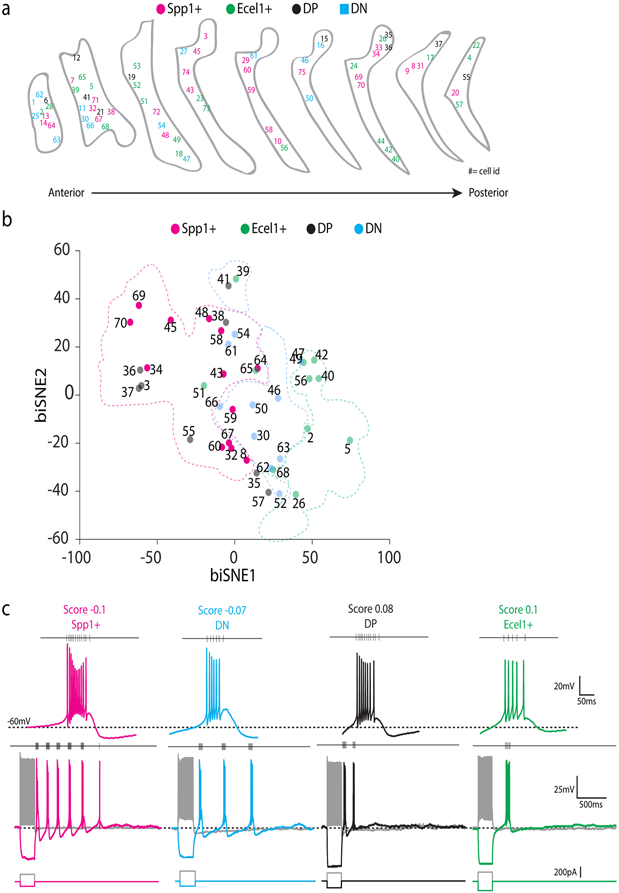
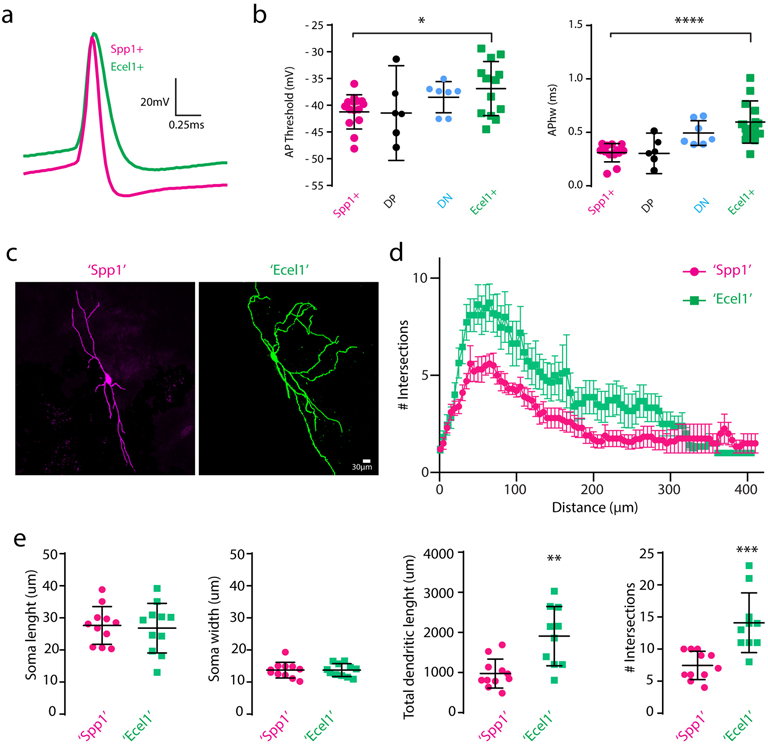
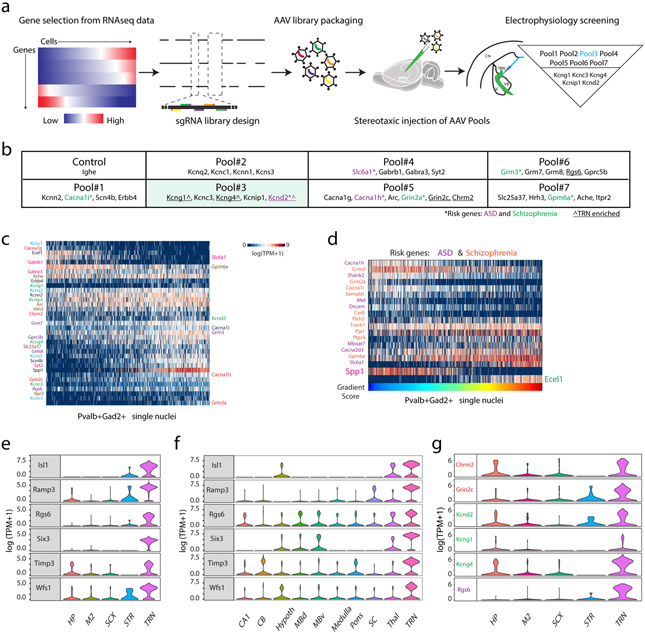
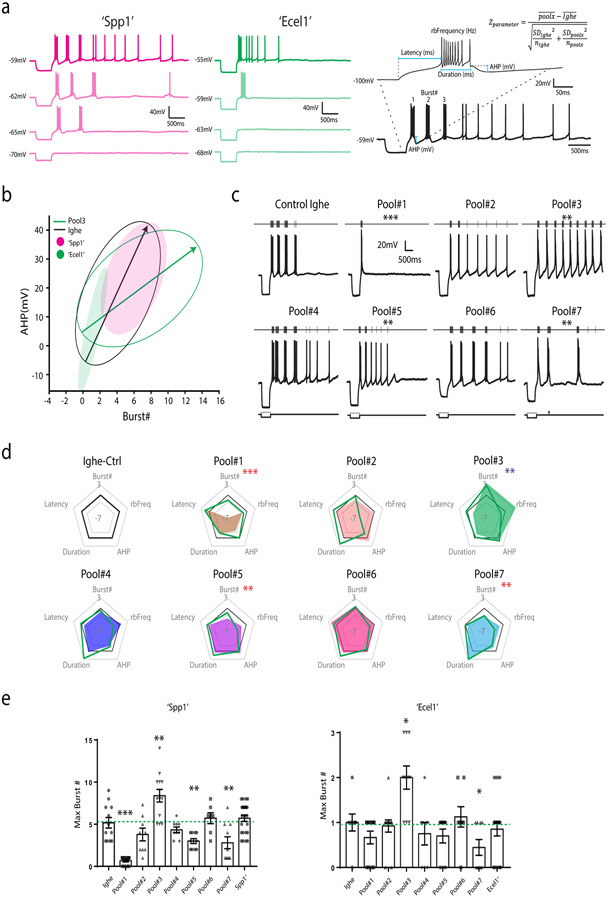
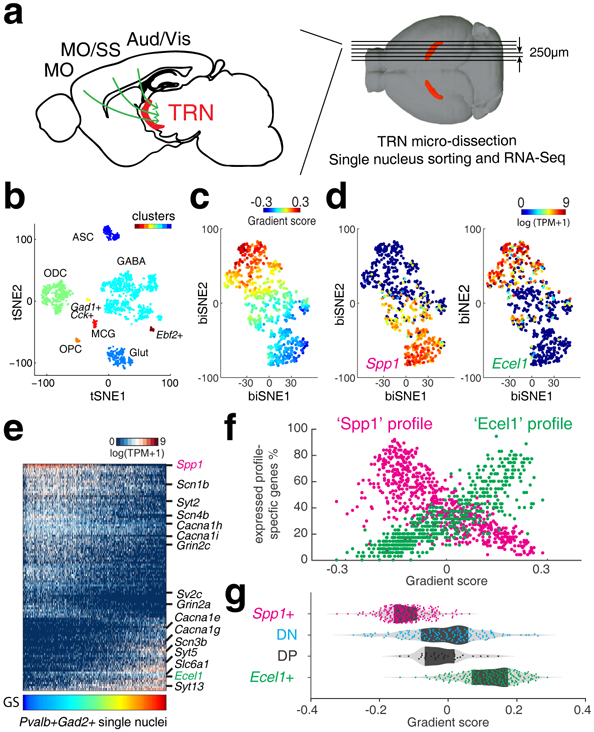
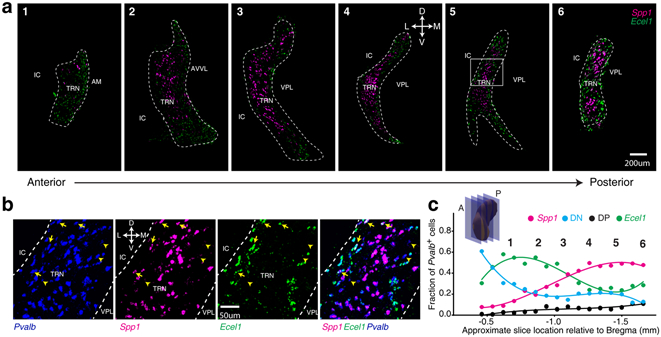
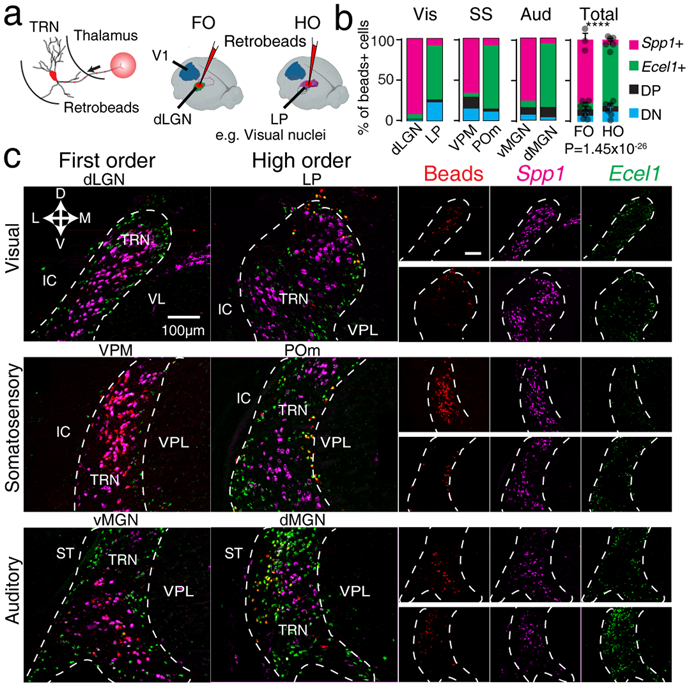
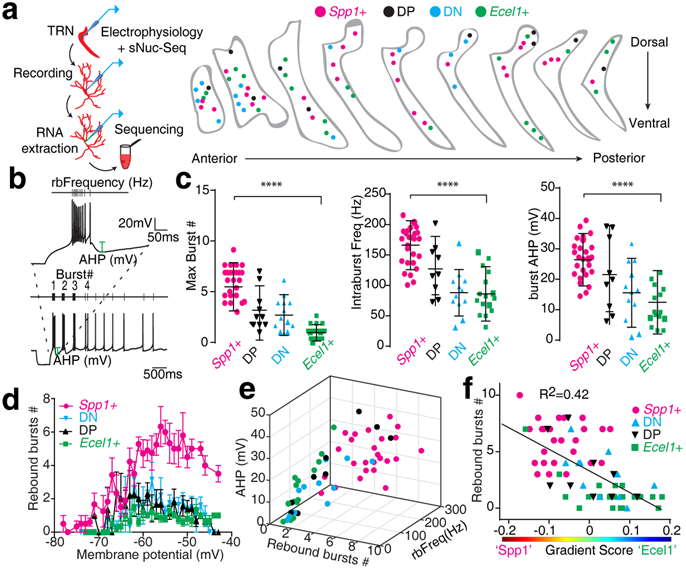
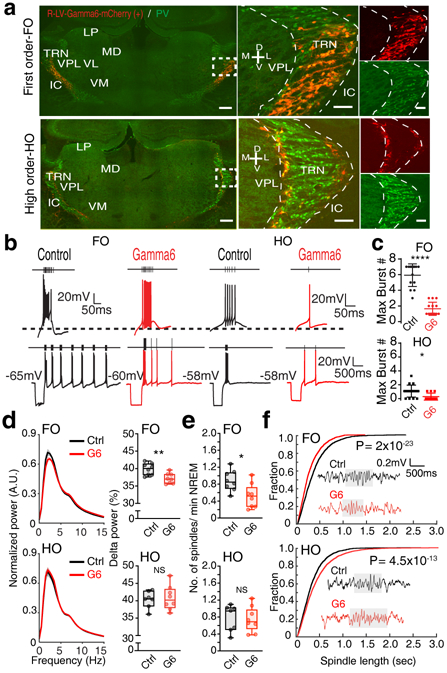
The thalamic reticular nucleus (TRN), the major source of thalamic inhibition, regulates thalamocortical interactions that are critical for sensory processing, attention and cognition1-5. TRN dysfunction has been linked to sensory abnormality, attention deficit and sleep disturbance across multiple neurodevelopmental disorders6-9. However, little is known about the organizational principles that underlie its divergent functions. Here we performed an integrative study linking single-cell molecular and electrophysiological features of the mouse TRN to connectivity and systems-level function. We found that cellular heterogeneity in the TRN is characterized by a transcriptomic gradient of two negatively correlated gene-expression profiles, each containing hundreds of genes. Neurons in the extremes of this transcriptomic gradient express mutually exclusive markers, exhibit core or shell-like anatomical structure and have distinct electrophysiological properties. The two TRN subpopulations make differential connections with the functionally distinct first-order and higher-order thalamic nuclei to form molecularly defined TRN-thalamus subnetworks. Selective perturbation of the two subnetworks in vivo revealed their differential role in regulating sleep. In sum, our study provides a comprehensive atlas of TRN neurons at single-cell resolution and links molecularly defined subnetworks to the functional organization of thalamocortical circuits.


Figures

Extended Data Figure 1.
Extended Data Figure 1.. Expression patterns of Gad2 and Pvalb across TRN.
(a) Schematic of positions of coronal sections shown along the anterior to posterior axis (indicated by numbers). RNA-FISH co-staining of Gad2 and Pvalb in anterior (b), medial (c), and posterior (d) coronal sections. For each position: Left: overview of the RNA-FISH co-staining in TRN; Right: Zoom-in view of the boxed area in the left panel. For (b), (c), and (d), repeated with n = 2. (e) Representative FACS plot showing gating strategy used in sorting single nuclei for RNA sequencing. Repeated with n = 53 plate-based sorting.
Extended Data Figure 2.
Extended Data Figure 2.. Identification of Gad2+ cell types.
(a) t-SNE embedding of 1687 single nuclei as in Fig. 1a. Single nuclei are colored by dissection sources as indicated by the color bar on the right. Different batches of dissections from the external part of globus pallidus (GPE) are colored differently. n = 1,687 nuclei. (b) t-SNE embedding of nuclei showing expression levels (pseudo-color) of marker genes for each cluster. The three small clusters exhibiting dramatically less Pvalb expression, but enriched with a combination of markers including Gabra1, Fxyd6, Tac1. n = 868 nuclei. (c) ISH image in sagittal view of selected markers shown in b. Images obtained from Allen Brain Atlas (https://portal.brain-map.org/). Dashed lines indicate boundaries of TRN and the neighboring GABAergic nuclei. GP: globus pallidus; ZI: zona incerta; BNST: bed nucleus of the stria terminalis.
Extended Data Figure 3.
Extended Data Figure 3.. Binarized expression pattern of Spp1 and Ecel1 represents transcriptomic gradient.
(a) Expression levels of Spp1 and Ecel1 (upper) and log(Spp1/Ecel1) (lower) in individual cells along the transcriptomic gradient, showing binary pattern of Spp1 and Ecel1 correlated with the gradient score. (b) Number of genes detected for the major cell types and TRN subpopulations, showing that the DP and DN are of quality comparable to other cell populations. nASC=124, nGlut=226, nGABA=868, nODC=388, nGad1+Cck+=9, nOPC=23, nMCG=28, nEbf2+=21 nuclei. Between Spp1+ and DP, p=0.1787; DN and Ecel1+, p=0.2897, two-sided ranksum test. n.s.: not significant. No adjustment for multiple testing was applicable. Box plots shows 25th, 50th, 75th percentiles, and the whiskers extend to the most extreme data points, ‘+’ are taken as outliers (Matlab R2017a). (c) Schematics of naïve Bayes classifiers to assign Spp1+, Ecel1+, DP and DN neurons into segments of the transcriptomic gradient. (d) Classification accuracy of the naïve Bayes classifiers. Shown are the probability of assigning Spp1+ to ‘Spp1’ segment, DP & DN neuron to the intermediate segment, and Ecel1+ to ‘Ecel1’ segment respectively. n=671 nuclei total, nSpp1+=264, nDP+DN=195, nEcel1+=212 neurons. (e) Schematics for normalization of medial-lateral position of individual neurons in FISH images. Blue line: TRN boundary; Red dots: Pvalb+Spp1+ neurons; Green dots: Pvalb+Ecel1+ neurons; Yellow dots: DP neurons; DN are not shown in the schematics. (f) Scatter plots showing log(Spp1/Ecel1) in individual Pvalb+ neurons at normalized medial-lateral position in selected tFISH images along anterior to posterior TRN, corresponding to Fig. 2c. m-l: medial-lateral position; Blue dots: individual cells; Solid red line: smooth fitting of blue data points, showing inverted-’U’ shape; Dashed blue line: mean of blue data points, indicating the difference in the FISH background of Spp1 and Ecel1 channel in different images.
Extended Data Figure 4.
Extended Data Figure 4.. Injection sites in distinct thalamic relay nuclei and corresponding cortical projections.
(a) The positions of retrogradely labeled neurons traced from different thalamic relay nuclei indicated by different colors are shown in the coronal view of TRN section series arranged from anterior to posterior. The light green and the magenta shaded areas indicate the distribution of typical Ecel1+ and Spp1+ neurons, respectively. VPM, ventral posterior medial; dLGN, lateral geniculate nucleus (dorsal part); POm, posterior-medial; LP, lateral posterior-lateral part; dMGN, medial geniculate-dorsal part; vMGN, medial geniculate-ventral part; VM, ventromedial; VL, ventrolateral. n = 3 mice per region. (b) Panoramic view of coronal sections showing the injection sites and cortical projection for each FO and HO thalamic nuclei. V1: primary visual cortex; V2L: secondary visual cortex lateral part; V2ML: secondary visual cortex medial-lateral part; S1BF: primary somatosensory cortex barrel field; S1DZ: primary somatosensory cortex dysgranular zones; S1FL: primary somatosensory cortex forelimb; S1HL: primary somatosensory cortex hindlimb; S2: secondary somatosensory cortex; AuV: secondary auditory cortex ventral area; Au1: primary auditory cortex; AuD: secondary auditory cortex dorsal area; MGD: medial geniculate nuclei dorsal part; MGM: medial geniculate nuclei medial part; TeA: temporal cortex, association area. n = 3 mice per region. (c) Quantification of the projection ratio between the primary and higher-order secondary/tertiary cortical areas for different thalamic injection sites. ndLGN=12 slices/2 mice, nLP=12 slices/2 mice, nMGV=15 slices/2 mice, nMGD/MGM=12 slices/2 mice, nVPM=12 slices/2 mice, nPOm=12 slices/2 mice. Bars represent mean ± SEM and raw data points.
Extended Data Figure 5.
Extended Data Figure 5.. Distribution of TRN neurons according to molecular gradient score.
(a) The anatomical distribution of Patch-seq recorded neurons in coronal sections of TRN along the anterior-posterior axis. The cells were labeled with different colored numbers as indicated (Spp1+, magenta, Ecel1+, green, DP, black and DN, blue). Numbers indicate cell id. Shown are n=76 cells/5 mice, data collected by 2 experimenters. (b) biSNE embedding of the collected TRN neurons for Patch-seq showing molecular gradient pattern with Spp1+ (magenta), Ecel1+ (green), and the intermediate sub-populations DP (blue) and DN (black). Shown are subset of neurons from a batch of n=68 neurons/5 mice. (c) Representative voltage changes in response to hyperpolarizing current step injections. Spp1+ neurons (magenta) show robust rebound burst firings elicited by hyperpolarization with high firing frequencies within a burst. When a similar protocol is applied, most of the Ecel1+ neurons (green) show only one rebound burst with lower firing frequencies within a burst than Spp1+ neurons. DN (blue) and DP (black) neurons present intermediate properties. nEcel1+ = 15, nSpp1+ = 29, nDN = 9, nDP = 10 neurons.
Extended Data Figure 6.
Extended Data Figure 6.. TRN neurons exhibit difference in action potential properties and morphology.
(a) Zoom-in view of a representative single action potential traces of Spp1+ and Ecel1+ neurons. (b) Summary of action potential (AP) threshold (p=0.015, two-sided unpaired t-test) and half-width of AP (APhw) (p= 7.08×10⁵, two-sided unpaired t-test). For (a) and (b), nSpp1=12, nEcel1=13, nDP=6, nDN=7 neurons from 5 mice. Plots represent mean ± SD and raw data points. (c) Example of Spp1+ like (‘Spp1’) (magenta) and Ecel1+ like (‘Ecel1’) (green) neuron morphology. (d) Sholl analysis of the dendritic complexity. (e) Summary of the soma length and width, total dendritic length and maximum number of intersections in Spp1+ like (‘Spp1’) and Ecel1+ like (‘Ecel1’) neurons (Mean ± SD. Dendritic length, p=0.0014. Number of intersections, p=0.0004, two-sided unpaired t-test). For (c), (d), and (e), n’Spp1’=11 neurons/4 mice, n’Ecel1’=10 neurons/4 mice.
Extended Data Figure 7.
Extended Data Figure 7.. AAV-mediated pooled in vivo CRISPR screening.
(a) Schematics of the AAV-mediated pooled CRISPR/Cas9 in vivo screen. (b) List of pools and genes selected for knockout in the CRISPR/ Cas9 screening. TRN enriched refers to genes differentially expressed between Pvalb+ neurons from TRN and from M2 cortex, somatosensory cortex, striatum, and hippocampus. (c) A heat map showing the expression pattern of the selected genes in the TRN neurons. The selected disease-risk genes are labeled on the right side. (d) A heat map showing the differentially expressed disease-risk genes in Spp1+ versus Ecel1+ neurons: autism spectrum disorder (ASD, purple) and Schizophrenia (orange). (e) Violin plots showing a list of genes differentially expressed between Pvalb+ neurons in TRN compared and Pvalb+ neurons in the four other brain regions including hippocampus (HP), secondary motor cortex (M2), somatosensory cortex (SCX), and striatum (STR). (f) Violin plots confirming the TRN-enriched gene list as shown in panel (e) in additional brain regions using the mousebrain.org datasets. CB: cerebellum; Hypoth: hypothalamus; MBd: medial basal nucleus dorsal part; MBV: medial basal nucleus ventral part; SC: spinal cord; Thal: thalamus. (g) Violin plots showing selected differentially expressed disease-risk genes compared to the Pvalb+ neurons in the other four brain regions as indicated. HP: hippocampus; M2: secondary motor cortex; SCX: somatosensory cortex; STR: striatum. For (e) and (g), nHP=90, nM2=97, nSCX=116, nSTR=13, nTRN=671 cells; For (f), nCA1=136, nCB=477, nHypoth=156, nMBb=331, nMBv=209, nMedulla=121, nPons=199, nSC=69, nThal=54, nTRN=501 cells. The violin plots width is based off of a Gaussian kernel density estimate of the data (estimated by the standard density function in R with default parameters), scaled to have maximum width equal to 1.
Extended Data Figure 8.
Extended Data Figure 8.. Pooled in vivo CRISPR/Cas9 screening reveals gene sets contributing to TRN bursting firing properties.
(a) Representative current-clamp recording traces of Spp1+ like (‘Spp1’, magenta) and Ecel1+ like (‘Ecel1’, green) neurons held at different membrane potentials. The trace with the maximum number of bursts was selected for measuring different burst properties and calculating the Z-score (shown in the right). (b) Plot showing confidence interval ellipses for classifying Spp1+ like (‘Spp1’) and Ecel1+ like (‘Ecel1’) neurons based on the AHP and the number of rebound bursts. (c) Representative rebound burst traces of recorded neurons after knocking out different sets of genes via CRISPR-Cas9 gene editing. Traces show rebound bursting activity changes in response to hyperpolarizing current step injections. TRN neurons exhibited distinct changes in their firing patterns after knockout of different gene groups. (d) Radar plots of 5 electrophysiological parameters illustrated in (a), showing the deviation of perturbed group to the control after knocking out sets of genes in the pooled approach. Positive changes show an increase towards a parameter, while negative changes show a decrease when compared to control. Green line indicates deviations in Ecel1+ like neurons and color shades indicates deviations in Spp1+ like neurons. (e) Summary of the maximum number of rebound bursts of TRN neurons elicited by comparable hyperpolarizing current step injection as described in Fig. 4b after different sets of genes were knocked out0 in the pooled approach in Spp1+ like (‘Spp1’) vs. Ecel1+ like (‘Ecel1’) neurons (‘Spp1’ Pool1, p = 4.8742×10⁷; Pool3, p=0.0033; Pool5, p=0.0088; Pool7, p=0.0065. ‘Ecel1’ Pool3, p=0.0081; Pool7, p=0.023, two-sided unpaired t-test). Bars represent the mean ± SEM. For (a)-(e): ‘Spp1’ Ighe n=12, Pool1 n=12, Pool2 n=9, Pool3 n=13, Pool4 n=9, Pool5 n=10, Pool6 n=9, and Pool7 n=10 cells; ‘Ecel1’ Ighe n=9, Pool1 n=12, Pool2 n=13, Pool3 n=10, Pool4 n=8, Pool5 n=10, Pool6 n=8, and Pool7 n=9 cells from 24 mice (3 mice per pool).
Extended Data Figure 9.
Extended Data Figure 9.. Characterization and validation of in vivo CRISPR/Cas9 screening reveals key genes contributing to TRN bursting firing properties.
(a) Representative rebound burst traces of recorded neurons after knocking out different individual genes from Pool3 via CRISPR/Cas9 gene editing. Knocking out of Kcnd2 recapitulates the effects of Pool#3. (b) Radar plots for Pool3 individual gene. Top: Changes in Spp1+ like (‘Spp1’) neurons, pink line showing the effect of the Pool3 gene knock out and color shades showing the effect produced by individual gene knock out. Bottom: Changes in Ecel1+ like (‘Ecel1’) neurons, green line showing the Pool3 gene radar plot and color shades showing the changes produced by individual gene knockout. Kcnd2 knockout closely recapitulates the effect of Pool3 in both populations. (c) Summary of the maximum number of rebound bursts of TRN neurons elicited by comparable protocols after individual genes from Pool3 were knockout in Spp1+ like (‘Spp1’) vs. Ecel1+ like (‘Ecel1’) neurons (‘Spp1’ Kcnd2, p=0.0095. ‘Ecel1’ Kcng1, p=0.0088; Kcnd2, p=0.019, two-sided unpaired t-test). Bars represent the mean ± SEM. For (a)-(c), ‘Spp1’ Kcng1 n=6, Kcnc3 n=6, Kcng4 n=5, Kcnip1 n=7, Kcnd2 n=7; ‘Ecel1’ Kcng1 n=10, Kcnc3 n=8, Kcng4 n=9, Kcnip1 n=11, Kcnd2 n=11. (d) Schematics of the analysis for on-target and off-target efficiency. Upper: analysis flowchart. WGA: whole genome amplification; NGS: next generation sequencing. Lower: schematics of sgRNA design and primers for on-target analysis for Kcnd2 knockout. Five sgRNA were designed in Exon2, Exon3, and Exon4. As the length spanned by the leftmost sgRNA and the rightmost sgRNA exceeds the NGS analysis limit, nested PCR combined with Sanger sequencing was used for on-target efficiency analysis. Primers for the nested PCR are shown as black arrows in Exon1 and Exon5. (e) Bar chart showing the on-target efficiency (5 sgRNA pooled) analyzed by nested PCR and Sanger sequencing (control: n=96 nuclei, viral injected: n=384 nuclei) and off-target rate for the top predicted (see methods) off-target loci of each sgRNA analyzed by NGS (n=1600 cells and 72000 nuclei). Predicted off-target sequences are shown with mismatched bases in lower case. Bar plots represent maximum likelihood estimation (MLE) and upper Wilson score intervals, no raw data point applicable69 (Supplementary Information).
Extended Data Figure 10.
Extended Data Figure 10.. Gamma6 expression and its perturbation effect in the TRN cells.
(a) Calcium currents measured in control (black traces) and with Gamma6 expression (red traces). (b) Summarized current density versus voltage relations showing that Gamma6 expressing TRN neurons exhibit smaller calcium current densities than controls (p=0.02, two-sided unpaired t-test, data presented as mean ± SEM). For (a) and (b), n=6 neurons/3 mice. (c) Quantification of retrogradely labeled cells (p=0.6170, n.s, not significant, two-sided unpaired t-test) and (d) their percentage of total PV+ neurons in the series of coronal slices from injected animals. L: left hemisphere; R: right hemisphere; g6: Gamma6; FO: first order; HO: higher order. For (c) and (d), n=7 for each experimental condition, data presented as mean ± SEM. For (c), plots are overlaid with raw data points. (e) Scatter plots showing Gamma6 expressing percentage and the effect size for individual animals. Upper row: Delta power percentage; Middle row: Number of spindles per minutes in NREM; Lower row: median length of sleep bout in NREM in seconds; Dots: animals with retrograde Gamma6 injection in FO (Red) and HO (Green) somatosensory thalamic nucleus. n=6 for each conditions. (f) Cumulative distribution of sleep spindle length for each individual animal with retrograde Gamma6 injection in FO (upper) and HO (lower) somatosensory thalamic nuclei, corresponding to Fig. 5h. Summary of median length of NREM sleep bouts with retrograde Gamma6 injection in FO (g) and HO (h) somatosensory thalamic nuclei. Right: two-sided Wilcoxon rank-sum test; Left: Kolmogorov-Smirnov test. For data in (f), (g), and (h), ncontrol (FO)=8, nGamma6 (FO)=8, ncontrol (HO)=7, nGamma6 (HO)=8. Box plots represent minima, 25th, 50th, 75th percentiles, maxima.
Figure 1.
Figure 1.. Single nuclei RNA-Sequencing reveals transcriptomic gradient of TRN neurons.
(a) Illustration of TRN gating on corticothalamo (CT) circuitry and experiments. Green arrows illustrate CT projection passing through TRN. MO: motor cortex; SS: somatosensory cortex; Aud: auditory cortex; Vis: visual cortex. Structure in red: TRN tissue (TdTomato). (b) t-SNE embedding shows nucleus clusters, indicated by colors. GABAergic cells (GABA), oligodendrocytes (ODC), Glutamatergic cells (Glut), oligodendrocyte precursor cells (OPC), microglia (MCG), astrocytes (ASC). n = 1,687 nuclei. (c) biSNE embedding of Gad2+ and Pvalb+ single nuclei, pseudo-colored by gradient score (GS), (d) by Spp1 (left) or Ecel1 (right) expression, showing two extremes marked by Spp1 or Ecel1, respectively. n = 671 nuclei. (e) Heat map showing Spp1- and Ecel1- associated transcriptional programs. Some genes relevant to electrophysiological properties are highlighted on the side. Columns: single nuclei; Rows: genes. (f) Scatter plot showing the percentage of ‘Spp1’ and ‘Ecel1’ profile-specific genes expressed in individual TRN cells along the transcriptomic gradient. (g) Distribution of TRN Spp1+, Ecel1+ and intermediate populations DN and DP, along the transcriptomic gradient.
Figure 2.
Figure 2.. Ecel1+ and Spp1+ neurons show distinct spatial distribution across the TRN.
(a) RNA-FISH co-staining in coronal sections. TRN region is delineated based on Pvalb FISH signal. Scale bar: 200μm. D: dorsal; V: ventral; L: lateral; M: medial. IC: internal capsule; AM: anteromedial nucleus; AVVL: anteroventral nucleus; VPL: ventral posterolateral nucleus. Repeated with n = 9. The boxed area in image 5 is zoomed in (b). arrow: DP neurons; arrow-head, DN neurons. (c) Fraction of TRN Pvalb+ cells stained Spp1+, Ecel1+, DN or DP, quantified in RNA-FISH co-staining in coronal sections along anterior (A) to posterior (P) axis. Insert: Schematics of TRN coronal sections.
Figure 3.
Figure 3.. Topographical map of TRN-thalamus projections.
(a) Right: Experiment schematics illustrating injection of retrograde fluorescent beads (RetroBeads) in first-order (FO) or higher-order (HO) thalamic nuclei and retrograde tracing to the projecting TRN neurons. Left: an example illustrating tracing from FO (dLGN) and HO (LP) visual thalamic nuclei. (b) Percentage of Spp1+, Ecel1 +, DP and DN cells labeled by RetroBeads traced from injections targeting different thalamic nuclei, (p=1.45×10⁻²⁶ , two-sided χ-square test. Bars represent mean ± SD). (c) Retrograde tracing of TRN neurons by projecting to FO thalamic nuclei (dLGN, VPM and vMGN, left column) and HO nuclei (LP, POm and dMGN, right column) overlapped with RNA-FISH co-staining for Spp1 and Ecel1, showing high overlap of RetroBeads and Spp1+ staining when FO nuclei were injected and high overlap of RetroBeads and Ecel1+ when HO nuclei were injected. Separate channels are shown in the columns on the right side (upper row panels: injection in FO nuclei; lower row panels: injection in HO nuclei). VL: ventral lateral nucleus; ST: stria terminalis; VPL: ventral posterolateral nucleus. For (b) and (c), n = 3 mice per region.
Figure 4.
Figure 4.. Spp1+ and Ecel1+ TRN subpopulations show distinct electrophysiological signatures.
(a) Left: Schematics of experiments. Right: Localization of Patch-Seq neurons in TRN coronal sections. (b) Example of the recording protocol to measure bursting firing: neurons were held at different membrane potentials followed by a hyperpolarizing pulse injection, and traces were quantified for different parameters including the maximum number of rebound bursts. (c) Summary of rebound burst properties (p=0.0001 for all three parameters, two-sided unpaired t-test). Mean ± SD and raw data points. Spp1+ (n=29), Ecel1+ (n=15), DP (n=10) and DN (n=13) neurons collected from 5 mice. (d) Number of rebound bursts generated at different membrane potentials (bars represent mean ± SD). Spp1+ (n=24), Ecel1+ (n=15), DP (n=9) and DN (n=10) neurons collected from 5 mice. (e) The 3D plot of rebound bursts #, frequency within the first rebound burst (rbFreq) and AHP, showing the continuous distribution pattern of Ecel1+ (n=15), DP (n=9),DN (n=10), and Spp1+ (n=29) neurons, collected from 5 mice. (f) Correlation of the gradient score with the maximum burst # (n=59 neurons). Line represents linear regression fitting.
Figure 5.
Figure 5.. Selective perturbation of the firing properties of Spp1+ or Ecel1+ neurons in vivo reveals their differential participation in thalamocortical rhythms.
(a) TRN labeled retrogradely with injection in FO (upper) and HO (lower) thalamic nuclei. Left: coronal sections showing TRN (Pvalb, PV) neurons retrogradely-labeled by Gamma6-mCherry (red). Right: Zoom-in views of merged and single-color images of boxed area in the left panel. Scale bar: 100μm. (b) Traces showing differential firing activity changes in TRN neurons in response to hyperpolarizing current-step injections after Gamma6 viral injections in FO vs. HO thalamic nuclei, which retrogradely labels preferentially Spp1+ and Ecel1+ neurons respectively. (c) Gamma6 significantly reduced the number of rebound bursts in TRN neurons (FO control 6.1 ± 1.6 bursts vs. Gamma6 1.7 ± 0.8 bursts, p=0.0001; HO control 1.1 ± 0.26 bursts vs. Gamma6 0.3 ± 0.1 bursts, p=0.0081, two-sided unpaired t-test). Mean ± SD and raw data points. For (a), (b), and (c), FO ncontrol=14 and nGamma6=18 neurons collected from 4 animals, HO ncontrol=12 and nGamma6=11 neurons collected from 4 animals. (d) Left: normalized power spectrum. Right: percentage of power in delta rhythm. Gamma6 expressed in TRN neurons labeled retrogradely from FO led to reduction in the power of delta rhythms (1-4 Hz) (FO: p=0.0045; HO: p=0.75, two-sided unpaired t-test, NS: not significant), (e) significant reduction in spindle density (FO: p=0.038; HO: p=0.96, two-sided Wilcoxon rank-sum test), and (f) decreased spindle length, but increased spindle length when expressed in TRN neurons labeled retrogradely from HO somatosensory thalamic nucleus (Kolmogorov-Smirnov test). Insert: Representative traces of sleep spindles. For data in (d), (e), and (f), FO ncontrol=8, nGamma6=8, HO ncontrol=7, nGamma6=8 animals. Box plots represent minima, 25th, 50th, 75th percentiles, maxima, and raw data points.

References

    1. Dong P et al. A novel cortico-intrathalamic circuit for flight behavior. Nat Neurosci 22, 941–949, doi:10.1038/s41593-019-0391-6 (2019). - DOI - PubMed
    1. Halassa MM et al. State-dependent architecture of thalamic reticular subnetworks. Cell 158, 808–821, doi:10.1016/j.cell.2014.06.025 (2014). - DOI - PMC - PubMed
    1. McAlonan K, Cavanaugh J & Wurtz RH Attentional modulation of thalamic reticular neurons. J Neurosci 26, 4444–4450, doi:10.1523/JNEUROSCI.5602-05.2006 (2006). - DOI - PMC - PubMed
    1. Pinault D The thalamic reticular nucleus: structure, function and concept. Brain Res Brain Res Rev 46, 1–31, doi:10.1016/j.brainresrev.2004.04.008 (2004). - DOI - PubMed
    1. Sherman SM & Guillery RW The role of the thalamus in the flow of information to the cortex. Philos Trans R Soc Lond B Biol Sci 357, 1695–1708, doi:10.1098/rstb.2002.1161 (2002). - DOI - PMC - PubMed

References for Methods

    1. Krishnaswami SR et al. Using single nuclei for RNA-seq to capture the transcriptome of postmortem neurons. Nat Protoc 11, 499–524, doi:10.1038/nprot.2016.015 (2016). - DOI - PMC - PubMed
    1. Kim D et al. TopHat2: accurate alignment of transcriptomes in the presence of insertions, deletions and gene fusions. Genome Biol 14, R36, doi:10.1186/gb-2013-14-4-r36 (2013). - DOI - PMC - PubMed
    1. Li B & Dewey CN RSEM: accurate transcript quantification from RNA-Seq data with or without a reference genome. BMC Bioinformatics 12, 323, doi:10.1186/1471-2105-12-323 (2011). - DOI - PMC - PubMed
    1. Langmead B & Salzberg SL Fast gapped-read alignment with Bowtie 2. Nat Methods 9, 357–359, doi:10.1038/nmeth.1923 (2012). - DOI - PMC - PubMed
    1. Zeisel A et al. Molecular Architecture of the Mouse Nervous System. Cell 174, 999–1014 e1022, doi:10.1016/j.cell.2018.06.021 (2018). - DOI - PMC - PubMed

Publication types

MeSH terms