. 2020 Jul;583(7818):845-851.
doi: 10.1038/s41586-020-2513-4. Epub 2020 Jul 22.

Signalling input from divergent pathways subverts B cell transformation

Affiliations

Signalling input from divergent pathways subverts B cell transformation

Lai N Chan et al. Nature. 2020 Jul.

Abstract

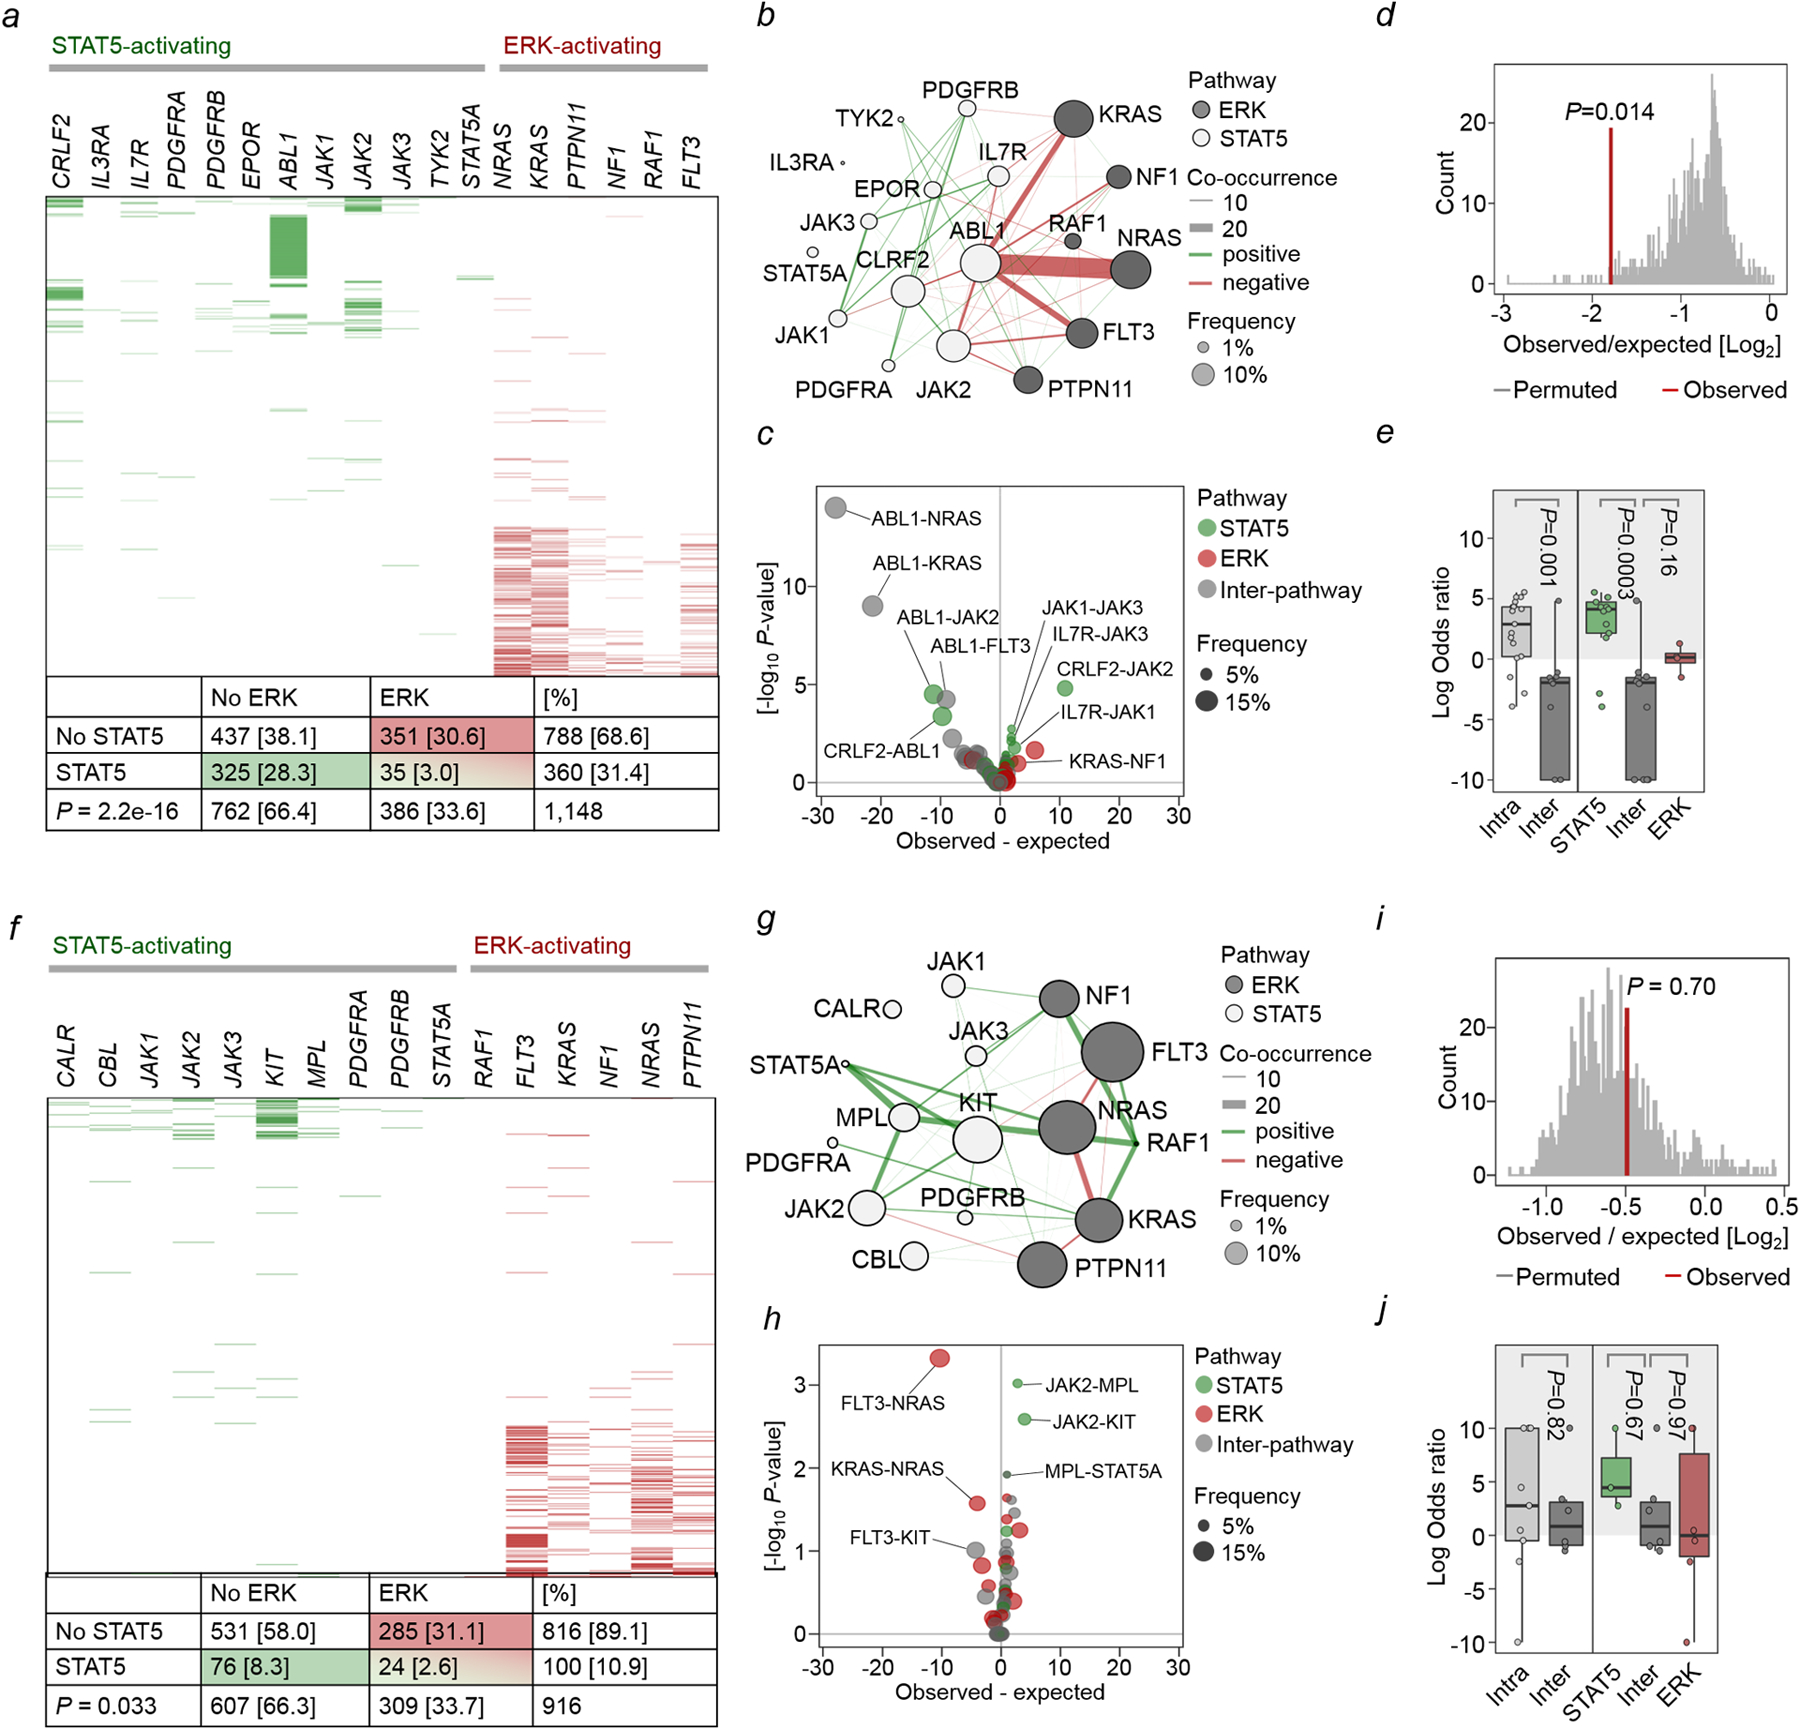
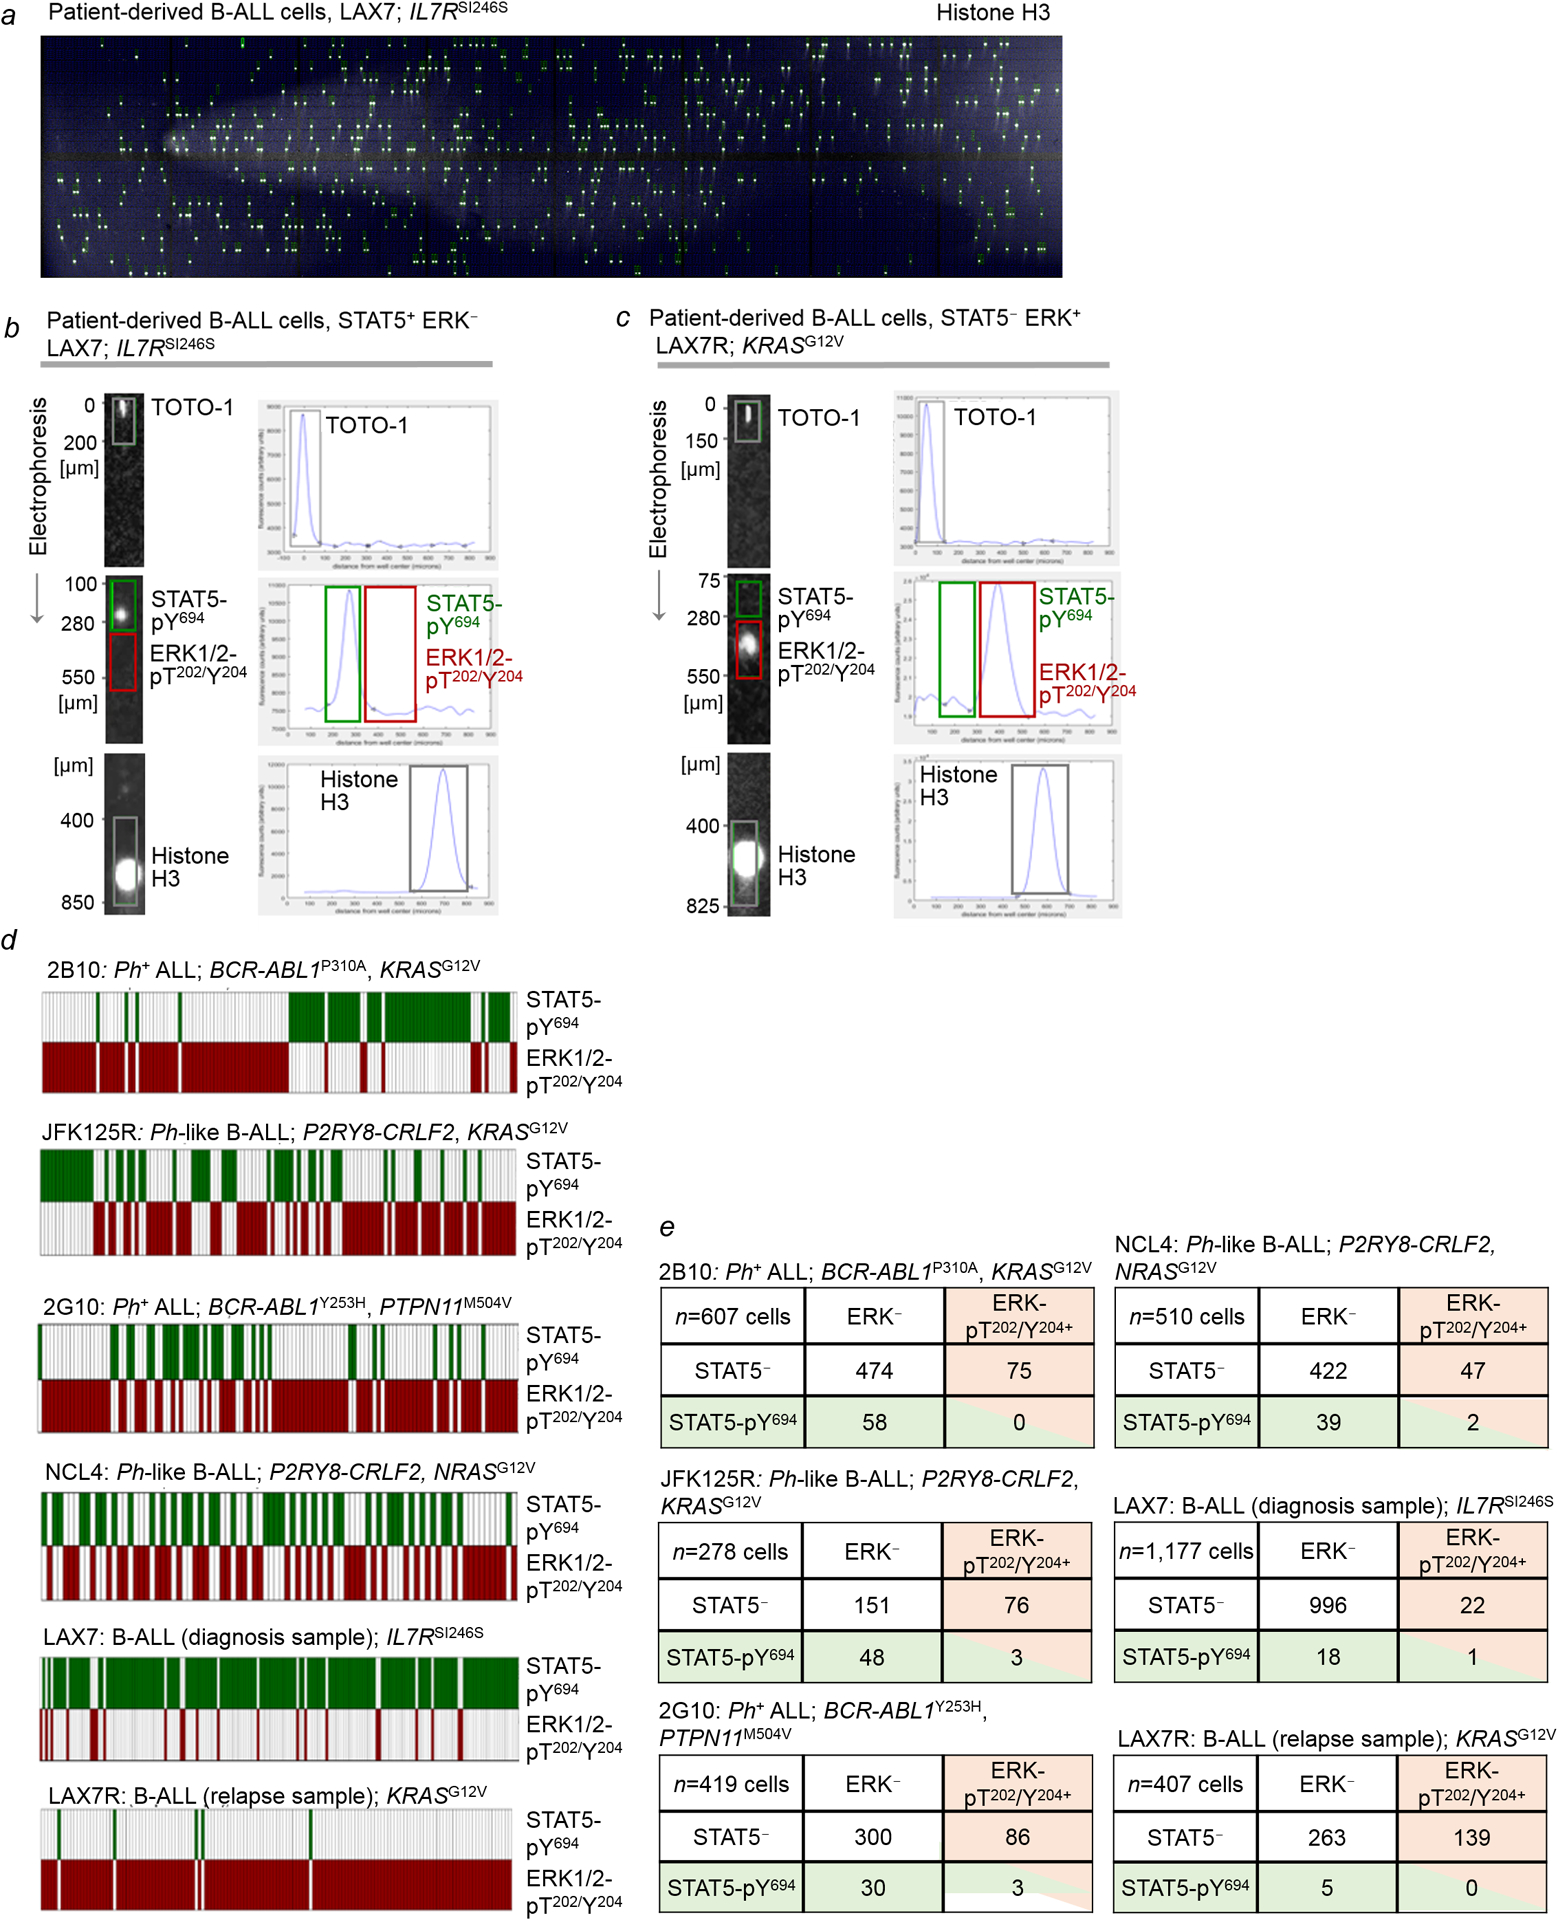
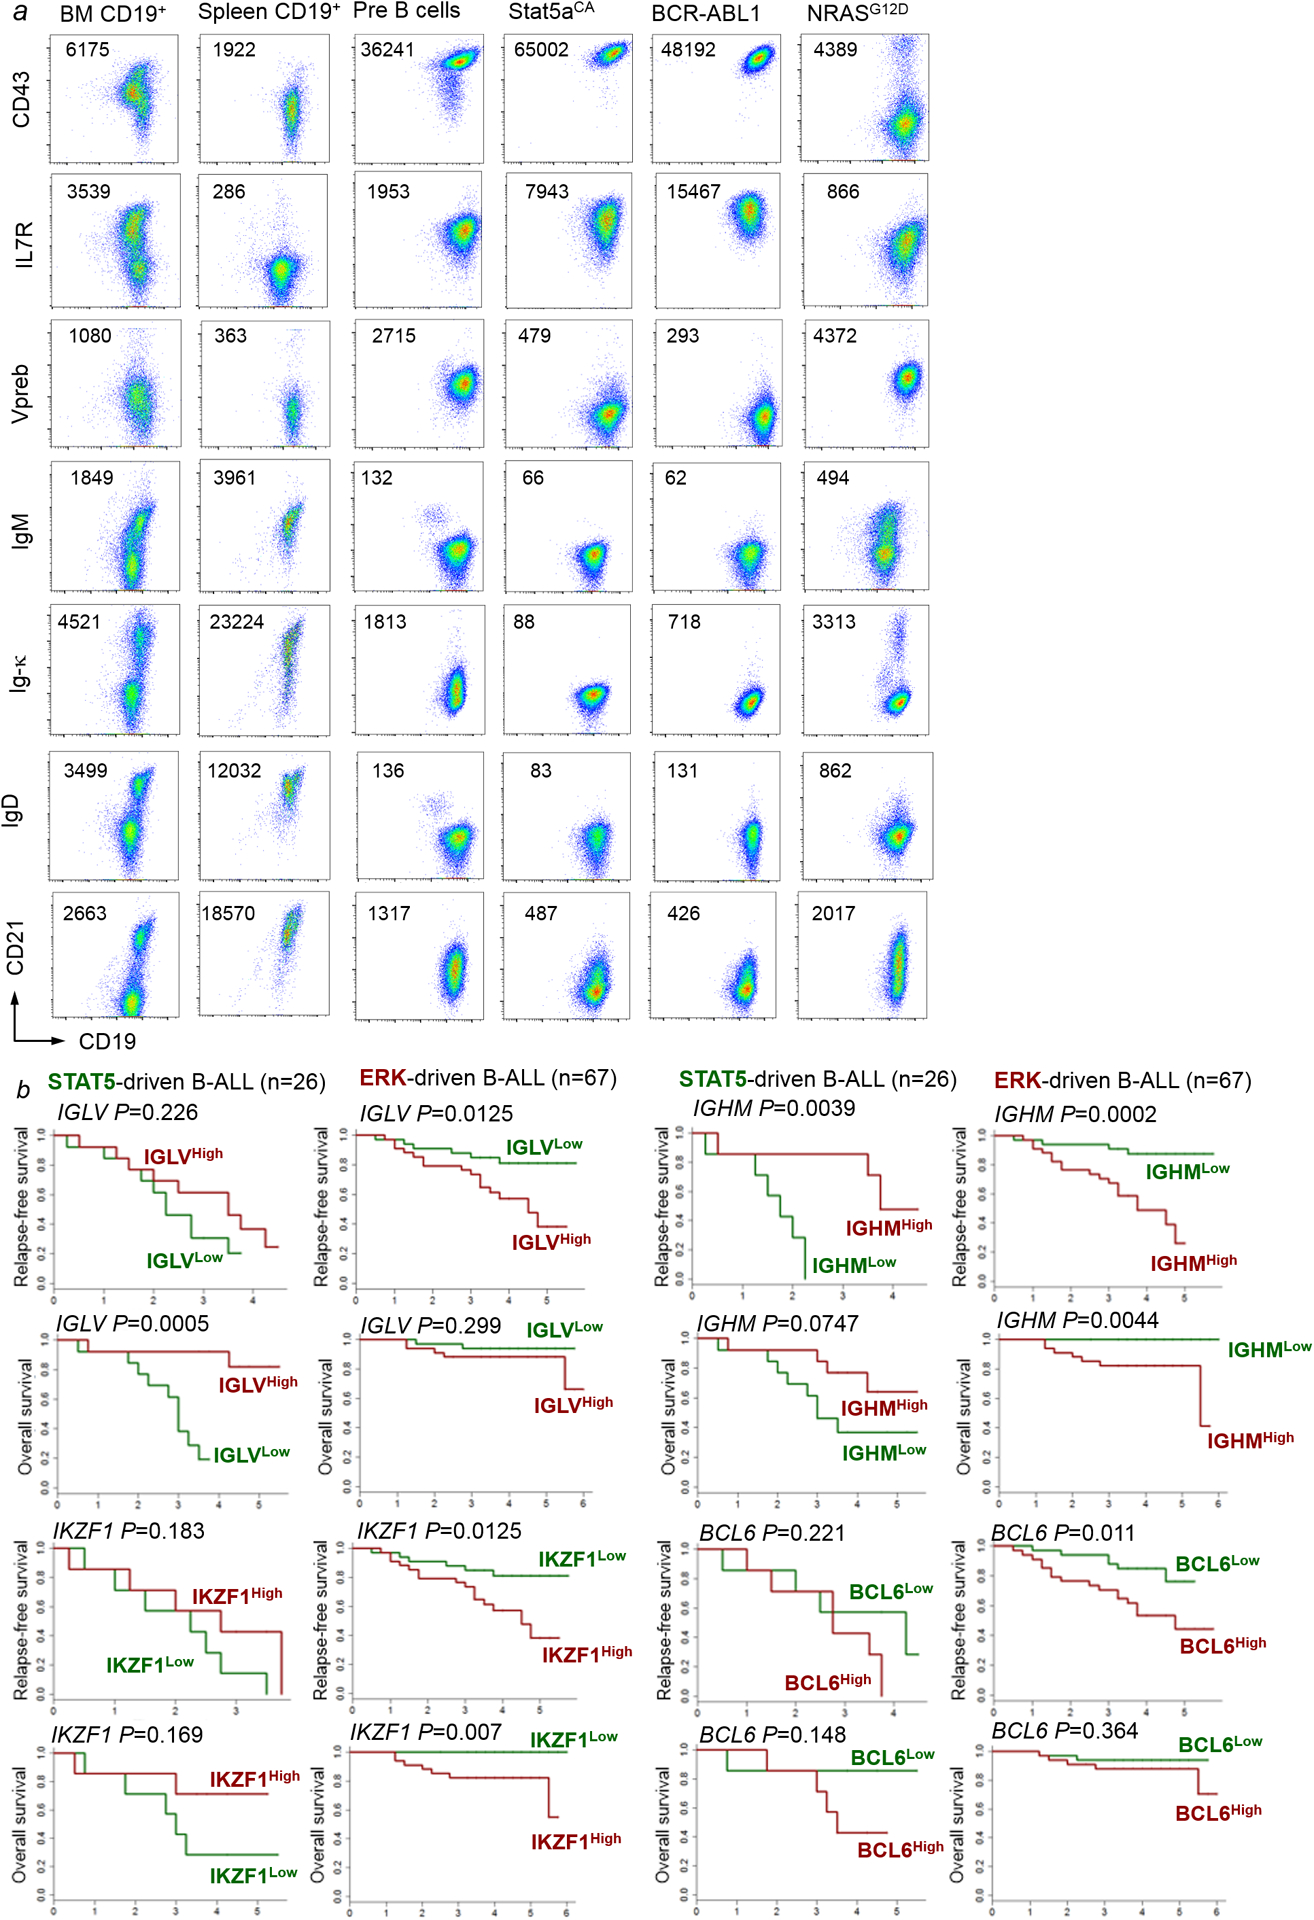
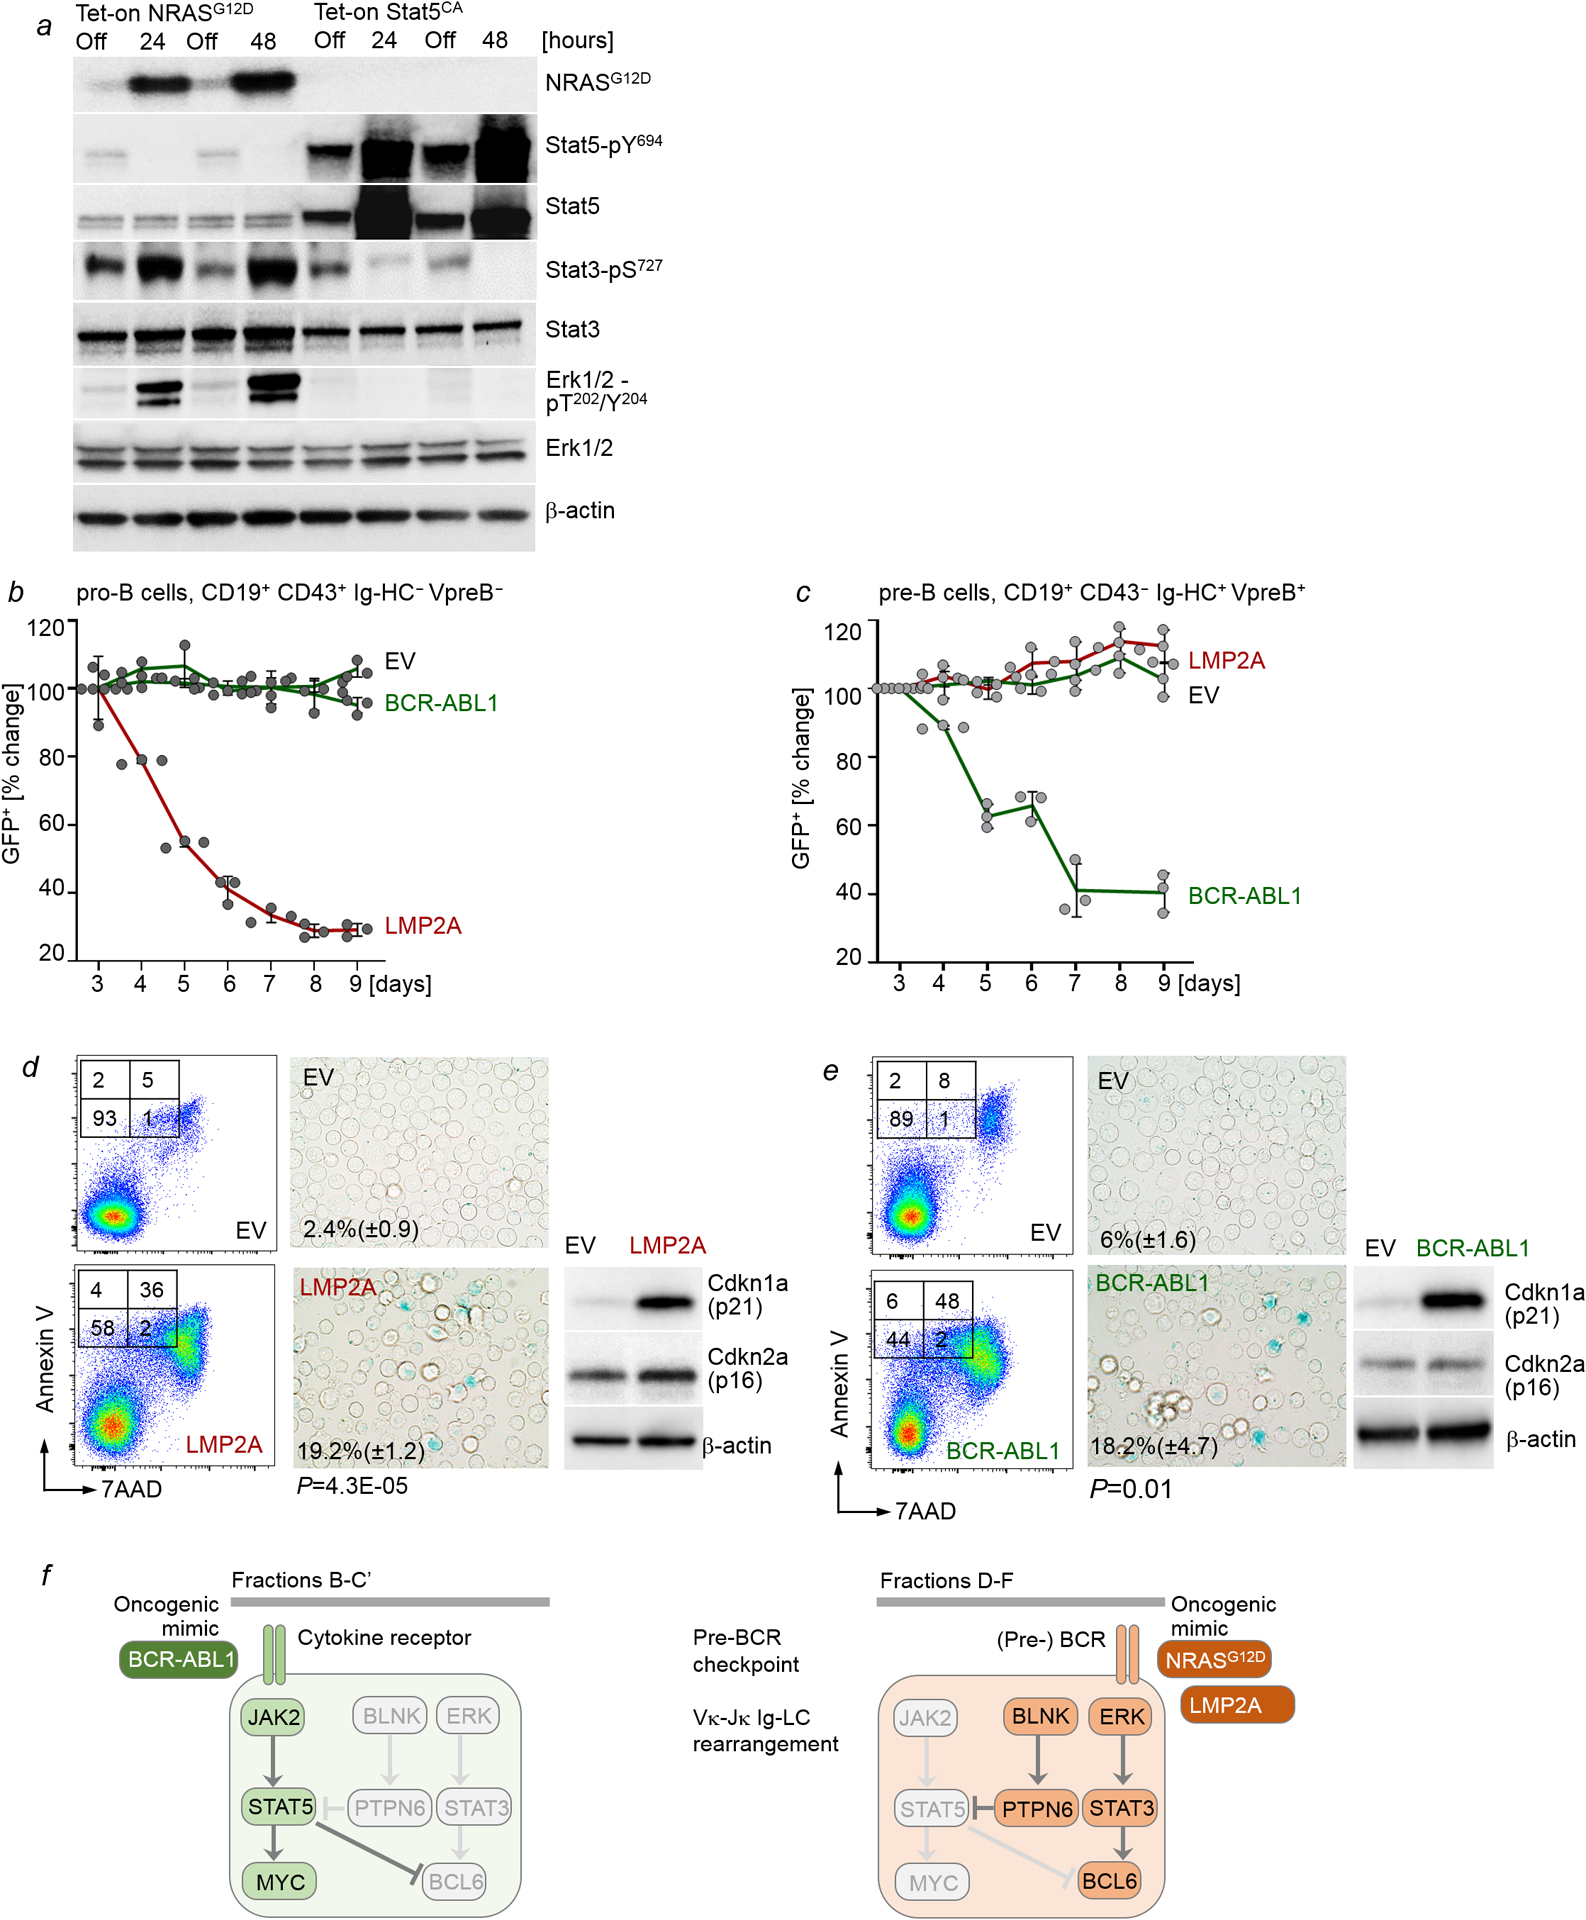
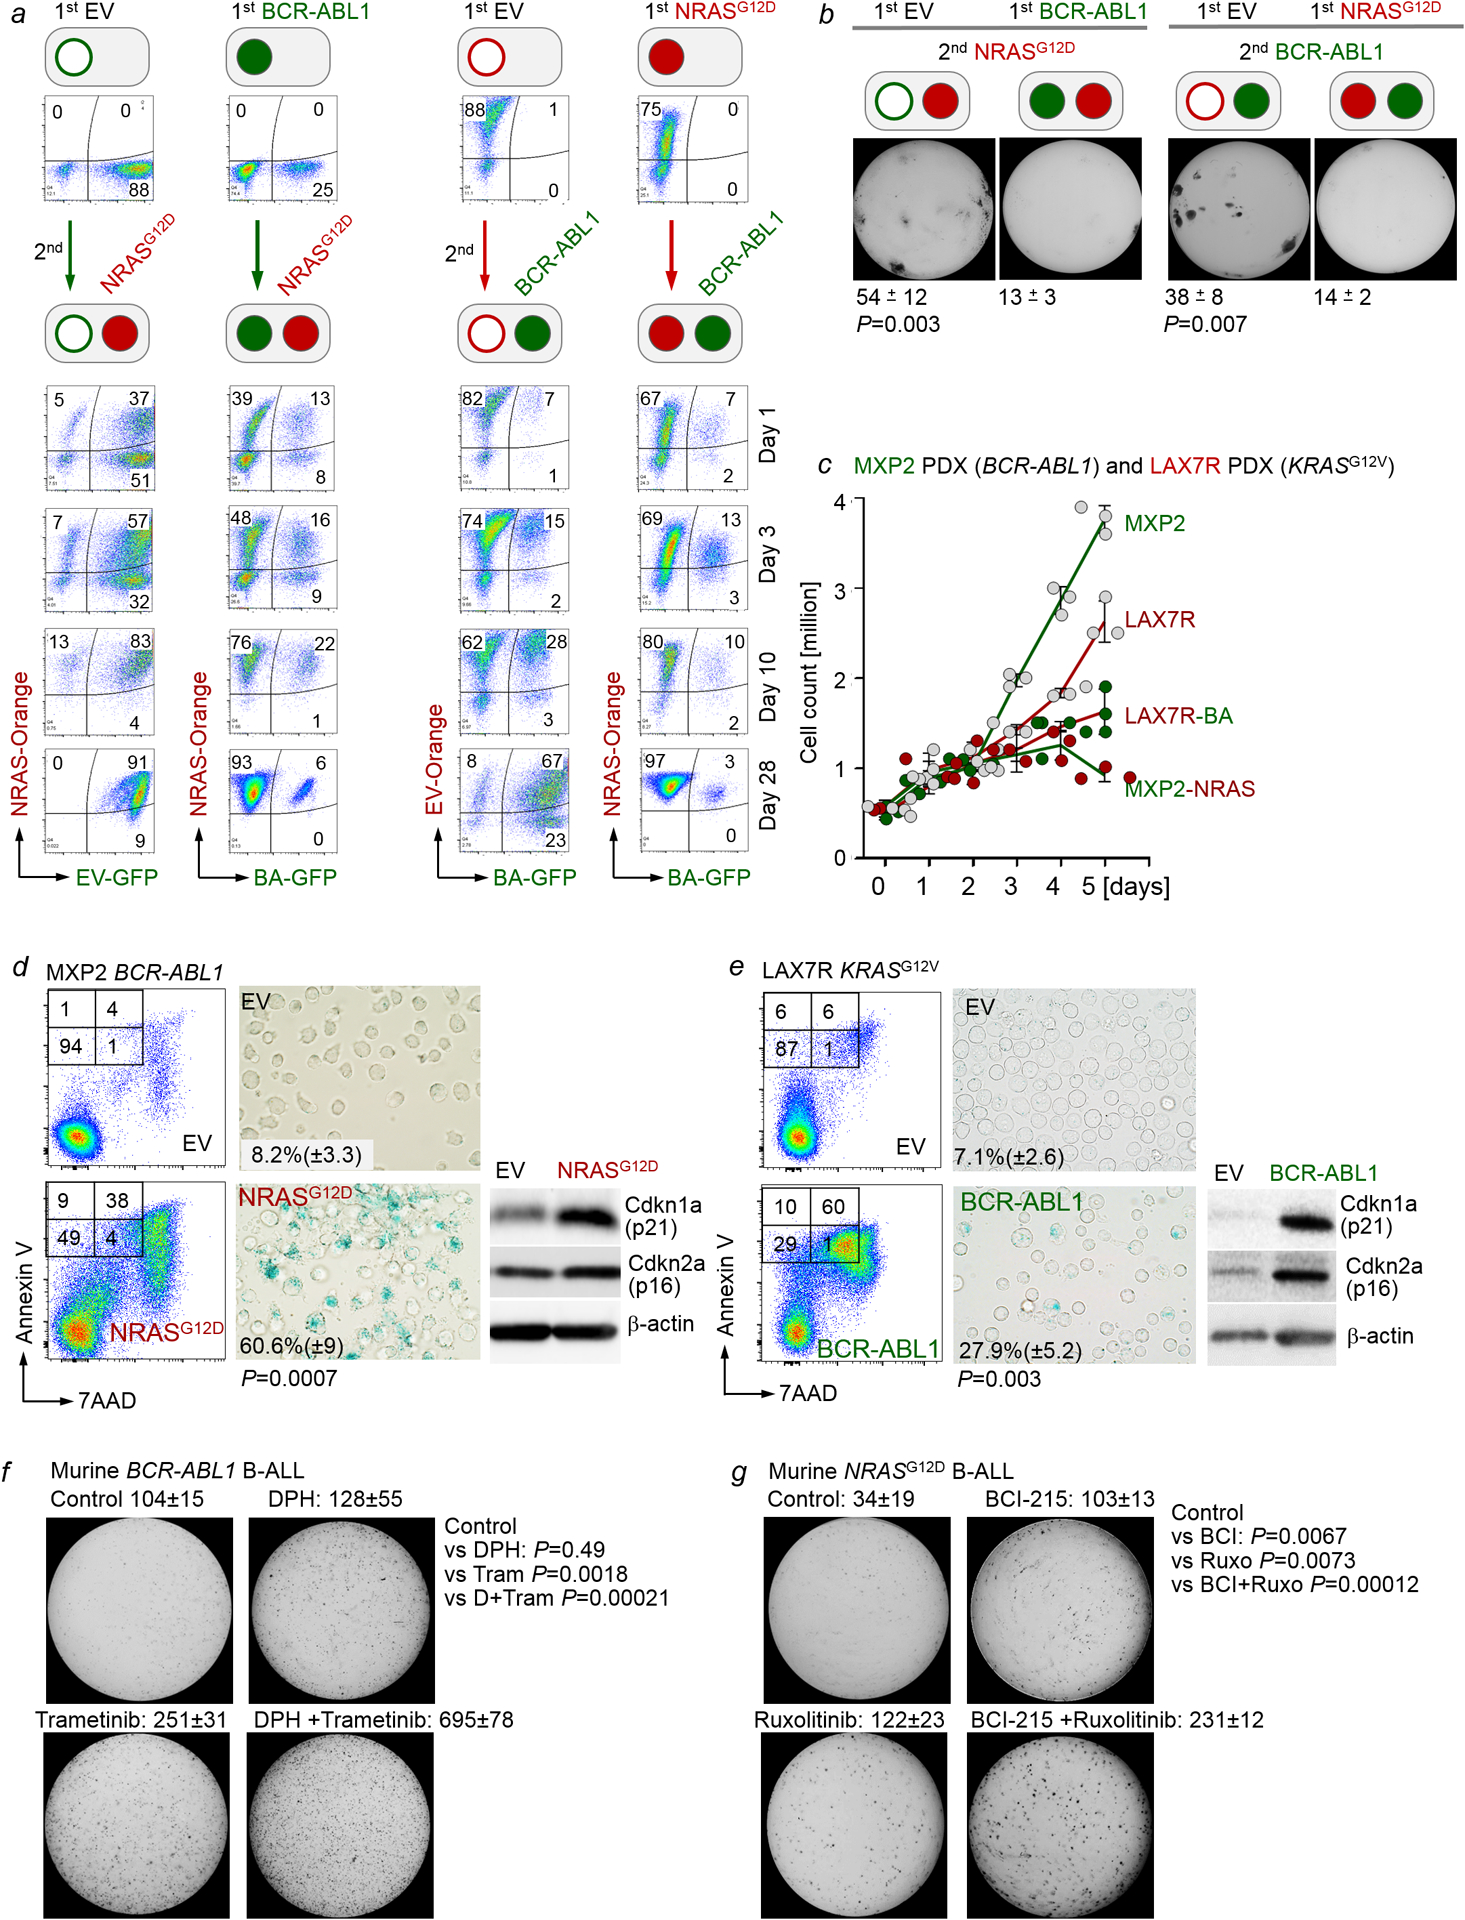
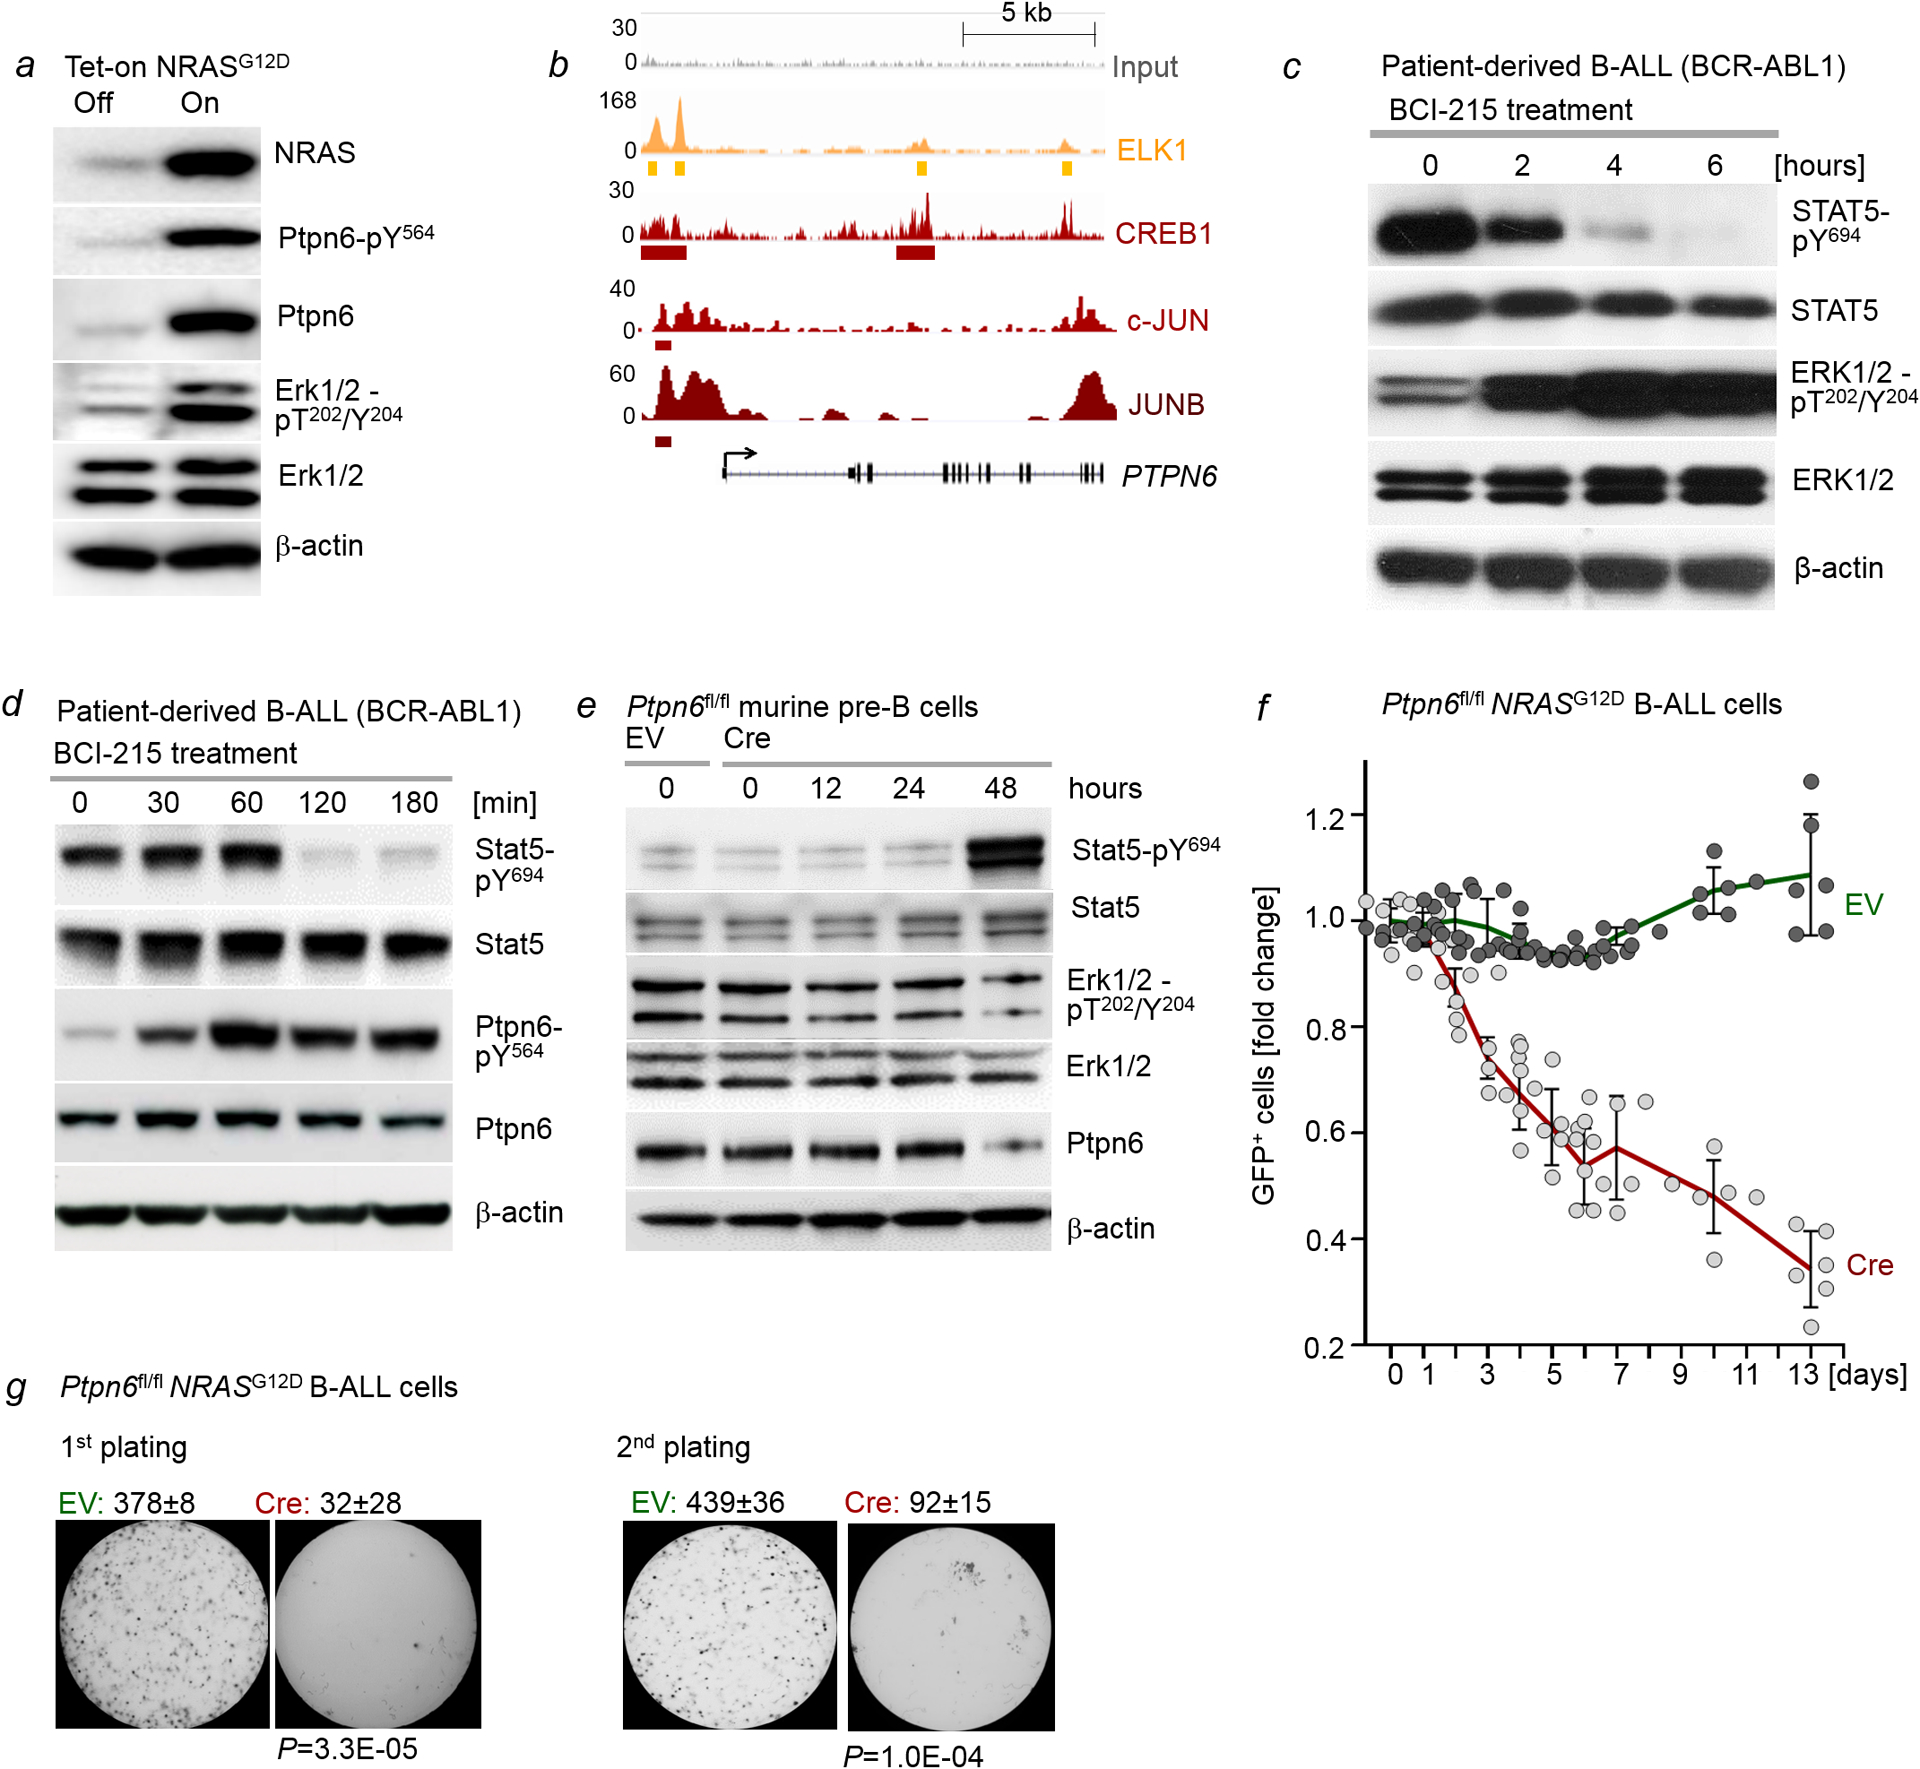
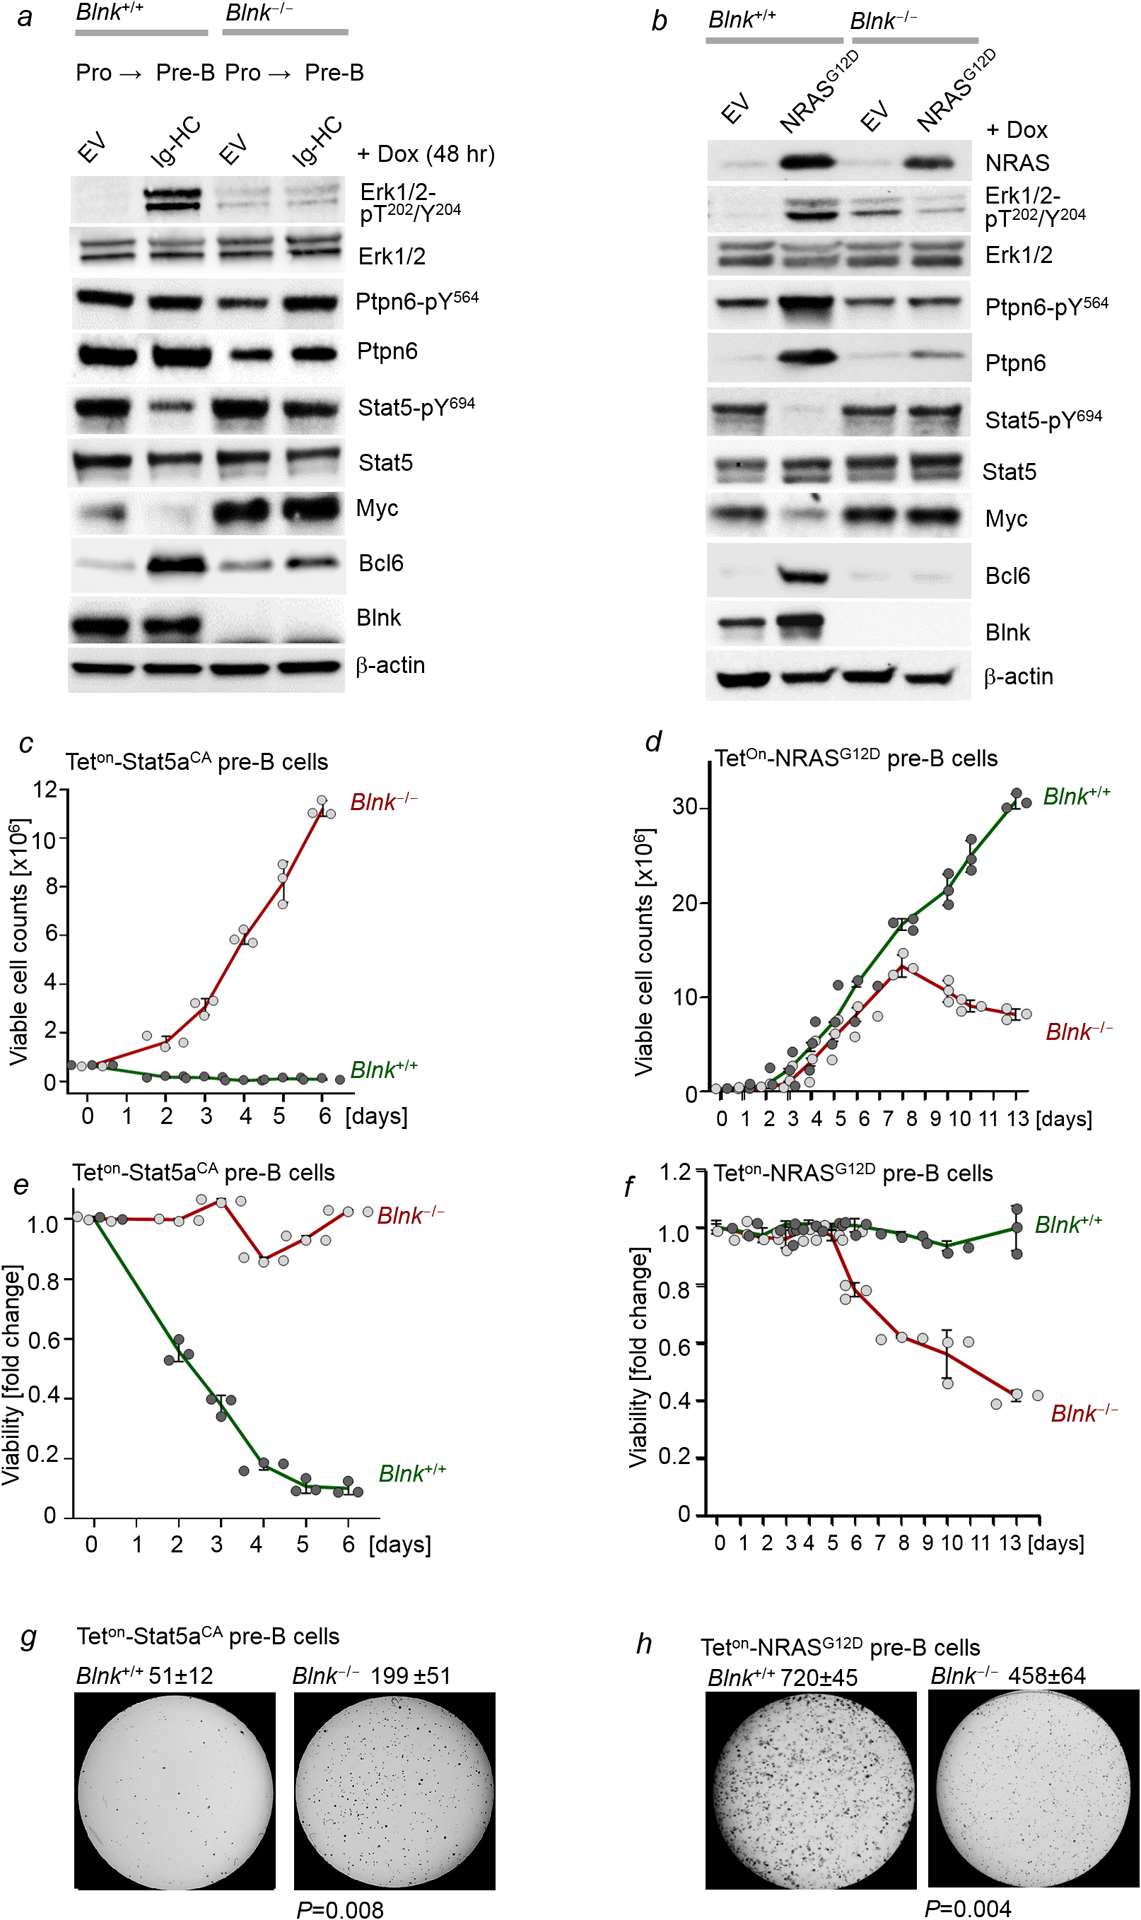
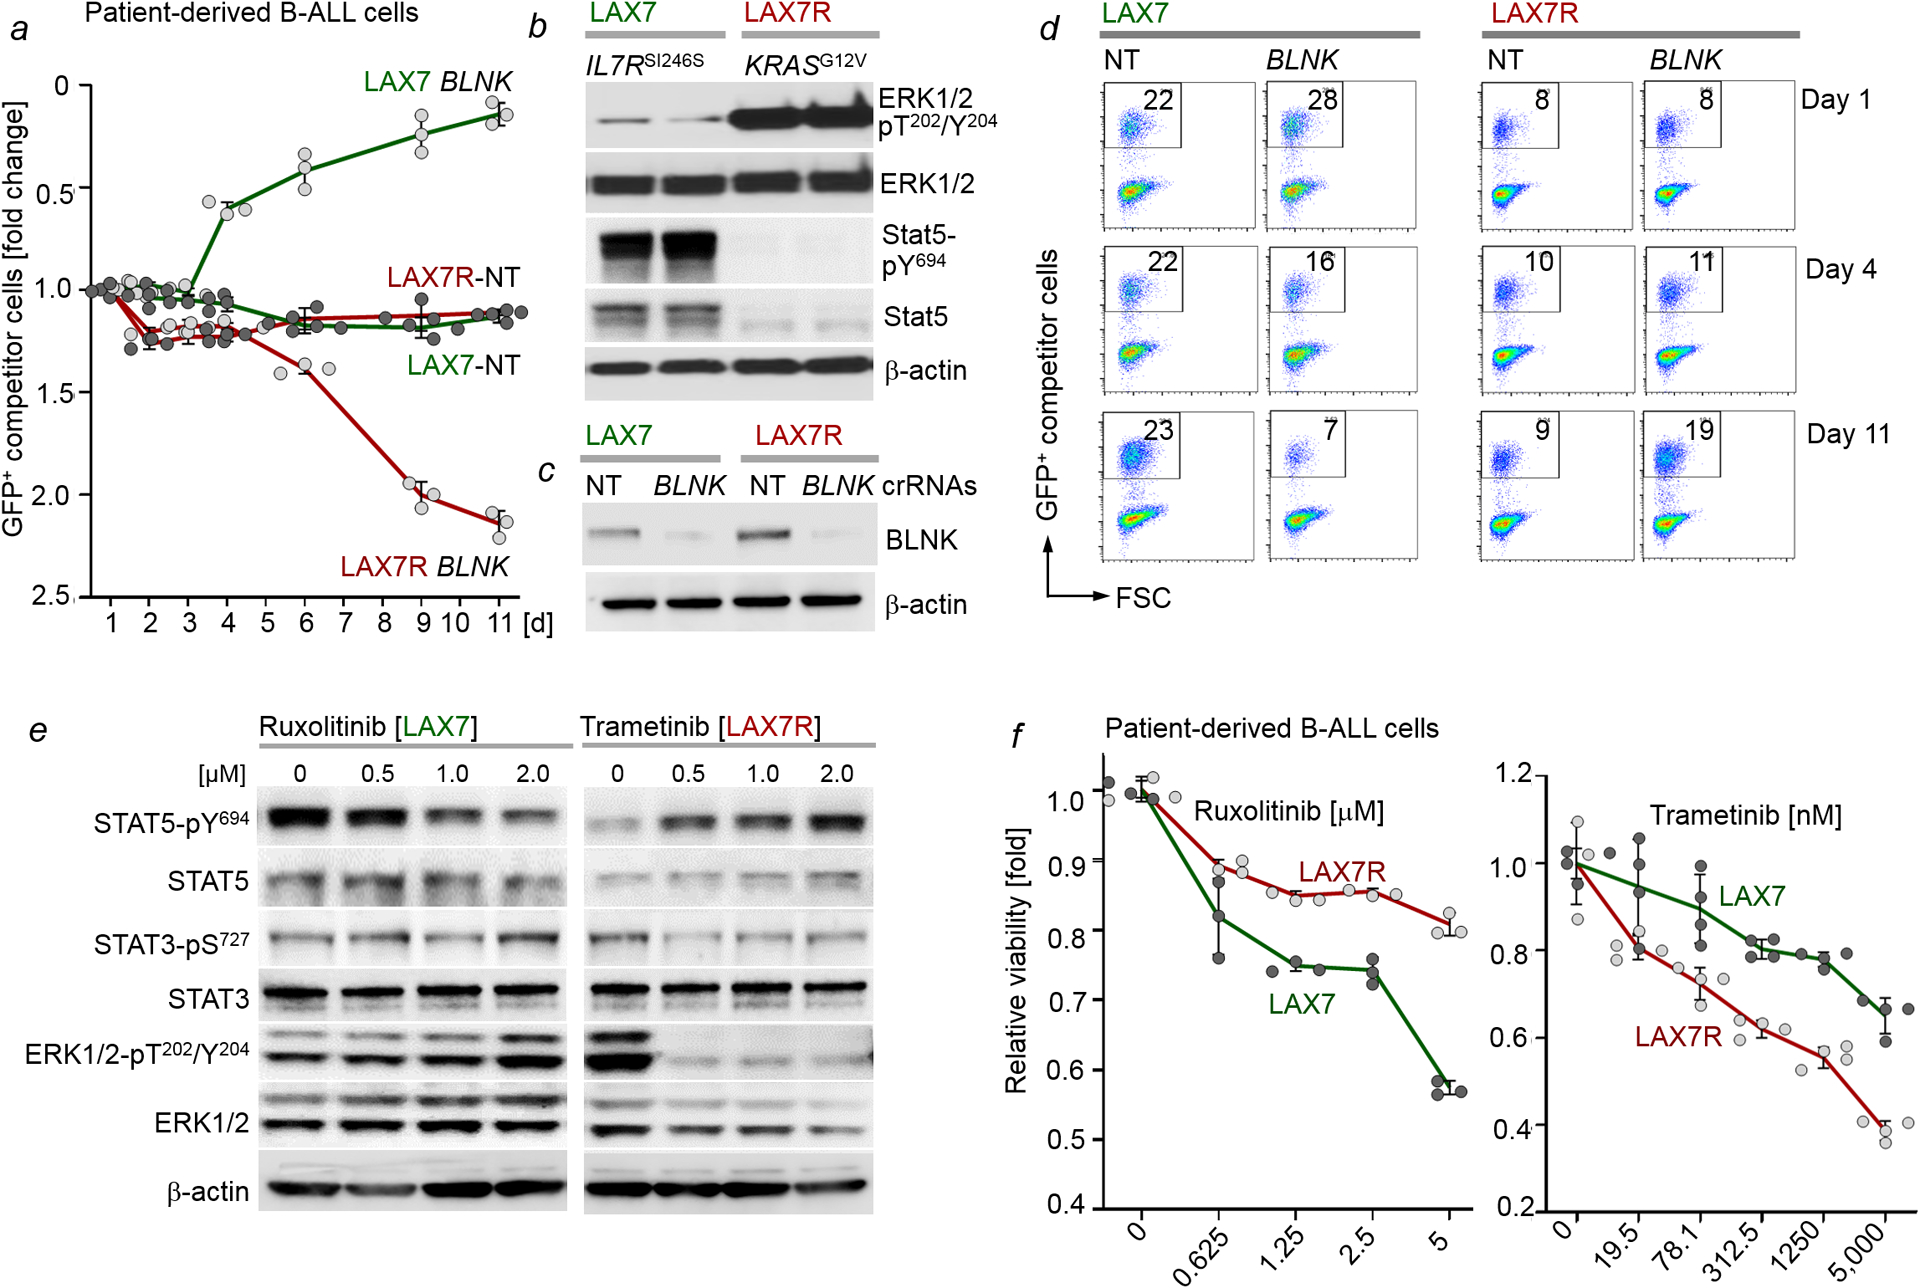
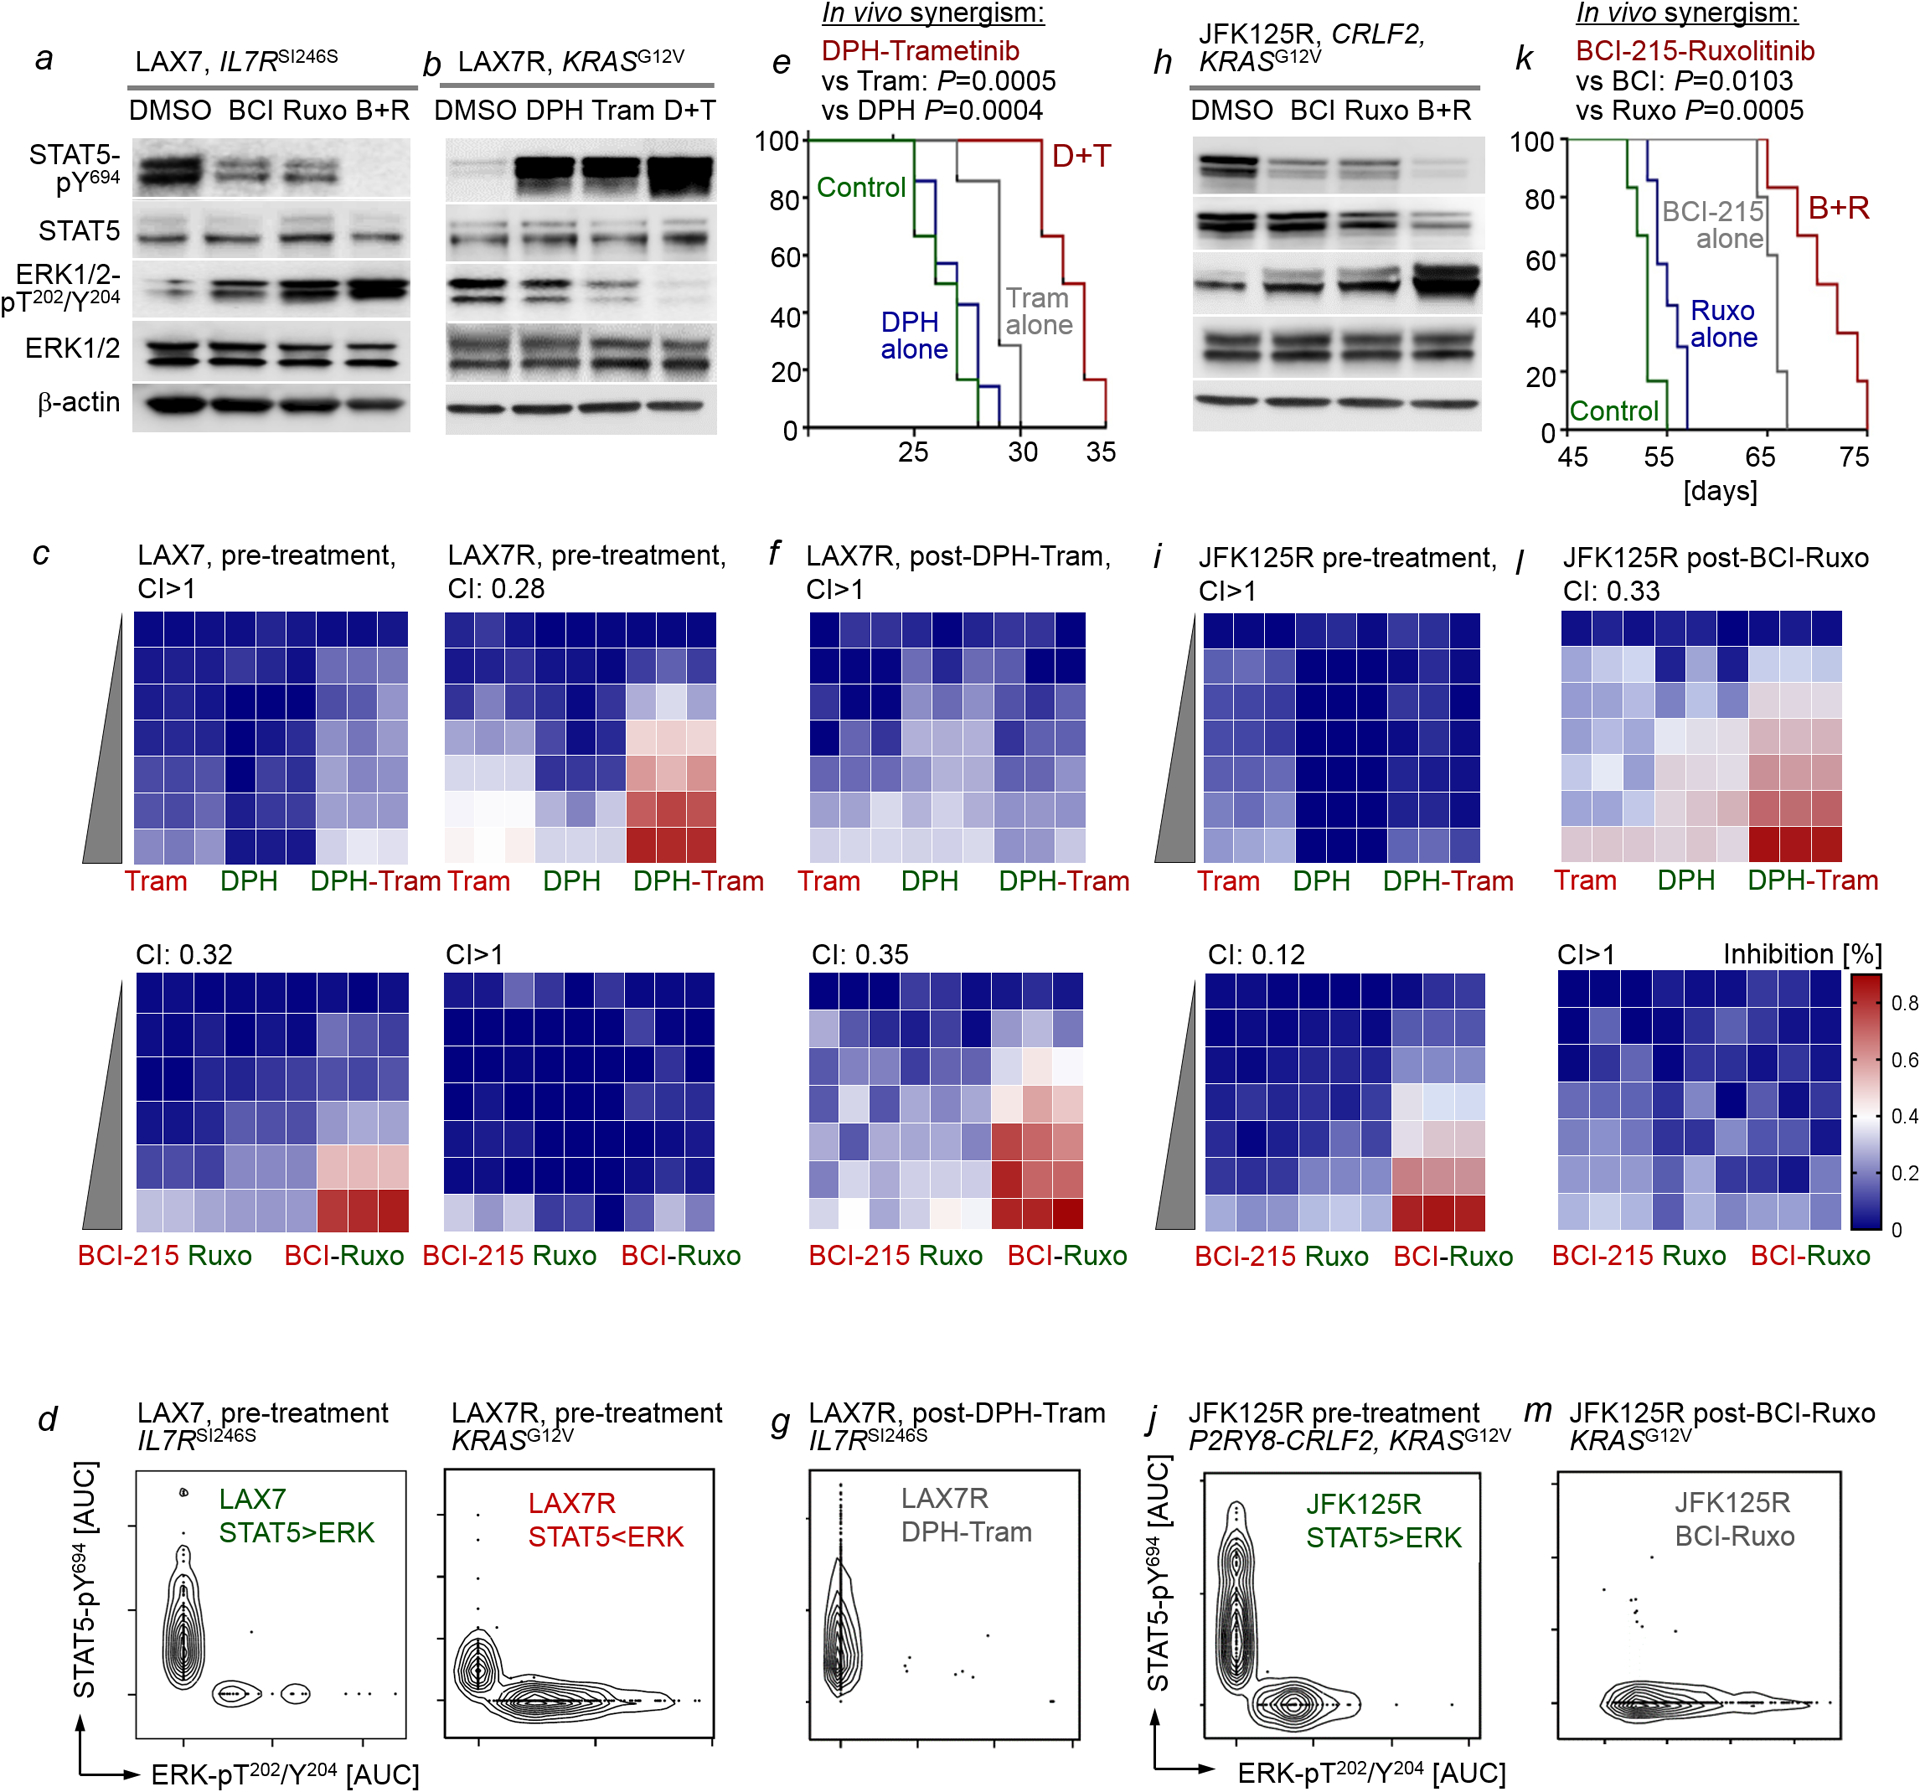
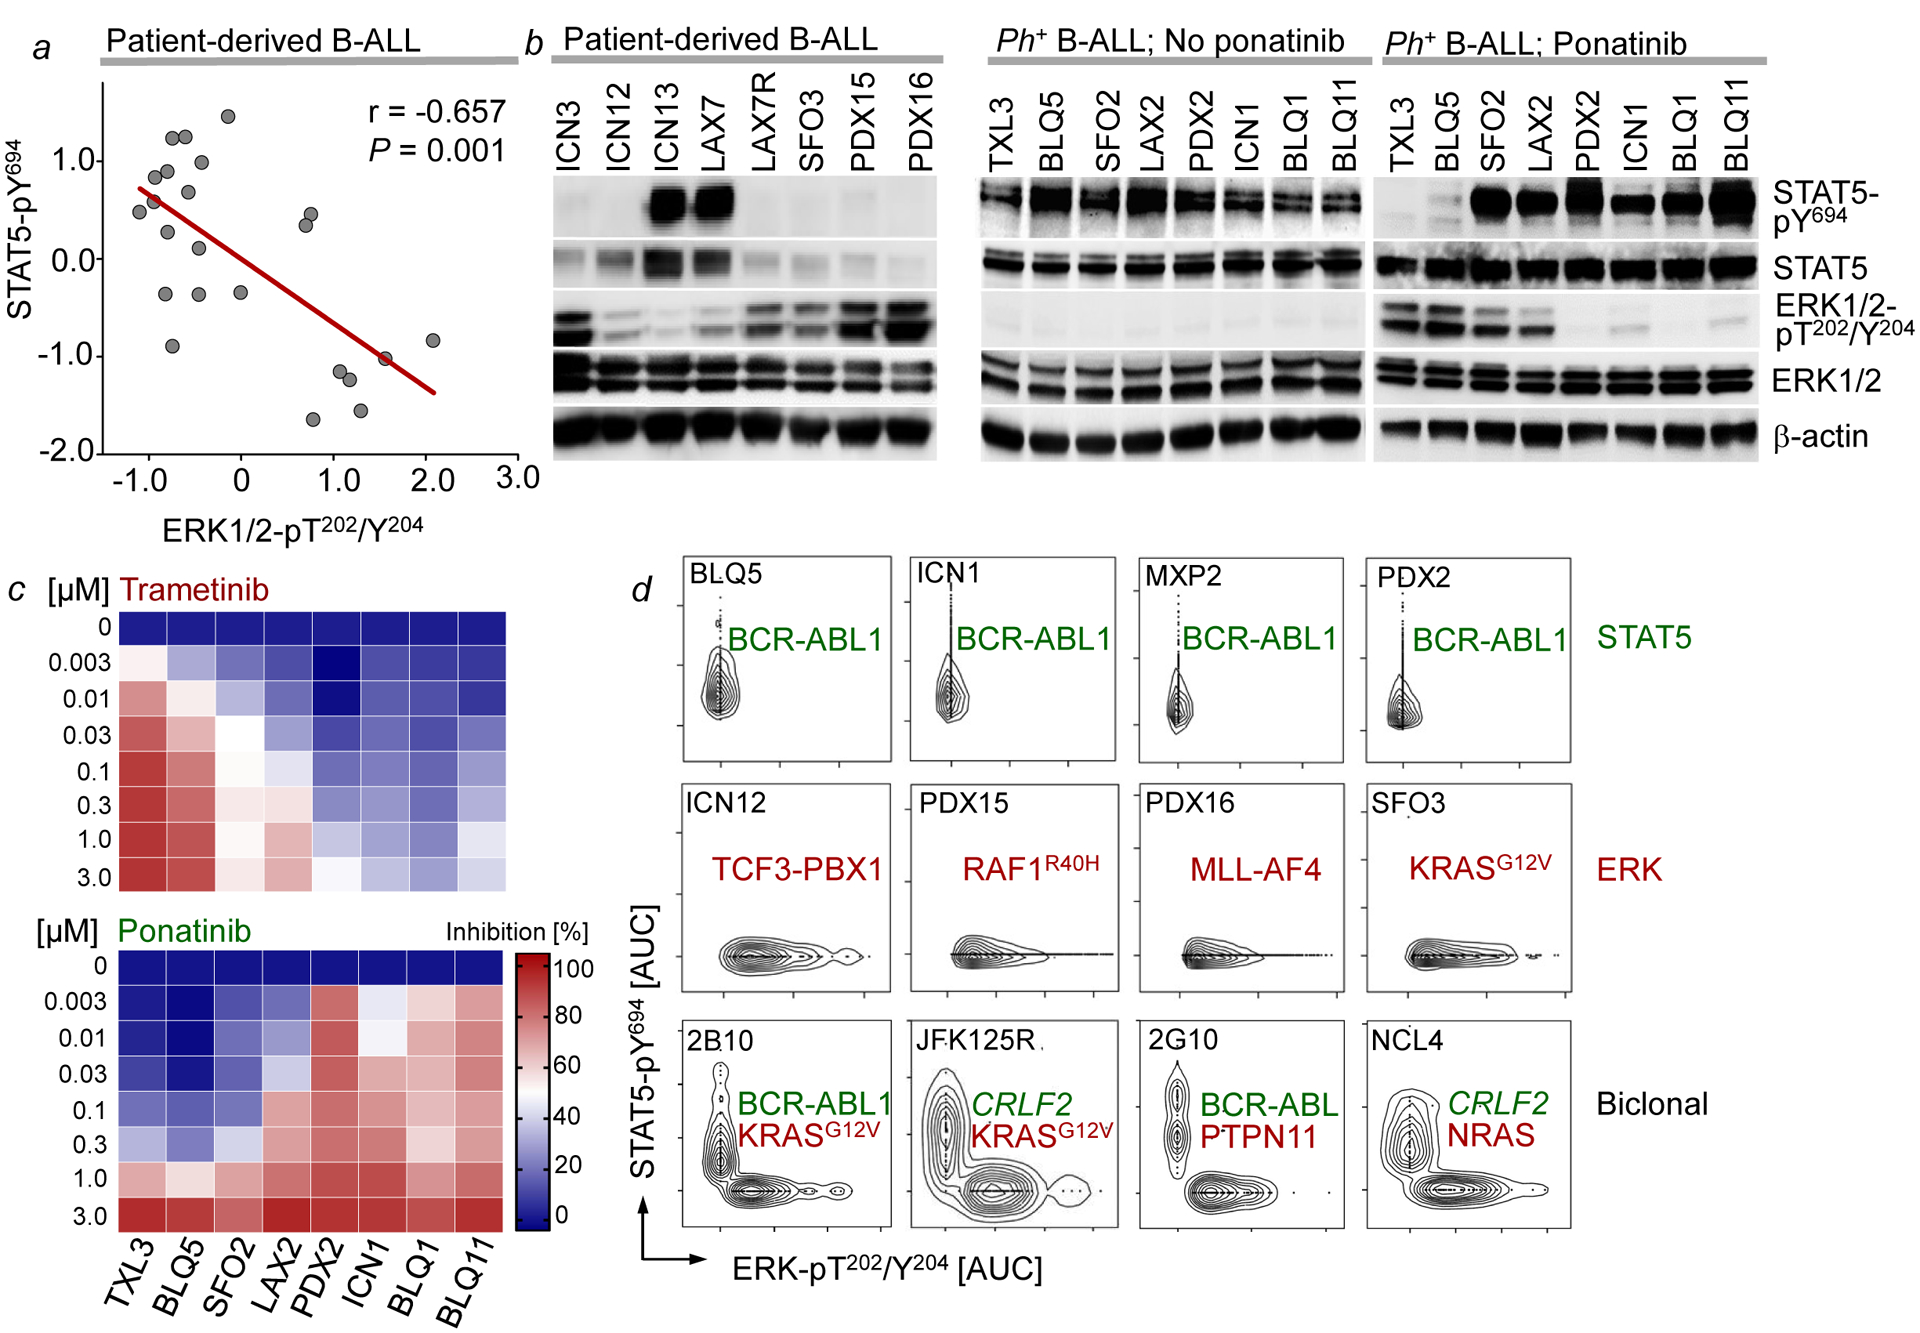
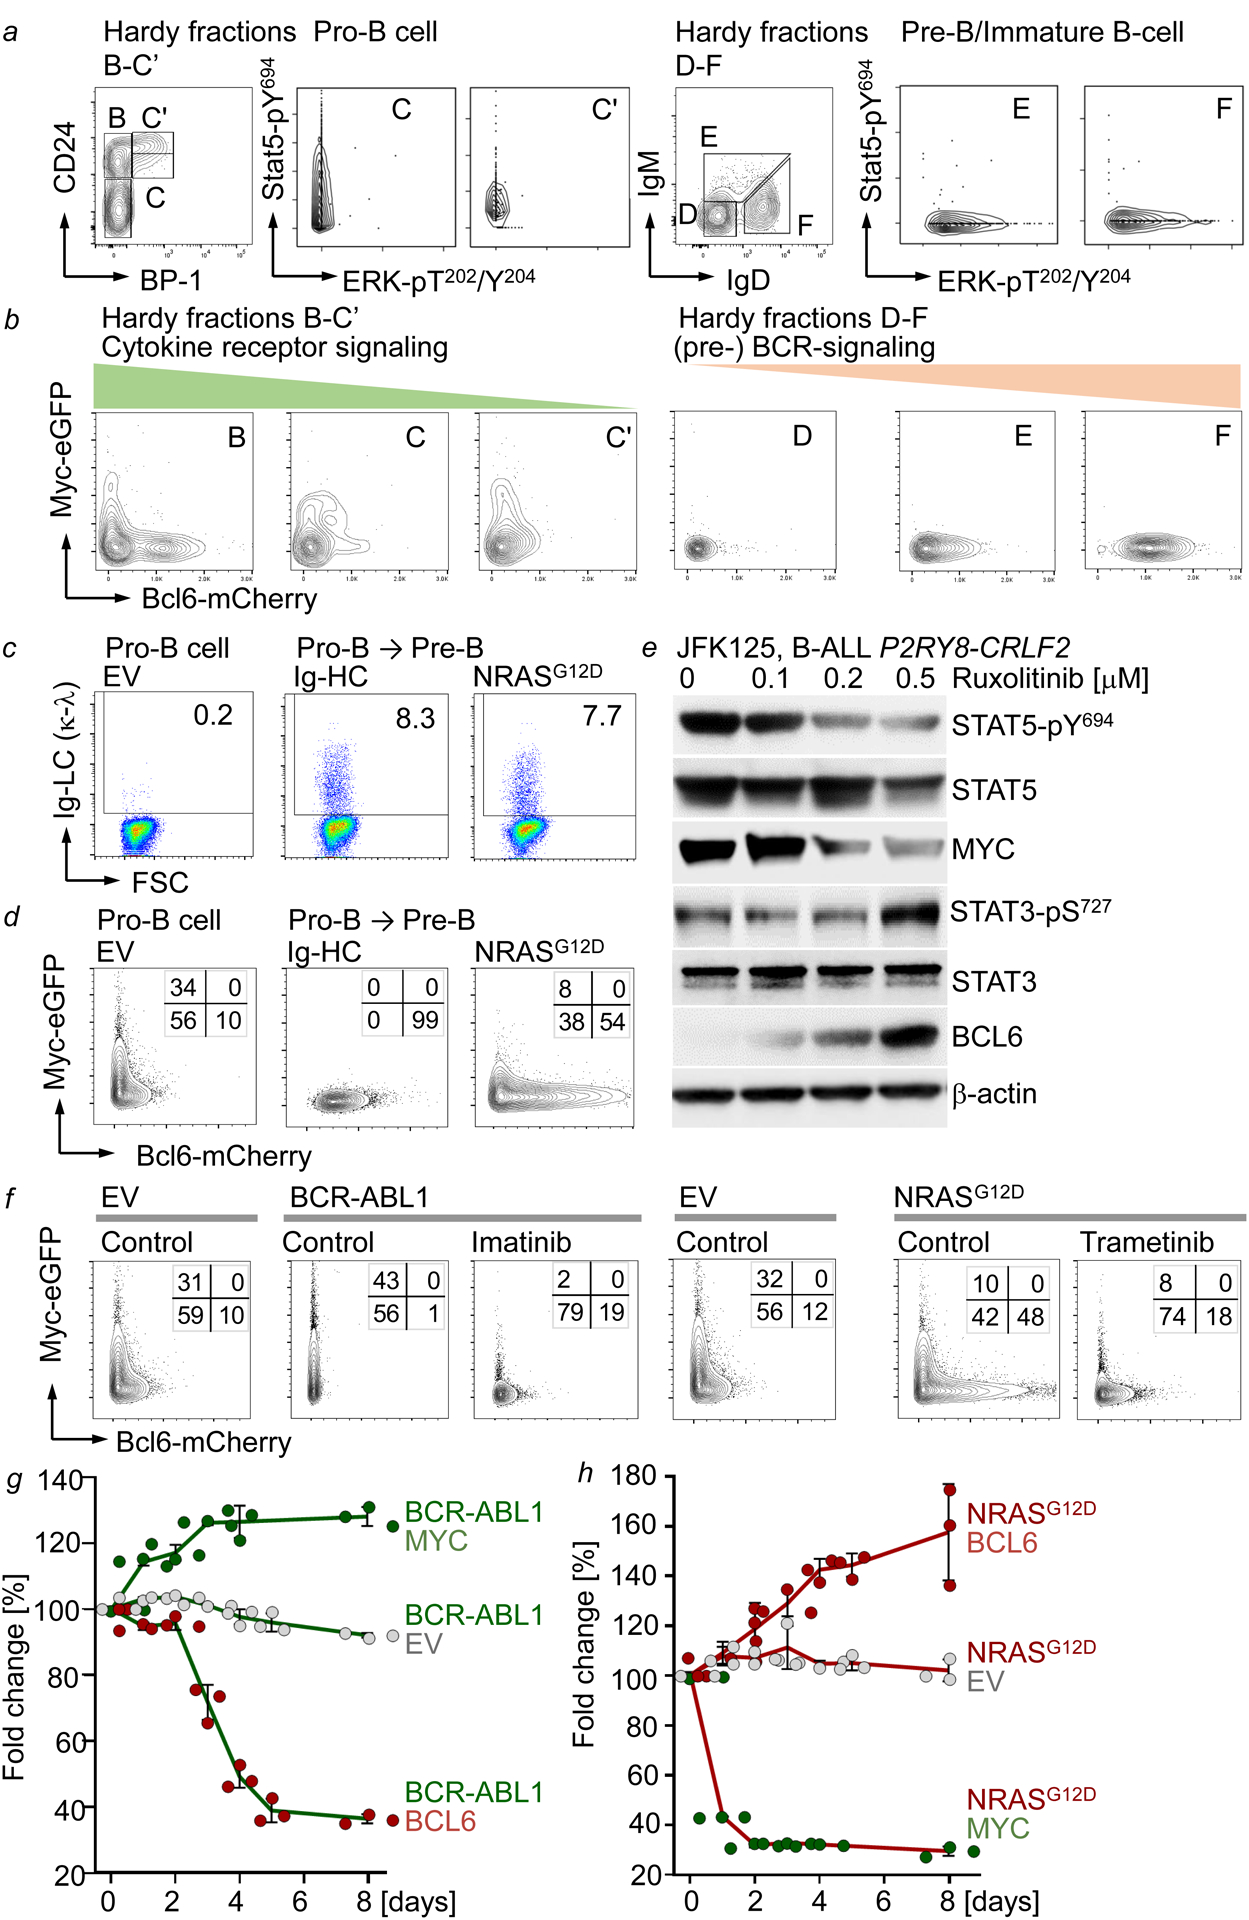
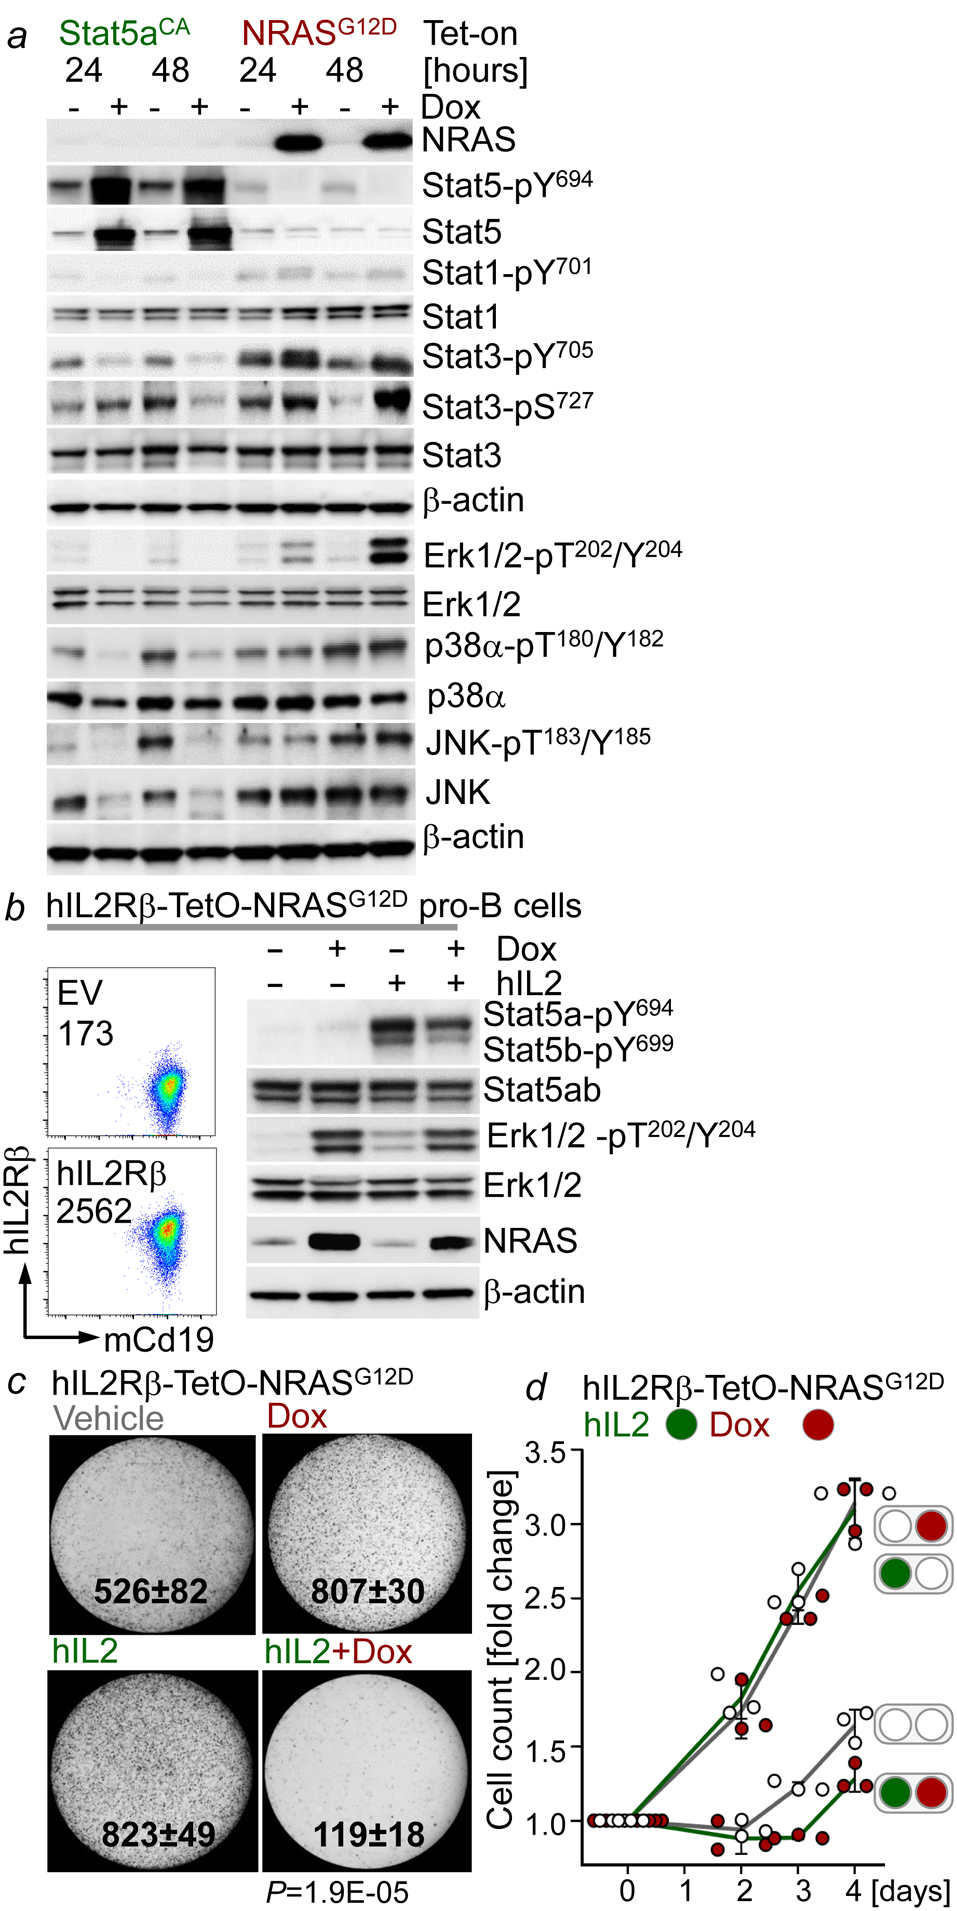
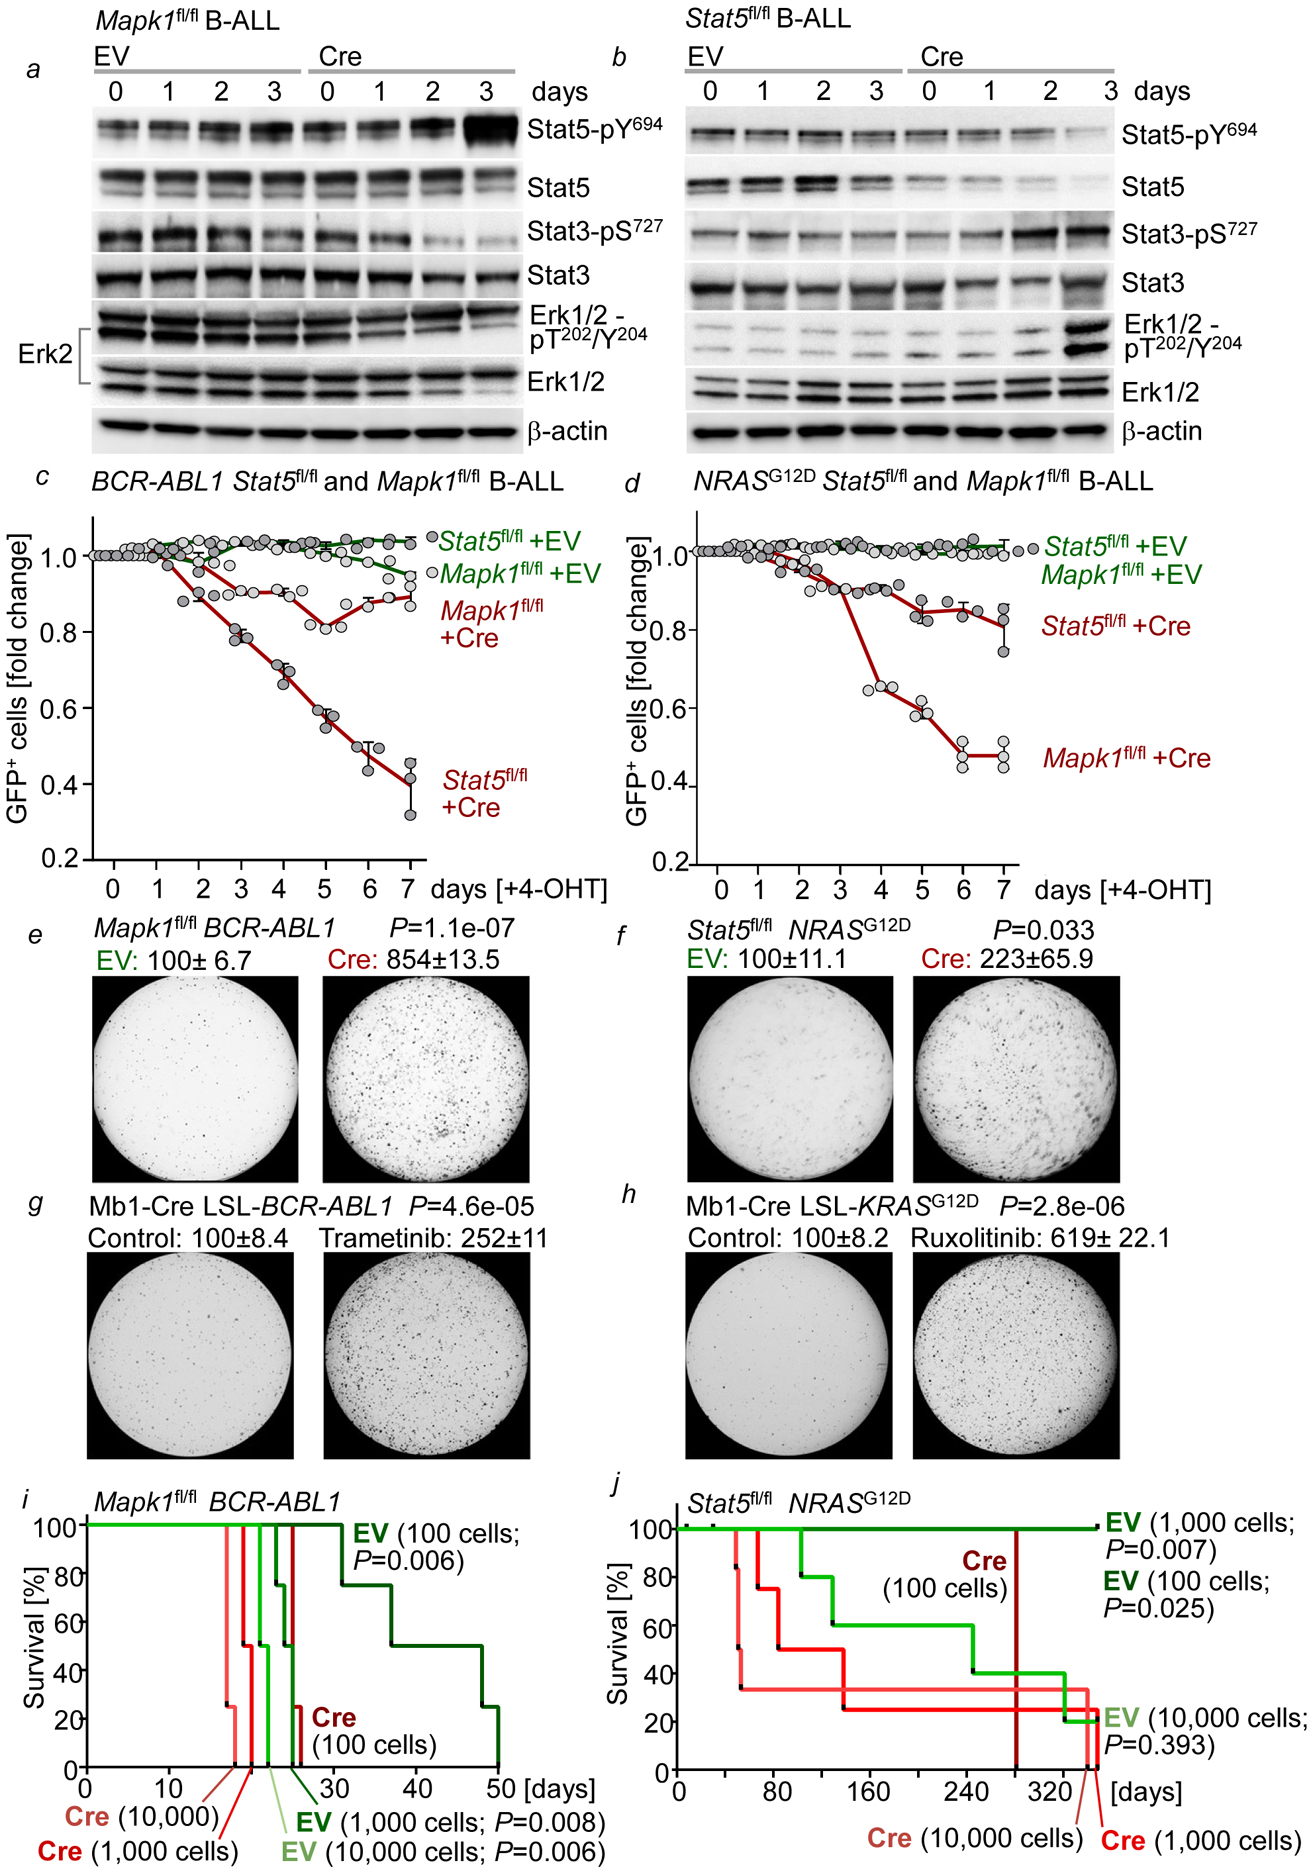
Malignant transformation of cells typically involves several genetic lesions, whose combined activity gives rise to cancer1. Here we analyse 1,148 patient-derived B-cell leukaemia (B-ALL) samples, and find that individual mutations do not promote leukaemogenesis unless they converge on one single oncogenic pathway that is characteristic of the differentiation stage of transformed B cells. Mutations that are not aligned with this central oncogenic driver activate divergent pathways and subvert transformation. Oncogenic lesions in B-ALL frequently mimic signalling through cytokine receptors at the pro-B-cell stage (via activation of the signal-transduction protein STAT5)2-4 or pre-B-cell receptors in more mature cells (via activation of the protein kinase ERK)5-8. STAT5- and ERK-activating lesions are found frequently, but occur together in only around 3% of cases (P = 2.2 × 10⁻¹⁶). Single-cell mutation and phospho-protein analyses reveal the segregation of oncogenic STAT5 and ERK activation to competing clones. STAT5 and ERK engage opposing biochemical and transcriptional programs that are orchestrated by the transcription factors MYC and BCL6, respectively. Genetic reactivation of the divergent (suppressed) pathway comes at the expense of the principal oncogenic driver and reverses transformation. Conversely, deletion of divergent pathway components accelerates leukaemogenesis. Thus, persistence of divergent signalling pathways represents a powerful barrier to transformation, while convergence on one principal driver defines a central event in leukaemia initiation. Pharmacological reactivation of suppressed divergent circuits synergizes strongly with inhibition of the principal oncogenic driver. Hence, reactivation of divergent pathways can be leveraged as a previously unrecognized strategy to enhance treatment responses.


Conflict of interest statement

Declaration of Interests

The authors have no competing interests.

Figures

Extended Data Figure 1.
Extended Data Figure 1.. Segregation of STAT5- and ERK-activating mutations in human ALL and AML
a-e, STAT5- and ERK-pathway mutations were studied in 1,148 patient-derived B-ALL samples (Supplementary Table 1). Null hypothesis is that STAT5- and ERK-pathway mutations occur independently of each other. The expected co-occurrence of mutations in both pathways under the null hypothesis was 121. The observed co-occurrence of the two mutations was 35, significantly lower than the expected (a; OR=0.13; P=2.2e-16, Fisher’s exact test). b, To analyze gene-gene co-occurrence in a more unsupervised manner, Fisher’s test was run for each gene-pair and plotted as a co-occurrence network – pathway assignment for each gene is indicated by node color (white = STAT5, grey = ERK), and mutation frequency by node size. Direction of Fisher’s result is indicated by line color (green = positive/greater than expected, red = negative/less than expected), line width represents strength of association (–log10 p-value * |logOR|). OR: odds ratio. c, Volcano plot of gene-gene co-occurrence results. Each point represents a gene-pair, colored by pathway assignment for the pair (green = both STAT5, red = both ERK, gray = inter-pathway), selected gene pairs are labeled. Overall difference in co-occurrence between pathways was tested by two complementary methods: d, Firstly, Fishers test was run over 10,000 permutations with random shuffling of gene-pathway assignments on each iteration to generate a null distribution for the hypothesis that pathway does not affect co-occurrence, and compared against the observed value from ALL patient data. e, Secondly, overall shifts in the distribution of logORs between pathways for Fisher’s results on individual gene-pairs were tested by Welch’s two-sample t-test (left panel; two-sided, P=0.001), and one-way ANOVA (right panel; P=0.0004) with Tukey HSD post-test (P=0.0003 and P=0.16). Low frequency, non-significant gene-pairs were excluded to avoid extreme odds ratios from biasing results. f-j, The same analyses were carried out on 916 patient-derived AML samples (Supplementary Table 2). Expected co-occurrence of mutations in both pathways under the null hypothesis was 34, observed co-occurrence was 24, significantly lower than the expected (f; OR=0.59, P=0.033, Fisher’s exact test). j, Welch two sample t-test (left panel; two-sided, P=0.82), one-way ANOVA (right panel; P=0.57).
Extended Data Figure 2.
Extended Data Figure 2.. Single-cell phosphoprotein analyses of patient-derived B-ALL samples reveal segregation of STAT5- and ERK-phosphorylation to competing clones.
a-e, For single-cell phosphoprotein analyses, scWest chips were used to capture individual cells and perform size-based protein separation. Each chip includes 16 arrays of 400-well blocks (6,400) on a polyacrylamide gel. Single-cell suspensions of patient-derived B-ALL cells were loaded onto the scWest chip and inserted into Milo (ProteinSimple) for cell lysis, size-based protein separation and UV capture to immobilize protein bands. Representative scanned image of the scWest chip probed with Histone H3 antibodies to confirm cell occupancy, followed by fluorescent secondary antibodies (a; n=16 independent biological samples). Chips were probed with STAT5-pY694 and ERK-pT202/Y204 antibodies followed by fluorescent secondary antibodies for simultaneous detection of both phosphoproteins. Shown are representative images of signals observed for STAT5-pY694 and ERK-pT202/Y204. Fluorescence intensity was plotted against distance from well center (peak location, μm). In addition to histone H3, chips were stained for DNA using TOTO-1 dye to verify cell occupancy. Each signal was inspected to confirm it was associated with a peak located at the correct distance from the well center (b,c; n=16 independent biological samples, each in triplicate). Chip was scanned using a microarray scanner, and peak identification was performed using the Scout Software (ProteinSimple). For single-cell Western analyses, optimal cell loading is achieved when 2% or fewer wells contain multiple cells (https://www.proteinsimple.com/milo.html). d,e, Single-cell phosphoprotein analyses for STAT5-pY694 and ERK-pT202/Y204 were performed for patient-derived B-ALL samples (6 independent biological samples, each in triplicate) with STAT5-pY694 and ERK-pT202/Y204 antibodies for simultaneous detection of both STAT5- and ERK-phosphorylation. scWest chips were then probed for histone H3 and TOTO-1 (DNA stain) to verify cell occupancy. Scout Software (ProteinSimple) was used for peak identification and data analysis. Each data point was inspected to confirm the signal detected was associated with a peak located at the correct peak location (distance from the well center). Shown in (d) are heatmaps illustrating cells that express STAT5-pY694 (green) and/or ERK-pT202/Y204 (red). Shown in (e) are tables that summarize the number of cells expressing neither STAT5-pY694 nor ERK-pT202/Y204 and the number of cells expressing either STAT5-pY694 or ERK-pT202/Y204, or in rare cases, both. For single-cell Western analyses, optimal cell loading is achieved when 2% or fewer wells contain multiple cells.
Extended Data Figure 3.
Extended Data Figure 3.. Phenotypic differences between B-ALL cells driven by oncogenic STAT5 or ERK reflect developmental rewiring during early B-cell development
a-g, Eight different B-ALL PDX samples (Supplementary Table 5) were analyzed by flow cytometry for CRLF2 (a), VpreB (b), CD21 (c), IgM (d), Ig-κλ (e), CD34 (f) and IgM (g) surface expression. Normal CD19+ B-cell precursors from a normal bone marrow sample and mature B-cells from a normal peripheral blood sample, as well a mature B-cell lymphoma cell lines were used as reference. Representative FACS plots from 3 independent experiments.
Extended Data Figure 4.
Extended Data Figure 4.. Phenotypic differences between B-ALL cells driven by oncogenic STAT5 or ERK reflect developmental rewiring during early B-cell development
a, Murine B-cell precursors, Stat5-driven B-ALL cells, BCR-ABL1-driven B-ALL cells and NRAS-driven B-ALL cells were analyzed by flow cytometry for CD43, IL7R, VpreB, IgM, Ig-κ, IgD and CD21 surface expression. Normal CD19+ B-cell precursors from bone marrow cells and CD19+ spleen B-cells from wild-type mice were used as reference. Shown are representative FACS plots from 3 independent biological replicates. b, For STAT5-driven B-ALL cases (n=26) and ERK-driven B-ALL cases (n=67), mRNA levels of IGHM, IGLV, BCL6 and IKZF1 were studied from microarray results and associated with clinical outcome (COG P9906) at the time of diagnosis. Patients in each group were segregated into two based on higher vs lower than median mRNA levels for each of the four genes. Overall survival and relapse-free survival for the Kaplan-Meier plots are shown to compare relapse-free or overall survival for the higher- vs lower than median groups for IGHM, IGLV, BCL6 and IKZF1 as potential outcome predictors. Mantel-Cox log-rank test (two-sided) was used to determine statistical significance.
Extended Data Figure 5.
Extended Data Figure 5.. Concurrent activation of STAT5 and ERK signaling induces B-cell senescence and cell death
a, Levels of NRASG12D, phospho-Stat5-Y694, Stat5, phospho-Stat3-S727, Stat3, phospho-Erk1/2-T202/Y204 and Erk upon Dox-induced expression of NRASG12D or Stat5aCA (n=3 independent experiments). b,c, IL7-dependent mouse pro-B cells (b) or pre-B cells (d) were transduced with EV control, BCR-ABL1-GFP or LMP2A-GFP. Changes of proportions of GFP+ cells were monitored by flow cytometry (n=3 independent experiments, mean ± s.d.). d,e, Annexin V-7AAD and senescence β-galactosidase staining were performed with pro-B cells (d) and pre-B (e) expressing EV, LMP2A or BCR-ABL1 as indicated. Levels of p16 and p21 were examined. (n=3 independent experiments). Shown are representative FACS plots and images from 3 independent experiments. P-values were determined by two-tailed t-test. Quantification for senescence β-galactosidase staining: mean of % cells positive for staining ± s.d. f, Like in normal B cell development, B-ALL subtypes can be traced to specific differentiation stages with distinct requirements for survival and proliferation signals. For instance, pro-B cells depend on cytokine receptor signaling and activation of STAT5 but not ERK. Conversely, pre-B cells depend on pre-BCR signaling and activation of ERK but not STAT5. STAT5-driven B-ALL cells depend on oncogenic mimics of cytokine receptor signaling and resemble pro-B cells that depend on STAT5-activation downstream of cytokine receptors. Mimicking pre-BCR signaling at the pro-B to pre-B cell-transition, oncogenic RAS-signaling suppresses STAT5-signaling and induces de novo expression of BCL6. For gel source data, see Supplementary Fig. 1.
Extended Data Figure 6.
Extended Data Figure 6.. Pharmacological inhibition of divergent pathways facilitates B-leukemogenesis
a, IL7-dependent pro-B cells were retrovirally transduced with EV-GFP, BCR-ABL1-GFP (BA-GFP), EV-Orange, or NRASG12D-Orange (NRAS-Orange). One week later, BA-GFP B-ALL cells were transduced with NRAS-Orange for concurrent activation of Erk and NRAS-Orange B-ALL cells were transduced with BA-GFP for concurrent activation of Stat5. The ability of oncogenic Stat5 (GFP+) and Erk (Orange+) signaling to contribute to the dominant clone was monitored by flow cytometry over time. Flow cytometry was performed to monitor the proportions of GFP+, Orange+, and double-positive cells at various time points following transductions. Representative FACS plots from 3 independent biological replicates. b, Cells from (a) were sorted for double-positive (GFP+ and Orange+) populations, and 10, 000 cells were seeded in methylcellulose for colony formation assays (10 days, n=3 independent biological replicates; mean ± s.d.). P=0.003 (left panel) and P=0.007 (right panel; two-tailed t-test). c-e, Patient-derived BCR-ABL1 B-ALL cells (MXP2) expressing Tet-on NRASG12D and patient-derived KRASG12V B-ALL cells (LAX7R) expressing Tet-On BCR-ABL1 were induced with Dox. Viable cell counts (c) were measured upon induction with doxycycline (Dox). Annexin V/7AAD and senescence β-galactosidase (d,e) staining were performed. Levels of p16 and p21 were also assessed (n=3 independent experiments). Shown are representative FACS plots and images from 3 independent experiments. P-values were determined by two-tailed t-test. Quantification for senescence β-galactosidase staining: mean of % cells positive for staining ± s.d. f, Murine wild-type BCR-ABL1 B-ALL cells were primed with vehicle control, DPH (1 μM), trametinib (1 nM) or DPH in combination with trametinib for 10 days prior to colony forming assays (n=3 independent biological replicates, mean ± s.d.) g, Murine wild-type NRASG12D B-ALL cells cultured in the presence of IL7 were primed with vehicle control, BCI-215 (0.5 μM), ruxolitinib (10 nM), or BCI-215 in combination with ruxolitinib for 10 days prior to colony forming assays (n=3 independent biological replicates, mean ± s.d.). P-values were determined by two-tailed t-test (f,g). For gel source data, see Supplementary Fig. 1.
Extended Data Figure 7.
Extended Data Figure 7.. Central role of PTPN6 in enabling oncogenic ERK-signaling
a, Levels of NRAS, Ptpn6-pY564, Ptpn6, Erk1/2-pT202/Y204 and Erk1/2 were assessed by Western blotting following Dox-induced expression of NRASG12D in murine pre-B cells (n=3 independent experiments). b, ChIP-seq analyses in human B lymphocytes (GM12878) obtained from the Encyclopedia of DNA Elements (ENCODE) revealed binding of ERK-dependent transcription factors ELK1, CREB1, c-JUN and JUNB to the PTPN6 locus. c, Patient-derived B-ALL cells (PDX2) were treated with BCI-215 (1 μmol/l). Levels of phospho-STAT5-Y694, STAT5, phospho-ERK1/2-T202/Y204 and ERK1/2 were measured by Western blotting upon treatment with BCI for various time points (n=3 independent experiments). d, Patient-derived B-ALL cells (PDX2) were treated with BCI-215 (1 μmol/l). Levels of phospho-STAT5-Y694, STAT5, phospho-Ptpn6-Y564 and Ptpn6 were measured by Western blotting upon treatment with BCI for various time points (n=3 independent experiments). e, Ptpn6fl/fl B-cell precursors were transduced with 4-OHT-inducible Cre or EV. Levels of Stat5-pY694, Stat5, Erk1/2-pT202/Y204, Erk1/2 and Ptpn6 were measured at various time points following induction (n=3 independent experiments). f, Ptpn6fl/fl B-cell precursors expressing NRASG12D were transduced with GFP-tagged, 4-OHT-inducible Cre or EV. Following induction with 4-OHT, enrichment or depletion of GFP+ cells was monitored by flow cytometry. Shown are average relative changes (mean ± s.d.) of GFP+ cells following induction and representative FACS plots (n=6 independent biological replicates). g, Quantification (n=3 independent experiments, mean ± s.d.) and representative images from serial replating assays of pre-B cells transduced with NRASG12D following Cre-mediated deletion of Ptpn6. 10, 000 cells were seeded in semi-solid methylcellulose and monitored for colony formation for 14 days. P-values were determined by two tailed t-test. For gel source data, see Supplementary Fig. 1.
Extended Data Figure 8.
Extended Data Figure 8.. BLNK enables oncogenic ERK signaling at the expense of STAT5-MYC
a, Blnk+/+ and Blnk−/− B-cell precursors expressing Dox-inducible Ig-HC were treated with Dox for 48 hr. Levels of phospho-Erk1/2-T202/Y204, Erk1/2, Ptpn6-pY564, Ptpn6, Stat5-pY694, Stat5, Myc, Bcl6 and Blnk were measured by Western blotting (n=3 independent experiments). b, Blnk+/+ and Blnk−/− B-cell precursors expressing Dox-inducible NRASG12D were treated with Dox for 48 hr. Levels of NRAS, phospho-Erk1/2-T202/Y204, Erk1/2, phospho-Ptpn6-Y564, Ptpn6, phospho-Stat5-Y694, Stat5, Myc, Bcl6 and Blnk were measured by Western blotting (n=3 independent experiments). c-f, Viable cell counts (c,d) and viability changes (e,f) were measured upon doxycycline (Dox)-induced expression of Stat5aCA or of NRASG12D in Blnk+/+ and Blnk−/− B-cell precursors at various time points (n=3 independent experiments; mean ± s.d.). g,h, Colony forming ability of Blnk+/+ and Blnk−/− B-cell precursors was assessed upon Dox-induced expression of Stat5aCA (g) or NRASG12D (h). 10,000 cells were plated, shown are mean ± s.d. values of 3 independent experiments and representative images. P-values were determined by two tailed t-test. For gel source data, see Supplementary Fig. 1.
Extended Data Figure 9.
Extended Data Figure 9.. Divergent drug-responses in a STAT5- and ERK-driven pair of primary and relapse B-ALL
a-d, Electroporation of Cas9 ribonucleoproteins (RNPs), complexes of recombinant Cas9 with non-targeting (NT) guide RNAs or guide RNAs targeting BLNK, was performed to transfect a matched B-ALL pair from the same patient: LAX7 (at diagnosis; STAT5-driven, IL7RSI246S) and LAX7R (relapsed; ERK-driven, KRASG12V). Levels of ERK1/2-pT202/Y204, ERK1/2, STAT5-pY694 and STAT5 in patient-derived B-ALL cells (IL7RSI246S LAX7, at diagnosis; KRASG12V LAX7R, relapsed) were examined by Western blotting (b, n=3 independent experiments, shown are two of the technical replicates from an independent experiment). Efficiency of CRISPR/Cas9-mediated deletion of BLNK was assessed by Western blot (c). LAX7 and LAX7R cells transfected with Cas9/RNPs carrying NT or BLNK guide RNAs were mixed with GFP+ LAX7 and GFP+ LAX7R competitor cells, respectively. Enrichment or depletion of GFP+ cells was monitored by flow cytometry (n=3 independent experiments; a,d). Data, mean ± s.d. (note the direction of the y-axis is reverse, starting from fold change of 2.5, bottom). e, Western blotting analyses were performed to assess levels of STAT5-pY694, STAT5, STAT3-pS727, STAT3, ERK-pT202/Y204 and ERK upon treatment of LAX7 cells with ruxolitinib (left) or LAX7R cells with trametinib (right), n=3 independent experiments. f, Patient-derived B-ALL cells (LAX7 and LAX7R) were treated with increasing concentrations of ruxolitinib or trametinib for 72 hours. Relative viability (n=3; mean ± s.d.) was measured. For gel source data, see Supplementary Fig. 1.
Extended Data Figure 10.
Extended Data Figure 10.. Pharmacological reactivation of suppressed divergent pathways as therapeutic strategy in B-ALL
a,h, Patient-derived B-ALL cells (STAT5-driven) LAX7 (a) and JFK125R (h) were treated with vehicle control, BCI-215 (1 μM), ruxolitinib (500 nM), or a combination of BCI-215 and ruxolitinib. Western blotting was performed to measure levels of phospho-STAT5-Y694, STAT5, phospho-ERK1/2-T202/Y204 and ERK1/2 (n=3 independent experiments). b, Patient-derived B-ALL cells (ERK-driven, LAX7R) were treated with vehicle control, DPH (1 μM), trametinib (500 nM), or a combination of DPH and trametinib. Levels of phospho-STAT5-Y694, STAT5, phospho-ERK1/2-T202/Y204 and ERK1/2 were assessed (n=3 independent experiment). c,i, Patient-derived B-ALL cells, LAX7 and LAX7R (c) and JFK125R (i), were treated with increasing concentrations of BCI-215, ruxolitinib, a combination of both, DPH, trametinib, or a combination of both. Percentage growth inhibition at each concentration is shown as heatmaps (n=3 independent experiments). CI values were calculated to determine synergy for treatment combinations. DPH and trametinib concentrations used for both LAX7, LAX7R and JFK125R: (DPH, uM: 0, 0.16, 0.31, 0.63,1.3, 2.5, 5; trametinib, uM: 0, 0.032, 0.063, 0.13, 0.25, 0.5, 1). Ruxolitinib and BCI-215 concentrations used for LAX7: (Ruxo, uM: 0, 0.125, 0.25, 0.5, 1, 2; BCI-215, uM: 0, 0.04, 0.08, 0.16, 0.31, 0.63). Ruxolitinib and BCI-215 concentrations used for LAX7R and JFK125R: (Ruxo, uM: 0, 0.063, 0.125, 0.25, 0.5, 1, 2; BCI-215, uM, 0, 0.02, 0.04, 0.08, 0.16, 0.31, 0.63). d,j, Single-cell phosphoprotein analyses for phospho-STAT5-Y694 and phospho-ERK-T202/Y204 were performed for patient-derived B-ALL cells LAX7, LAX7R (d) and JFK125R (j) prior to in vivo treatment (n=3 independent experiments). e,k, Patient-derived LAX7R (e) or JFK125R (k) B-ALL cells were injected into sublethally irradiated (2Gy) NSG mice. Recipient mice injected with LAX7R were treated 6 times a week for 4 weeks with 2 mg/kg DPH, 0.5 mg/kg trametinib or a combination of both (e). Recipient mice injected with JFK125R were treated 5 times a week for 4 weeks with 2 mg/kg BCI-215, 30 mg/kg ruxolitinib or a combination of both (k). Mice were euthanized when they showed signs of overt leukemia (hunched back, weight loss and inability to move). Survival curves are shown (n=6 per group). To assess additive vs synergistic activity of single vs combination treatments in vivo, the Bliss independence model was adapted to survival analysis. With this approach, treatments are Bliss “independent” if the fraction of cells surviving combination therapy equals the product of fractions that survive the individual treatments. A Weibull distribution {exp[−(t/β)α]} was fitted to survival data for each condition, and distributions of survival benefits (treated survival time − untreated survival time) were computed for each treatment. Survival benefits of drug-1 and drug-2 were summed and added to the untreated survival distribution to compose a “sum of benefits” survival distribution (see Methods for details). f,g, l, and m, While combination treatments prolonged overall survival, transplant recipient mice ultimately developed overt leukemia. B-ALL that developed in mice bearing LAX7R (after treatment with DPH-trametinib; e) and JFK125R (after treatment with BCI-215-ruxolitinib; k) were isolated from bone marrow, suspended in cell culture medium and treated with increasing concentrations of BCI-215, ruxolitinib, a combination of both, DPH, trametinib, or a combination of both. Percentage growth inhibition at each concentration is shown as heatmaps (f, l, n=3 independent experiments). CI values were calculated to determine synergy for treatment combinations. To elucidate the clonal composition of LAX7R B-ALL post-treatment (e) and that of JFK125R post-treatment (k), single-cell phosphoprotein analyses for phospho-STAT5-Y694 and phospho-ERK-T202/Y204 were performed (g,m, n=3 independent experiments). For gel source data, see Supplementary Fig. 1.
Figure 1:
Figure 1:. Segregation of STAT5- and ERK-activation in human B-ALL
a, Correlation between ERK-pT202/Y204 and STAT5-pY694 levels in B-ALL cells (n=23 independent biological samples; P=0.001, two-tailed t-test; r=−0.657, Pearson r). b, Western blots of patient-derived B-ALL cells (n=8, left), Ph+ B-ALL cells before (n=8, middle) and after ponatinib treatment (n=8, right). c, Single-cell phosphoprotein analysis of patient-derived B-ALL samples (n=3 independent experiments). d, Patient-derived Ph+ B-ALL cells treated with trametinib or ponatinib. Growth inhibition (%) shown (means of 3 independent experiments). For gel source data, see Supplementary Fig. 1.
Figure 2:
Figure 2:. STAT5-MYC and ERK-BCL6 signaling are incompatible and define distinct stages of B cell development
a, Hardy Fractions B-F analysis of MyceGFP/+ Bcl6mCherry/+ bone marrow cells. Single-cell phosphoprotein analyses of the indicated fractions. b, Surface expression of eGFP and mCherry on MyceGFP/+ Bcl6mCherry/+ bone marrow cells in Hardy Fractions B-F. c, Surface expression of Igκλ light chain (LC) on IL7-dependent pro-B cells (left), and upon Dox-inducible expression of μHC (middle) or NRASG12D (right). d, Surface expression of eGFP and mCherry on IL7-dependent MyceGFP/+ Bcl6mCherry/+ B-cell precursors induced to differentiate or transduced with NRASG12D. e, Western blots of Ph-like B-ALL cells treated with ruxolitinib (n=3 independent experiments). f, Surface expression of eGFP and mCherry on MyceGFP/+ Bcl6mCherry/+ B-cell precursors transduced with EV, BCR-ABL1 or NRASG12D, and subsequently treated with vehicle control, imatinib (1 μM) or trametinib (10 nM). g,h, Enrichment or depletion of GFP+ BCR-ABL1 or NRASG12D B-ALL cells transduced with EV, GFP-MYC or GFP-BCL6 (mean, ±s.d; g,h). Data from 3 independent biological replicates (a-d,f). e-h, n=3 independent experiments. For gel source data, see Supplementary Fig. 1.
Figure 3:
Figure 3:. Concurrent oncogenic STAT5- and ERK-activation subverts B-cell leukemogenesis
a, Western blotting following Dox-induced expression of Stat5aCA or NRASG12D in IL7-dependent mouse pro-B cells. b, FACS plots and Western blots of hIL2Rβ-TetO-NRASG12D mouse pro-B cells following the indicated treatments (Dox, 24 hr; hIL2, 15 min., 50 ng/μL). c,d, Colony formation (c, P=1.9E-05, two-tailed t-test) and viable cell counts (d, mean, ±s.d.) of hIL2Rβ-TetO-NRASG12D mouse pro-B cells treated with Dox, hIL2 (10 ng/μL), or a combination of both. Data from 3 independent experiments (a-d). For gel source data, see Supplementary Fig. 1.
Figure 4:
Figure 4:. Genetic deletion of alternative pathways triggers STAT5- and ERK-driven leukemia-initiation
a, Western blots of BCR-ABL1-B-ALL cells upon Cre-mediated ablation of Mapk1 (Erk2). b, Western blots of NRASG12D B-ALL cells upon Cre-mediated deletion of Stat5. c,d, Enrichment or depletion of GFP+ Stat5fl/fl or Mapk1fl/fl BCR-ABL1 (c) or NRASG12D (d) B-ALL cells transduced with ERT2-GFP or Cre-ERT2-GFP. e,f, Colony formation (% control) of Mapk1fl/fl BCR-ABL1 B-ALL cells (e) and Stat5fl/fl NRASG12D-B-ALL cells (f) upon deletion of Mapk1 or Stat5, respectively. g,h, Colony formation (% control) of Mb1-Cre x LSL-BCR-ABL1 (g) and Mb1-Cre x LSL-KRASG12D (h) pro-B cells primed with trametinib (1 nmol/L, 10 days, g) and ruxolitinib (10 nmol/L, 10 days, h). i,j, Kaplan-Meier analyses (Mantel-Cox log-rank test) of recipient mice (n=4 per group) bearing BCR-ABL1- (i) or NRASG12D-driven (i) B-ALL cells with or without deletion of Mapk1 (i; 24 hr) or Stat5 (j; 24 hr). Data, mean ±s.d. (n=3 independent experiments a-h). Assessed by two-tailed t-test (c-h). For gel source data, see Supplementary Fig. 1.

References

    1. Fearon ER et al. Clonal analysis of human colorectal tumors. Science 238, 193–197 (1987) - PubMed
    1. Goetz C et al. STAT5 activation underlies IL7 receptor-dependent B cell development. J. Immunol 172, 4770–4778 (2004) - PubMed
    1. Malin S et al. Role of STAT5 in controlling cell survival and immunoglobulin gene recombination during pro-B cell development. Nat. Immunol 11, 171–179 (2010) - PMC - PubMed
    1. Katerndahl CDS et al. Antagonism of B cell enhancer networks by STAT5 drives leukemia and poor patient survival. Nat. Immunol 18, 694–704 (2017) - PMC - PubMed
    1. Shaw AC et al. Activated Ras signals developmental progression of recombinase-activating gene (RAG)-deficient pro-B lymphocytes. J. Exp. Med 189, 123–129 (1999) - PMC - PubMed

Publication types

MeSH terms

Substances