. 2020 Jul;583(7818):852-857.
doi: 10.1038/s41586-020-2533-0. Epub 2020 Jul 22.

Histone H3.3 phosphorylation amplifies stimulation-induced transcription

Affiliations

Histone H3.3 phosphorylation amplifies stimulation-induced transcription

Anja Armache et al. Nature. 2020 Jul.

Abstract

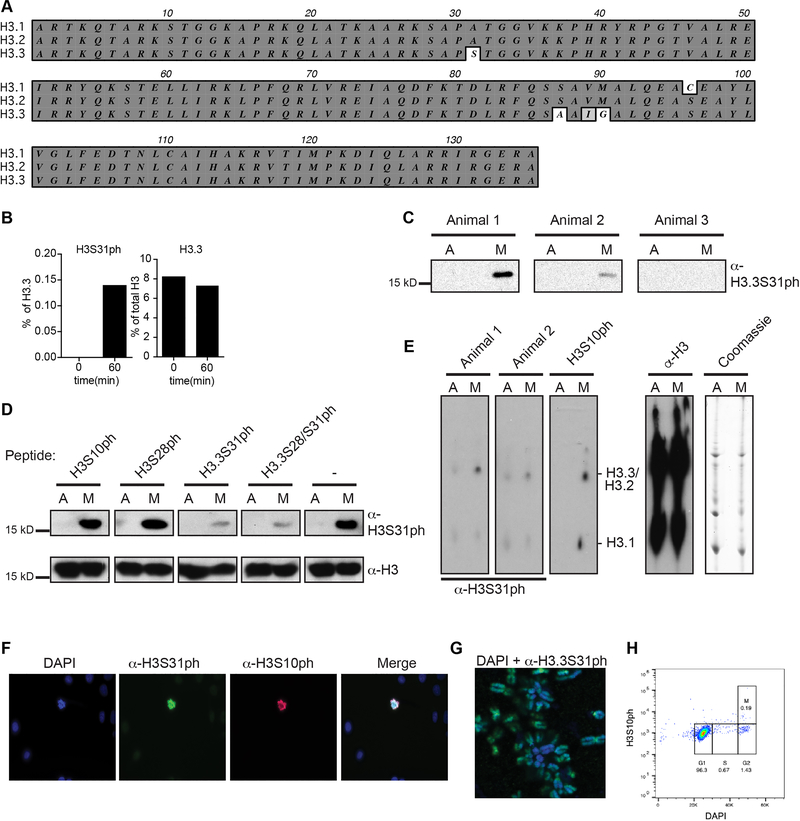
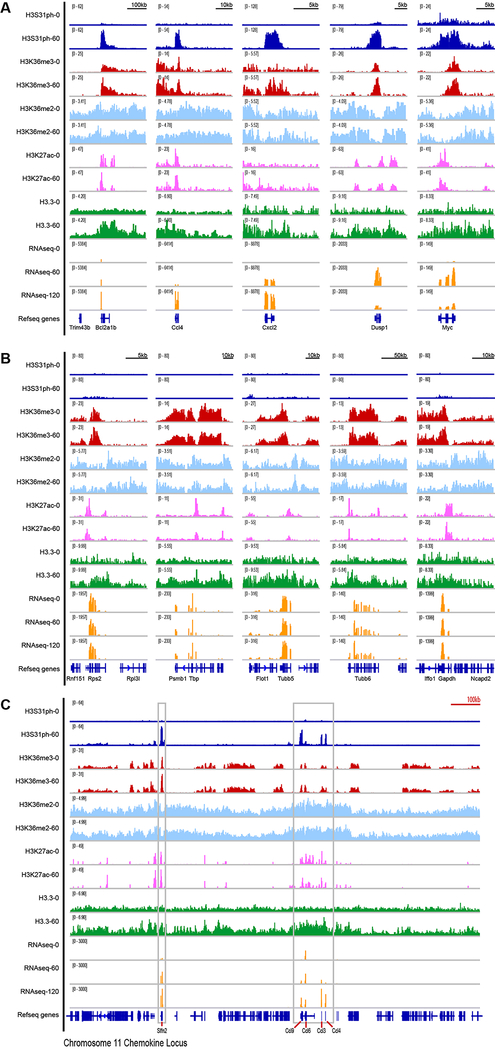
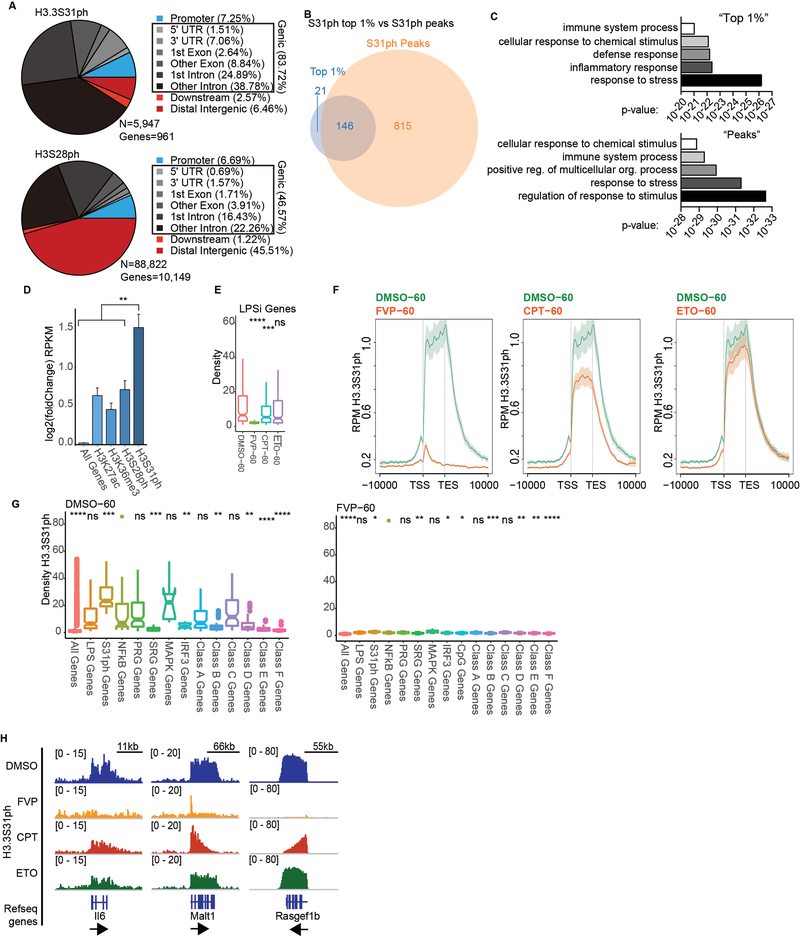
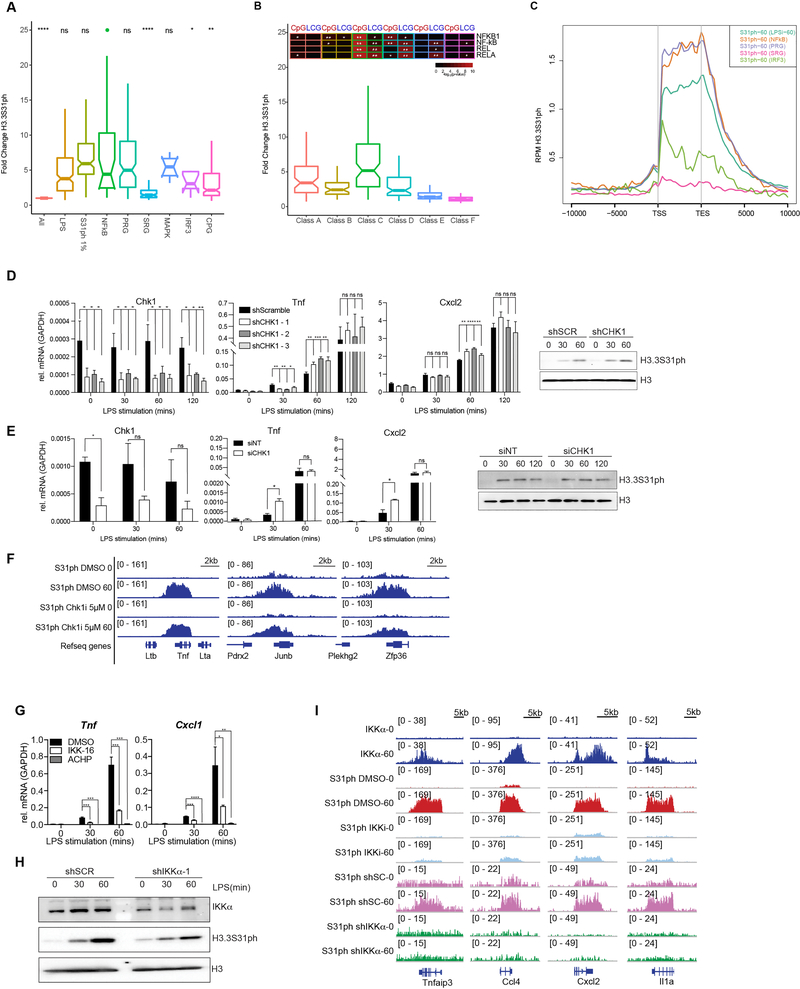
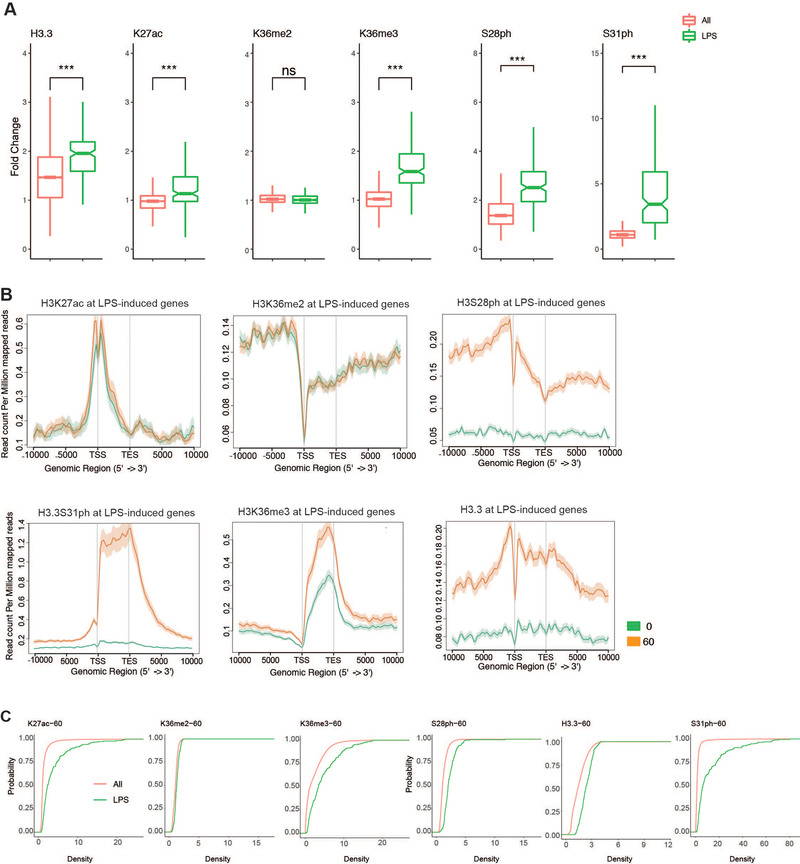
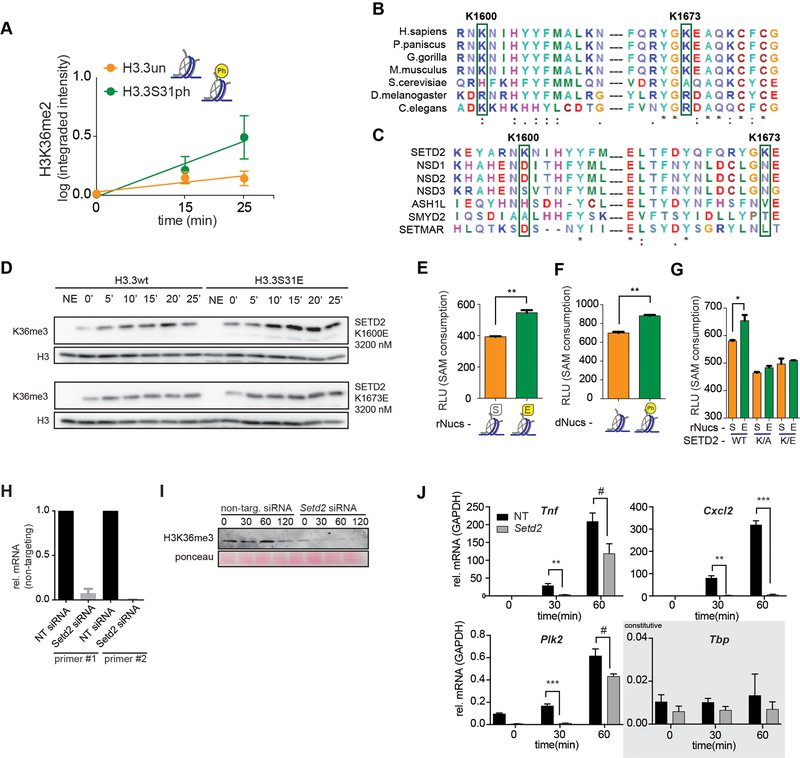
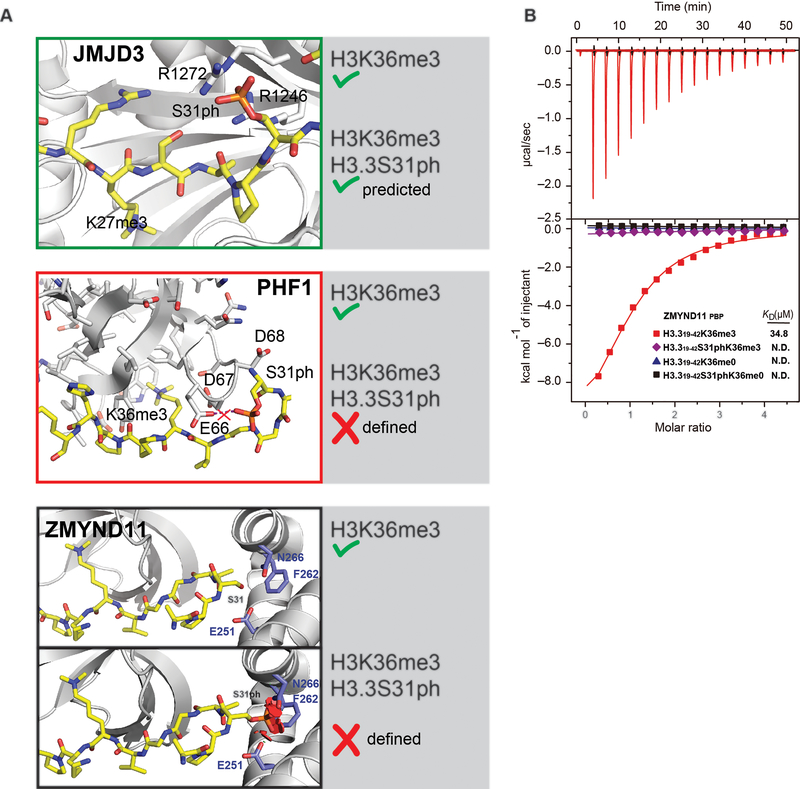
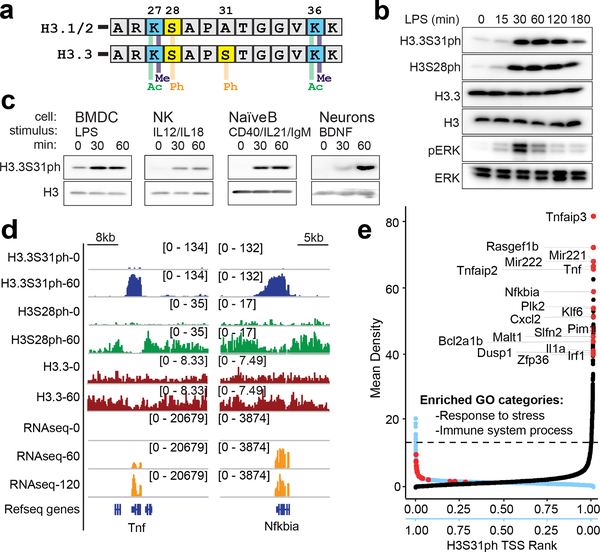
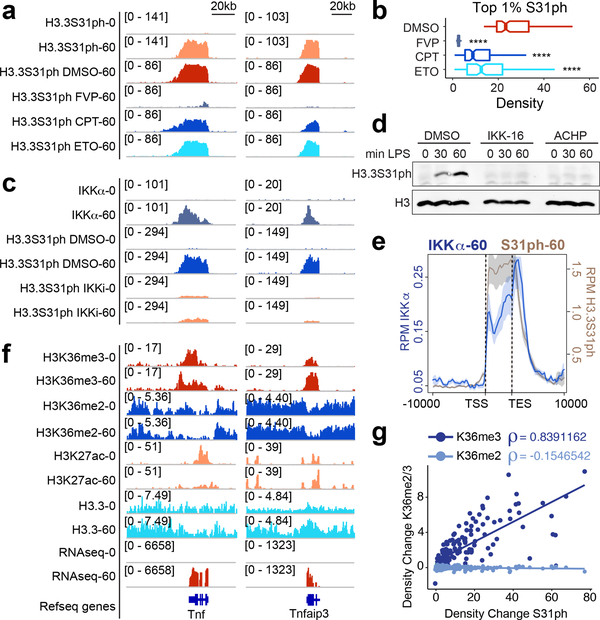
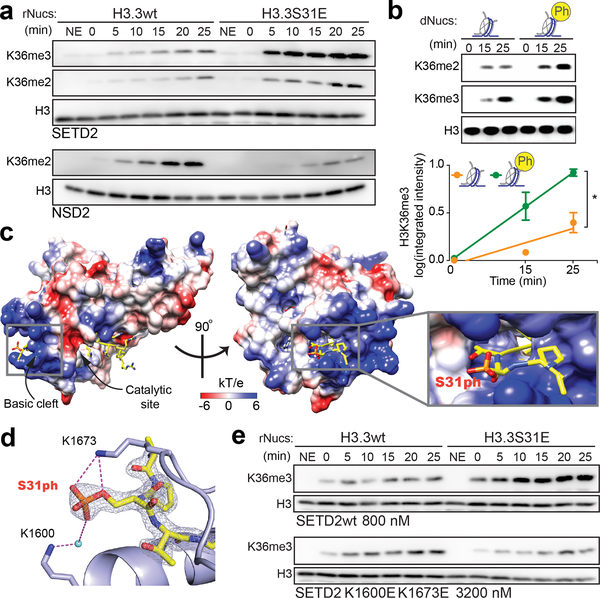
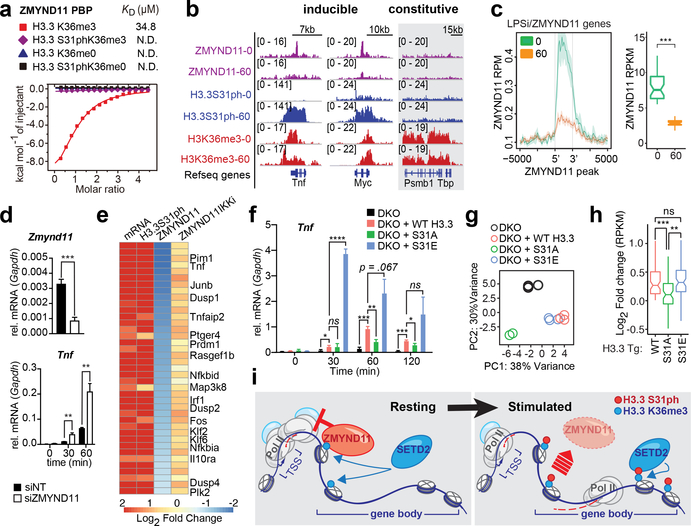
Complex organisms can rapidly induce select genes in response to diverse environmental cues. This regulation occurs in the context of large genomes condensed by histone proteins into chromatin. The sensing of pathogens by macrophages engages conserved signalling pathways and transcription factors to coordinate the induction of inflammatory genes1-3. Enriched integration of histone H3.3, the ancestral histone H3 variant, is a general feature of dynamically regulated chromatin and transcription4-7. However, how chromatin is regulated at induced genes, and what features of H3.3 might enable rapid and high-level transcription, are unknown. The amino terminus of H3.3 contains a unique serine residue (Ser31) that is absent in 'canonical' H3.1 and H3.2. Here we show that this residue, H3.3S31, is phosphorylated (H3.3S31ph) in a stimulation-dependent manner along rapidly induced genes in mouse macrophages. This selective mark of stimulation-responsive genes directly engages the histone methyltransferase SETD2, a component of the active transcription machinery, and 'ejects' the elongation corepressor ZMYND118,9. We propose that features of H3.3 at stimulation-induced genes, including H3.3S31ph, provide preferential access to the transcription apparatus. Our results indicate dedicated mechanisms that enable rapid transcription involving the histone variant H3.3, its phosphorylation, and both the recruitment and the ejection of chromatin regulators.


Conflict of interest statement

The authors declare no competing interests.

Figures

Extended Data Figure 1:
Extended Data Figure 1:. Determination of anti-H3.3S31ph antibody specificity.
(A) Alignment showing H3.1, H3.2 and H3.3 and the differing amino acids in core and tail. (B) Quantitative mass spectrometry analysis of phosphorylated H3.3 at Ser 31 (H3.3S31ph), left, and total H3.3 protein, right, in resting (0’) and bacterial lipopolysaccharide (LPS)-stimulated (60’) mouse bone marrow derived macrophages (BMDM). (C) Immunoblot with acid-extracted histones from asynchronous growing “A” or nocodazole-arrested mitotic “M” HeLa cells using bleeds from three rabbits immunized with H3.3S31ph peptides. Bleeds from animals 1 and 2 show a signal of the molecular weight of histone H3 only with mitotic samples. (D) Peptide competition experiment to determine antibody-specificity. Asynchronous “A” or mitotic “M” histones were separated by SDS-PAGE gels and blotted onto PVDF membranes. H3.3S31ph antibody from animal 1 was pre-incubated with diverse peptides or without any peptide, as indicated, before adding it to the PVDF membrane. Staining with anti-H3 antibody shows equal loading. (E) Immunoblot with acid-extracted histones from asynchronous “A” or mitotic “M” histones separated by 2D triton-acid urea (TAU) gels (left) that allow a separation of histone variants due to charge and amino acid differences. The bleed from animal 1 shows a signal of the size of H3.3. Coomassie blue staining of the gel and staining of the membrane with anti-H3 served as loading control (right). (F) Deconvolved immunofluorescence microscopy images of asynchronously growing HeLa cells co-stained with DAPI (DNA, blue), anti-H3.3S31ph (animal 1, green) and anti-H3S10ph (marker of mitotic cells, red). Merged picture is shown on the right. Note that only mitotic cells, as apparent from stronger DAPI-staining and apparent H3S10ph signal, are H3.3S31ph positive. (G) Deconvolved image of chromosome spread from mitotic HeLa cells co-stained with DAPI (blue) and anti-H3.3S31ph (animal 1, green). Notice the stronger staining of H3.3S31ph at peri-centromeric regions, as has been shown previously. (H) Cell cycle analysis of BMDM by FACS using DAPI and H3S10ph, with mitotic index gate shown, indicating post-mitotic nature of BMDM.
Extended Data Figure 2:
Extended Data Figure 2:. Histone peptide array-based specificity profiles for antibodies against H3.3S31ph, H3K36me2, and H3K36me3.
Scatter plots showing signal intensities obtained from each of the indicated antibodies on two separate peptide-arrays. Shown in certain graphs is the relative abundance of the indicated unmodified or modified histone species compared to any species of H3.3S31ph detected by quantitative mass spectrometry in bacterial lipopolysaccharide (LPS)-stimulated (60’) mouse bone marrow derived macrophages (BMDM). Both antibodies recognizing H3K36me and the H3.3S31ph antibody highlighted in green were used here.
Extended Data Figure 3:
Extended Data Figure 3:. H3.3S31ph is deposited in the gene-body of response genes but not constitutively expressed genes.
Additional examples of H3 PTMs including H3.3S31ph (as in Fig. 2) at (A) LPS-induced genes Bcl2a1b, Ccl4, Cxcl2, Dusp1, Myc; (B) constitutively expressed (“housekeeping”) genes Gapdh, Rps2, Tbp, Tubb5, Tubb6; (C) across the gene dense chromosome 11 chemokine locus (>1Mb) containing LPS-induced genes Slfn2, Ccl9, Ccl6, Ccl3, Ccl4.
Extended Data Figure 4:
Extended Data Figure 4:. H3.3S31ph requires transcription elongation.
(A) Comparative pie charts showing percentage of ChIPseq reads for H3.3S31ph (top) and H3S28ph (bottom) in the indicated genomic regions. We called H3.3S31ph peaks and find that they associated with only 961 genes with 83.72% of peaks falling within gene bodies. By comparison, the majority of H3S28ph peaks fall in promoters and intergenic regions. Given the selective gene body localization of H3.3S31ph, we ranked all annotated genes in the genome by H3.3S31ph ChIP signal density (TSS-TES) in resting and stimulated macrophages. This analysis shows that many more genes acquire high-density H3.3S31ph upon stimulation compared with resting cells (Fig. 1e), which is consistent with our MS and other global analysis of H3.3S31ph levels. Additionally, several of the top ranked genes (note, by density, not fold change) are prominent LPS-induced genes, including Tnfaip3 (A20), Tnf, Il1a, and Plk2 (Fig. 1e), all among the top ranked peaks (Supplementary Table 2). (B) We defined a threshold for the top 1% of genes (genome wide) by H3.3S31ph TSS-TES density in stimulated macrophages (167 genes) and find considerable overlap with genes annotated to H3.3S31ph peaks (961 genes). (C) Comparison of gene ontology (GO) analysis for “top 1%” genes and “peak” genes reveals extensive similarities of these two independent analyses with 3 of the top 5 GO categories shared and reflecting the stimulation-induced nature of genes featuring H3.3S31ph: “response to stress”, “immune system process”, “cellular response to chemical stimulus” (Supplementary Table 3). (D) We compared the H3.3S31ph chromatin state to other “active” chromatin states including H3K27ac, H3K36me3, and H3S28ph as they relate to stimulation-induced gene expression. Our analysis reveals that genes with H3.3S31ph are highly enriched for stimulation-induced genes by RNAseq, especially primary response genes, NF-κB targets, and MAPK-dependent genes (Fig. 1I, Extended Data Fig. 4–6) (from Tong et al. Cell 2016; Bhatt et al. Cell 2012). (E) H3.3S31ph ChIPseq read densities of (left) LPS-induced genes and (right) top 1% H3.3S31ph target genes in LPS-stimulated BMDM (60’) after pre-treatment with FVP, CPT and ETO compared to DMSO treatment. For comparison with Fig. 2b. (F) ChIPseq average profiles of H3.3S31ph in LPS-stimulated BMDM after pre-treatment with either DMSO, FVP, CPT, or ETO. (G) Box plots showing H3.3S31ph ChIPseq read densities in LPS-stimulated BMDM (60’) after pre-treatment with DMSO (left) and FVP (right). Comparisons are made between NF-κB target genes and LPS-induced genes, top 1% of H3.3S31ph targets, primary (PRG) and secondary (SRG) response genes, MAPK and IRF3 dependent genes and different sub-groups of PRG (Classes A-D) and of SRG (Classes E-F) (from Bhatt et al. Cell 2012). (H) ChIP-Seq tracks of H3.3S31ph in LPS-stimulated macrophages (60’) after pretreatment with FVP, CPT, and ETO. To complement Fig. 2a.
Extended Data Figure 5:
Extended Data Figure 5:. IKKα activity drives H3.3S31ph and is enriched at NF-κB target genes
(A) H3.3S31ph ChIPseq read density fold change (0 to 60) for different gene sets (from Bhatt et al. Cell 2012). (B) H3.3S31ph ChIPseq read density fold change (0 to 60) for genes sets defined by transcription kinetics (A, fastest/transient; F, slowest). Enrichment statistics for NF-κB associated motifs for CpG rich (CpG) and CpG low (LCG) genes from each category are shown above. (C) Average gene H3.3S31ph ChIPseq profiles of LPS-stimulated BMDM (60’) in the indicated gene categories (from Bhatt et al. Cell 2012). (D) RT-qPCR tracks for Chk1, Tnf, Cxcl2, and Western blot for H3.3S31ph in LPS stimulated mouse BMDM following transduction with shRNA scrambled control (shScramble) and three shRNAs targeting Chk1. (E) ChIPseq tracks of H3.3S31ph in LPS stimulated mouse BMDM following pre-treatment with DMSO and 5mM Chk1 inhibitor. (F) RT-qPCR tracks for Chk1, Tnf, Cxcl2, and Western blot for H3.3S31ph (top right) in LPS stimulated mouse BMDM following transfection with siRNA non-target control (siNT) and against Chk1 (siCHK1). (G) Western blot analysis of H3.3S31ph in resting and LPS-stimulated BMDM transduced with shRNA scrambled control (shSCR) and shRNA targeting IKKα (H) RT-qPCR for Tnf and Cxcl1 in resting and LPS-stimulated macrophages after pre-treatment with DMSO and the IKK inhibitors IKK-16 (1.5 μM) and ACHP (10 μM). (I) ChIPseq tracks of IKKα and H3.3S31ph in resting and LPS-stimulated BMDM for Tnfaip3, Ccl4, Cxcl2 and Il1a. H3.3S31ph ChIPs were obtained after BMDM pre-treatments with DMSO and the IKK inhibitor IKK-16 (1.5 μM) and after transduction with shRNA scrambled control (shSC) and shRNA against IKKα. *, p<0.05; **, p<0.005; ***, p<0.0005; ****, p<0.0001, Student’s t-test.
Extended Data Figure 6:
Extended Data Figure 6:. H3.3S31ph and other H3 PTMs at response genes and after stimulation.
(A) Additional examples (H3K27ac and H3S28ph) of ChIP-seq density fold change comparing the set of all genes (All) to RNAseq defined LPS-stimulated genes to RNAseq defined LPS-stimulated genes (LPS) as shown in Figure 3B for (H3.3, K36me2, K36me3, S31ph) (B) Average gene profiles (in addition to H3.3S31ph and H3K36me3 in Figure 3, shown here are H3K27ac H3K36me2, H3S28ph and H3.3) comparing RNAseq defined LPS-induced genes before and after stimulation. (C) Cumulative distribution function (CDF) plots for H3K27ac H3K36me2, H3K36me3, H3S28ph, H3.3 and H3.3S31ph reveal selective role of H3.3S31ph compared with ubiquitous role of H3K36me3. ***<0.0001 by Student’s t-test.
Extended Data Figure 7.
Extended Data Figure 7.. The H3K36me3 methyltransferase SETD2 is stimulated by H3.3S31ph.
(A) ChIP-seq density fold change comparing the set of all genes (All) to RNAseq defined LPS-stimulated genes (LPS) for H3.3S31ph (p=1.22e-96), H3.3 (p=1.63e-25), H3K36me2, and H3K36me3 (p=1.22e-85) by non-parametric Wilcoxon signed-rank test. All genes nall=16648; LPS genes nLPS=206. (B) Average gene profiles of H3.3S31ph (above) and H3K36me3 (below) comparing RNAseq defined LPS-induced genes before and after stimulation. (C) Quantitative measurements of 3 independent experiments (integrated fluorescence intensity) of SETD2 SET-domain HMT assays on unmodified and H3.3S31ph semi-synthetic designer nucleosomes (dNucs). Error bars in (C) represent the range of three independent experiments.) (D) Top, sequence alignment of SETD2 in different species, highlighting the conserved (except in S. cerevisiae) residues K1600 and K1673. (E) Bottom, sequence alignment of different H3K36 methyltransferases highlighting the specificity of residues K1600 and K1673 for SETD2. (F) Western blot analysis for H3K36me3 in HMT assays with SETD2 SET-domain K1600E, and K1673E mutants on H3.3wt and H3.3S31E rNucs. With reduced mutant enzyme activity, enzyme concentration was increased to best visualize the ratio of H3.3wt to H3.3S31E activity. (G-I) HMT activity assays (SAH accumulation) performed with wt (G/H) and K1600EK1673E double mutant (I) SETD2 SET-domain on H3.3wt and H3.3S31E recombinant nucleosomes (rNucs).. (G) SETD2 SET-domain HMT assays using designer nucleosomes (dNucs) containing unmodified H3.3 or H3.3 phosphorylated at S31. (J) Validation of siRNA knockdown for Setd2 using two RT-PCR primers, and (K) Western blot for H3K36me3 as a surrogate of Setd2 activity. *, p<0.05; **, p<0.01; ***, p<0.001; #, p=0.07, 0.06, for Tnf, Plk2, respectively, Student’s t-test. (L) RT-qPCR for the LPS-induced genes Tnf, Cxcl2, Plk2, and Tbp (constitutively expressed control) at 0, 30, 60’ after LPS stimulation of BMDM transfected (48h before) with siRNAs against SETD2 or non-targeting controls (NT).
Extended Data Figure 8:
Extended Data Figure 8:. Broad potential for H3.3S31ph to regulate histone reader activity.
(A) Modeling based predictions (KDM6B, from Jones et al. Biochemistry 2018) and modeled visualizations of established interaction features (PHF1, from Andrews et al. ACS Chemical Biology 2016; ZMYND11, from Wen et al. Nature 2014) of reader interactions dually modified H3.3S31phK36me3. Structure of ZMYND11 PWWP domain bound to H3.3K36me3 peptide and modeling of ZMYND11 PWWP domain with the H3.3S31ph peptide, adapted from Wen et al. Nature 2014. S31ph diameter is beyond PWWP pocket capacity and the steric clashes between H3.3S31ph and PWWP are shown as red plates. H3.3 peptide (yellow sticks), ZMYND11-PWWP (light grey), and residues of PWWP having steric clashes with H3.3S31 are shown as blue sticks (E251, F262 and N266). Another example of accommodation of H3.3S31ph may be jumonji family demethylase 3 (JMJD3, KDM6B), an H3K27me3 demethylase. Repressive H3K27me3 is abundant on H3.3 (Jung et al. Mol. Cell. Proteomics 2010) and has been shown to play a role in inflammatory gene expression (De Santa et al. EMBO J. 2009; Kruidenier et al. Nature 2012), albeit at later kinetics than studied here. Modeling H3.3S31ph with an existing structure for JMJD3 (Jones et al. Biochemistry 2018) reveals favorable interactions within an arginine rich pocket of JMJD3 (R1246 and R1272) surrounding the location of H3.3S31ph (much like SETD2). In contrast to these predictions of augmented recruitment, we considered that the location of H3.3S31ph might act to eject “readers” of proximal H3K36me3, extending the concept of the histone “methyl/phos switch” (Fischle et al. Nature 2003) into the gene body and co-transcriptional regulation of chromatin. In this context, it has been shown that H3.3S31ph reduces the binding affinity of PHD finger protein 1 (PHF1) Tudor domain for H3K36me3 by 7-fold (Andrews et al. ACS Chemical Biology 2016). Modeling H3.3S31phK36me3 with PHF1 Tudor reveals surrounding PHF1 acidic residues (E66, D67, D68) and 2.5 angstrom proximity (E66). Given its important role in polycomb repressive complex 2 (PRC2) activity (Sarma et al Mol. Cell. Biol. 2008; Cao et al Mol. Cell. Biol. 2008), PHF1 “ejection” from H3K36me3 by H3.3S31ph could have implications for transitions between H3K36me3 and H3K27me3 chromatin. (B) Complete ITC data representation including μcal/sec and time (matching Fig. 4b).
Extended Data Figure 9:
Extended Data Figure 9:. ZMYND11 regulation of LPS-induced genes.
(A) Slope-graph and (B) rank-plot depicting differences in ZMYND11 ChIP densities between resting and 60’ LPS-stimulated BMDM. (C) Cumulative distribution of read density of different sets of genes in S31ph ChIP data. S31 top 1% genes overall have more density so it is shifted to right compared to all genes. Genes extracted from top peaks of IKK, Zmynd11, and S31ph ChIP tends to have more enriched read density distribution over when we look at entire genes. Gene numbers are as follows: 44 IKK genes,176 Top1% genes, 851 S31ph peak genes. (D) ChIPseq read density tracks of ZMYND11, H3.3S31ph, and H3K36me3 in LPS stimulated BMDM (0 and 60’) for Btg2, JunB, Marcks, Zfp36, (LPS-induced genes) and Tubb6 (constitutively expressed gene). (E) RT-qPCR for Zmynd11, JunB, and Nfkbia after LPS stimulation of BMDM transfected (48 hours before) with siRNA non-target control (NT) and siRNA against Zmynd11. And western blot analysis of ZMYND11 transduced with shRNA scrambled control, and shRNA targeting ZMYND11. (F) Boxplots depicting differences in ZMYND11 ChIP densities between resting and 60’ LPS-stimulated BMDM **, p<0.005; ***, p<0.0005; ****, p<0.0001, Student’s t-test.
Extended Data Figure 10:
Extended Data Figure 10:. Characterization of H3.3 mutant RAW264.7 cell lines.
(A) Western Blot for H3.3 comparing wild-type (WT), vector control (VC), hypomorph (HYPO), and double-knockout (DKO) RAW264.7 cell lines, membrane was stained with direct blue (DB) for equal loading. (B, C) RNAseq scatter (“volcano”)-plot analysis, log2 fold-change and -log10(FDR), of DKO compared to WT (B), and HYPO compared to WT (C) RAW264.7 at 120’. (D) Ratio of RNAseq fold change (log2) for HYPO or DKO compared with WT at 60’ and 120’ LPS stimulation for all LPS-induced genes (top) and for the intersection of top H3.3S31ph genes and LPS-induced genes (bottom). ***<0.0001 by lower-tailed one-sample t-test (distribution below zero). (E) Heat map of fold change (log2) for top H3.3S31ph genes among LPS-induced genes (left, 60’; right, 120’) with control constitutively expressed genes below. RNAseq was performed with two biological replicates per condition. (G) Time course plots of mean RNAseq expression (RPKM) from two experiments at time points 0’, 60’, and 120’ after LPS-stimulation for experiments performed in wild-type (WT), hypomorph (HYPO), and double-knockout (DKO) RAW247.6 cell lines at LPS-induced genes Myc, Ccl9, Slfn2, Tnfaip3, Ccl4, Plk2, and constitutively expressed genes Tubb5 and Tbp. (F) Time course plots of mean RNAseq expression (RPKM) from two experiments at time points 0’, 60’, and 120’ after LPS-stimulation for experiments performed in wild-type (WT), hypomorph (HYPO), and double-knockout (DKO) RAW264.7cell lines at LPS-induced genes and at top H3.3S31ph genes among LPS-induced genes. (H) RT-qPCR for the viral expression of H3.3 transgene, either WT, S31A, or S31E in RAW macrophages. (I) RT-qPCR for CCL4 expression in a time course of stimulated DKO RAW264.7 cells rescued with WT H3.3, S31A, or S31E.
Figure 1:
Figure 1:. Histone H3 variant, H3.3, is phosphorylated at stimulation-induced genes during the macrophage response to pathogen sensing.
(A) Histone H3 sequence comparison between “canonical” H3.1/2 and variant H3.3 amino-terminal tails (residues 25–37), with key histone modifications labeled. (B) Western blot time course analysis of phospho-proteins, H3.3S31ph, H3S28ph, pERK in BMDM response to LPS; total H3, H3.3, and Erk as loading controls. (C) Western blot analysis of H3.3S31ph in bone marrow derived dendritic cells (BMDC), natural killer cells (NK), naïve B cells and neurons both in resting conditions and after treatment with relevant stimuli. (D) RNAseq tracks and H3.3, H3.3S31ph, and H3S28ph ChIPseq tracks in resting and stimulated BMDM at the Tnf and Nfkbia loci. (E) Dual rank order plot of H3.3S31ph ChIP signal density at all genes (TSS-TES) in resting macrophages (ranked in reverse order, right to left, blue X-axis) and stimulated (60’) macrophages (ranked left to right, black X-axis). Dotted line represents the top 1% threshold in stimulated macrophages. Red dots represent top stimulation-induced genes (FDR<0.05, fold change >2 between 0’ and 60’) among the top 0.2% of genes by H3.3S31ph ChIP density and are labeled in the 60’ data. Figure 1B-C are representative of 3 or more experiments.
Figure 2:
Figure 2:. H3.3S31 is co-transcriptionally phosphorylated by IKKα, deposited in the gene-body of response genes, and corresponds with H3K36me3.
ChIPseq tracks of H3.3S31ph at Tnf and Tnfaip3 (A), and read densities of top 1% H3.3S31ph target genes (B) in resting and LPS-stimulated BMDM after pre-treatment with DMSO, flavopiridol (FVP), camptothecin (CPT) and etoposide (ETO). ****, p<0.0001; Student’s t-test. (C) ChIPseq tracks of IKKα and H3.3S31ph at Tnf and Tnfaip3 after pre-treatments with DMSO and the IKK inhibitor IKK-16 (1.5 μM). (D) Western blot analysis of H3.3S31ph in resting and LPS-stimulated BMDM after pre-treatment with DMSO and the IKK inhibitors IKK-16 (1.5 μM) and ACHP (10 μM). (E) ChIPseq average profiles for H3.3S31ph and IKKα of RNAseq defined LPS-induced genes after 60 min of LPS stimulation. (F) ChIPseq tracks of H3K36me3, H3K36me2, H3K27ac, and H3.3, and RNAseq in resting and LPS-stimulated BMDM at Tnf and Tnfaip3. Additional genes and controls are shown in fig. S3. (G) Correlation plot showing absolute change (average read density 60’ - 0’ after LPS-stimulation) of H3K36me3 and H3K36me2 association with H3.3S31ph absolute change (average read density 60 – 0). Spearman’s rank correlation coefficient shown.
Figure 3
Figure 3. The H3K36me3 methyltransferase SETD2 is stimulated by H3.3S31ph.
(A) Western blot analysis for H3K36me2, H3K36me3, and H3 in histone methyltransferase (HMT) assays with SETD2 SET-domain and full-length NSD2 enzymes on unmodified H3.3 (H3.3wt) and H3.3S31E recombinant nucleosomes (rNucs). (NSD2 did not show any signal for H3K36me3) (NE, No Enzyme). (B) Representative western blot (above) and quantitative measurements of 3 independent experiments (integrated fluorescence intensity) (below) of SETD2 SET-domain HMT assays on unmodified and H3.3S31ph designer nucleosomes (dNucs). *, p<0.05; Student’s t-test. Error bars in (B) represent the range of three independent experiments. (C) Crystal structure of SETD2-H3.3S31phK36M complex. SETD2 is presented as electrostatic potential surface. Electrostatic potential is expressed as a spectrum ranging from −6 kT/e (red) to +6 kT/e (blue). H3.3 peptide is shown as yellow sticks with S31 phosphate group labeled. (D) Interaction of the H3.3S31ph phosphate group with K1673 and K1600 of SETD2. The salt bridge bonding and water mediated hydrogen bonding are shown as magenta dashed lines. The peptide is shown as yellow sticks covered by the simulated annealing 2Fo–Fc omit map contoured at the 2.0 σ level. The water molecule is shown as a cyan sphere. (E) Western blot analysis for H3K36me3 in HMT assays with SETD2 SET-domain wild type (wt), and K1600E,K1673E double mutant on H3.3wt and H3.3S31E rNucs. As the overall activity of the mutant enzymes is reduced, enzyme concentration was titrated to best visualize the ratio of H3.3wt to H3.3S31E activity.
Figure 4:
Figure 4:. H3.3S31ph ejects transcription repressor ZMYND11 and stimulates transcription.
(A) Isothermal titration calorimetry (ITC) curves of H3.3K36me3, H3.3S31phK36me3, unmodified H3.3 and H3.3S31ph peptides titrated into ZMYND11 PHD-BROMO-PWWP (PBP) domain. (B) ChIPseq tracks of ZMYND11, H3.3S31ph, and H3K36me3 in LPS stimulated BMDM (0 and 60’) for Tnf, Myc, and Tbp. (C) Average gene profiles of ZMYND11 for LPS-induced-ZMYND11-target genes in resting and stimulated BMDM (left) and comparison of ZMYND11 ChIPseq densities before and after LPS stimulation (right). (D) RT-qPCR for Zmynd11 and Tnf after LPS stimulation of BMDM transfected (48 hours before) with siRNA non-target control (NT) and against Zmynd11. (E) Heatmap of LPS-induced-ZMYND11-target genes displaying fold changes between resting and stimulated BMDM for mRNA and ChIPseq densities of H3.3S31ph, ZMYND11 and ZMYND11 after pre-treatment with IKK inhibitors. (F) RT-qPCR for Tnf of H3.3 double knockout (DKO) RAW264.7 cells “rescued” with H3.3 WT, S31A, or S31E transgenes prior to LPS stimulation. (G) Principal component analysis based on expression (RPKM) of all LPS-induced genes. (H) RPKM log2 fold-change of WT, S31A, and S31E compared to DKO for all LPS-induced genes that were “rescued” by WT H3.3 transgene (log2 fold change > 0). (I) Proposed mechanism: During resting conditions the transcriptional repressor ZMYND11 is bound to pre-existing H3.3K36me3 due to constitutive activity of the H3K36me3-specific methyltransferase SETD2. Stimulation-induced H3.3S31ph introduces a steric clash which ejects ZMYND11 and allows for SETD2 to bind, which in turn increases its methyltransferase activity and enables rapid and robust transcription. (G), (H) have three biological replicates per condition. *, p<0.05; **, p<0.005; ***, p<0.0005; ****, p<0.0001; Student’s t-test.

References

    1. Medzhitov R & Horng T Transcriptional control of the inflammatory response. Nat. Rev. Immunol 9, 692–703 (2009). - PubMed
    1. Smale ST, Tarakhovsky A & Natoli G Chromatin Contributions to the Regulation of Innate Immunity. Annu. Rev. Immunol 32, 489–511 (2014). - PubMed
    1. Akira S, Uematsu S & Takeuchi O Pathogen Recognition and Innate Immunity. Cell 124, 783–801 (2006). - PubMed
    1. Filipescu D, Szenker E & Almouzni G Developmental roles of histone H3 variants and their chaperones. Trends Genet. 29, 630–640 (2013). - PubMed
    1. Henikoff S & Smith MM Histone variants and epigenetics. Cold Spring Harb. Perspect. Biol (2015). doi:10.1101/cshperspect.a019364 - DOI - PMC - PubMed

Publication types

MeSH terms