. 2020 Aug;584(7819):148-153.
doi: 10.1038/s41586-020-2546-8. Epub 2020 Jul 22.

Discovery and engineering of colchicine alkaloid biosynthesis

Affiliations

Discovery and engineering of colchicine alkaloid biosynthesis

Ryan S Nett et al. Nature. 2020 Aug.

Erratum in

Abstract

Few complete pathways have been established for the biosynthesis of medicinal compounds from plants. Accordingly, many plant-derived therapeutics are isolated directly from medicinal plants or plant cell culture1. A lead example is colchicine, a US Food and Drug Administration (FDA)-approved treatment for inflammatory disorders that is sourced from Colchicum and Gloriosa species2-5. Here we use a combination of transcriptomics, metabolic logic and pathway reconstitution to elucidate a near-complete biosynthetic pathway to colchicine without prior knowledge of biosynthetic genes, a sequenced genome or genetic tools in the native host. We uncovered eight genes from Gloriosa superba for the biosynthesis of N-formyldemecolcine, a colchicine precursor that contains the characteristic tropolone ring and pharmacophore of colchicine6. Notably, we identified a non-canonical cytochrome P450 that catalyses the remarkable ring expansion reaction that is required to produce the distinct carbon scaffold of colchicine. We further used the newly identified genes to engineer a biosynthetic pathway (comprising 16 enzymes in total) to N-formyldemecolcine in Nicotiana benthamiana starting from the amino acids phenylalanine and tyrosine. This study establishes a metabolic route to tropolone-containing colchicine alkaloids and provides insights into the unique chemistry that plants use to generate complex, bioactive metabolites from simple amino acids.


Conflict of interest statement

COMPETING INTERESTS

The authors declare no competing financial interests.

Figures
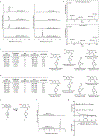
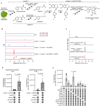
Extended Data Figure 1.
Extended Data Figure 1.. Characterization of GsOMT1.
a) LC-MS chromatograms demonstrating activity on substrate (1) by protein lysates from Nicotiana benthamiana leaves transiently expressing GsOMT1. Shown are extracted ion chromatograms (EICs) for 1 (m/z 286.1438; left panel), as well as the methylated product (*) produced in this experiment (m/z 300.1594; right panel). This experiment was performed three times, with similar results each time. b) MS/MS fragmentation spectrum of 1, as well as the generated m/z 300.1594 product (*) at a collision energy of 20V. Fragmentation of both compounds was performed twice, with similar results observed each time. c) Tabulated list and putative structures for ion fragments generated from MS/MS analysis of 1. d) Tabulated list and putative structures for ion fragments generated from MS/MS analysis of the m/z 300.1594 product. See Supplementary Information for a detailed analysis of MS/MS results. e) Proposed reaction catalyzed by GsOMT1 as supported by MS/MS fragmentation and prior labeling studies. f) Transient expression of GsOMT1 in Nicotiana benthamiana with co-infiltrated substrate 1 results in production of methylated product (2), as shown here via LC-MS chromatograms. This experiment was performed >3 times with similar results observed each time. g) Untargeted metabolite analysis (XCMS) comparing transient expression of GFP (negative control) to that of GsOMT1 with co-infiltrated substrate 1 (n=3 independent replicates for each experimental condition). Shown are unique mass signatures (P < 0.1 between samples, as determined via XCMS) in ranked order based upon their increasing (top panel) or decreasing (bottom panel) fold-change in abundance between the two compared conditions (i.e. GFP vs. GsOMT1). The mass isotopologues (M0 and M1) for the presumed product (m/z 300.1594) are highlighted in red, while the substrate (1, m/z 286.1438) is highlighted in blue. r.t. = retention time.
Extended Data Figure 2.
Extended Data Figure 2.. Characterization of GsNMT.
a) Co-expression of GsOMT1 and GsNMT in N. benthamiana with co-infiltrated 1 leads to consumption of putative 2 (m/z 300.1594) and production of a new compound corresponding to a methylation (m/z 314.1751), as shown here via LC-MS chromatograms. EIC = extracted ion chromatogram. Activity of full-length GsNMT was confirmed in three separate experiments. b) MS/MS fragmentation spectrum of the generated m/z 314.1751 product (*) at a collision energy of 20V. This was performed twice, with similar results observed each time. c) Tabulated list and putative structures for ion fragments generated from MS/MS analysis of the m/z 314.1751 product. See Supplementary Information for a detailed analysis of MS/MS results. d) Untargeted metabolite analysis (XCMS) comparing the presence vs. absence of GsNMT within the transient co-expression system (n=6 independent replicates for each experimental condition). Shown are unique mass signatures (P < 0.1 between samples, as determined via XCMS) in ranked order based upon their increasing (top panel) or decreasing (bottom panel) fold-change in abundance between the two compared conditions. The mass isotopologues (M0 and M1) of the presumed product (m/z 314.1751) are highlighted in red, while the mass isotopologues of the presumed substrate (m/z 300.1594) are highlighted in blue. r.t. = retention time. e) Proposed reaction catalyzed by GsNMT as supported by MS/MS fragmentation and prior labeling studies.
Extended Data Figure 3.
Extended Data Figure 3.. Characterization of GsCYP75A109.
a) Addition of GsCYP75A109 into the N. benthamiana transient expression system with co-infiltrated 1 leads to consumption of 3 (m/z 314.1751) and production of a new compound corresponding to a hydroxylation (m/z 330.1700), as shown here via LC-MS chromatograms. EIC = extracted ion chromatogram. These results were confirmed in two independent experiements. b) MS/MS fragmentation spectrum of the generated m/z 330.1700 product (*) at a collision energy of 20V. Consistent results were obtained in three separate experiments. c) Tabulated list and putative structures for ion fragments generated from MS/MS analysis of the m/z 330.1700 product. See Supplementary Information for a detailed analysis of MS/MS results. d) Untargeted metabolite analysis (XCMS) comparing the presence vs. absence of GsCYP75A109 within the transient co-expression system (n=6 independent replicates for each experimental condition). Shown are unique mass signatures (P < 0.1 between samples, as determined via XCMS) in ranked order based upon their increasing (top panel) or decreasing (bottom panel) fold-change in abundance between the two compared conditions. The presumed product (m/z 330.1700) is highlighted in red, while the mass isotopologues (M0, M1) of the presumed substrate (m/z 314.1751) are highlighted in blue. r.t. = retention time. e) Proposed reaction catalyzed by GsCYP75A109 as supported by MS/MS fragmentation and prior labeling studies. f) An N-terminal truncation of a predicted mitochondrial localization signal from GsNMT (yielding GsNMTt) increases yield of putative 4 (m/z 330.1700) in the transient co-expression system, as shown here via representative LC-MS chromatograms. g) Quantification of the heterologous production of 3 (m/z 314) or 4 (m/z 330) with the use of GsNMT or GsNMTt within the co-expression system. Filled-in boxes (gray) indicate the presence of a gene within the co-expression experiment, while an empty box (white) indicates its absence. Shown for each reaction is the mean of 3 distinct biological replicates along with the corresponding standard deviation. Statistical comparisons were made using a one-tailed Student’s t-test, with an assumption of unequal variance. n.d. = not detected. Direct comparison between the experimental conditions was performed twice with similar results obtained each time. Activity of GsNMTt within pathway engineering was consistent in >3 experiments.
Extended Data Figure 4.
Extended Data Figure 4.. Characterization of GsOMT2.
a) Addition of GsOMT2 into the N. benthamiana transient co-expression system with co-infiltrated 1 leads to consumption of putative 4 (m/z 330.1700) and production of a new compound corresponding to both a methylation and a hydroxylation (m/z 360.1805), as shown here via LC-MS chromatograms. EIC = extracted ion chromatogram. This activity was confirmed >3 independent experiments. b) MS/MS fragmentation spectrum of the generated m/z 360.1805 product (*) at a collision energy of 20V. MS/MS fragmentation of this peak was performed twice, with similar results each time. c) Tabulated list and putative structures for ion fragments generated from MS/MS analysis of the m/z 360.1805 product. See Supplementary Information for a detailed analysis of MS/MS results. d) Untargeted metabolite analysis (XCMS) comparing the presence vs. absence of GsOMT2 within the transient co-expression system (n=6 independent replicates for each experimental condition). Shown are unique mass signatures (P < 0.1 between samples, as determined via XCMS) in ranked order based upon their increasing (top panel) or decreasing (bottom panel) fold-change in abundance between the two compared conditions. The mass isotopologues (M0, M1, and M2) for the presumed product (m/z 360.1805) are highlighted in red, while the mass isotopologues (M0, M1) of the presumed substrate (m/z 330.1700) are highlighted in blue. r.t. = retention time. e) Proposed reaction catalyzed by GsOMT2, and tentatively GsCYP75A109, as supported by MS/MS fragmentation and prior labeling studies. Note that compound 5 is not observed within our co-expression system, presumably due to its consumption to 6.
Extended Data Figure 5.
Extended Data Figure 5.. Characterization of GsOMT3.
a) Addition of GsOMT3 into the N. benthamiana transient co-expression system with co-infiltrated 1 leads to consumption of 6 (m/z 360.1805) and production of a new compound corresponding to a methylation (m/z 374.1962), as shown here via LC-MS chromatograms. The new peak was compared to a racemic standard of autumnaline (7) - (R,S)-autumnaline - which supports the identity of this new compound as 7. EIC = extracted ion counts. This experiment was repeated >3 times with similar results observed each time. b) MS/MS fragmentation spectrum of the generated m/z 374.1962 product (*) compared to that of racemic 7, each at a collision energy of 20V. This was performed three times, with similar results observed each time. c) Tabulated list and putative structures for ion fragments generated from MS/MS analysis of the m/z 374.1962 product. See Supplementary Information for a detailed analysis of MS/MS results. d) Untargeted metabolite analysis (XCMS) comparing the presence vs. absence of GsOMT3 within the transient co-expression system (n=6 independent replicates for each experimental condition). Shown are unique mass signatures (P < 0.1 between samples, as determined via XCMS) in ranked order based upon their increasing (top panel) or decreasing (bottom panel) fold-change in abundance between the two compared conditions. The mass isotopologues (M0, M1) for the product (m/z 374.1962) are highlighted in red, while the mass isotopologues (M0, M1, and M2) of the presumed substrate (m/z 360.1805) are highlighted in blue. r.t. = retention time. e) Proposed reaction catalyzed by GsOMT3, as supported by MS/MS fragmentation, prior labeling studies, and comparison to a 7 standard.
Extended Data Figure 6.
Extended Data Figure 6.. Characterization of GsCYP75A110.
a) Addition of GsCYP75A110 into the N. benthamiana transient co-expression system with co-infiltrated 1 leads to consumption of 7 (m/z 374.1962) and production of a new compound corresponding to a loss of 2 hydrogens (m/z 372.1805), as shown here via LC-MS chromatograms. EIC = extracted ion chromatogram. This experiment was performed >3 times with similar results observed each time. b) MS/MS fragmentation spectrum of the generated m/z 372.1805 product (*) at a collision energy of 20V. This spectrum is shown because it represents the only peak consumed in downstream biosynthesis (see Extended Data Fig. 7). MS/MS fragmentation of this peak was performed twice, with similar results observed each time. c) Tabulated list and putative structures for ion fragments generated from MS/MS analysis of the m/z 372.1805 product. d) Untargeted metabolite analysis (XCMS) comparing the presence vs. absence of GsCYP75A110 within the transient co-expression system (n=6 independent replicates for each experimental condition). Shown are unique mass signatures (P < 0.1 between samples, as determined via XCMS) in ranked order based upon their increasing (top panel) or decreasing (bottom panel) fold-change in abundance between the two compared conditions. The mass signatures for two of the presumed products (m/z 372.1805) are highlighted in red, while the mass signature of the presumed substrate (m/z 374.1962) is highlighted in blue. r.t. = retention time. e) Expression of GsCYP75A110 individually with substrate (7) co-infiltration, as shown through LC-MS chromatograms of substrate (7, m/z 374.1962) and products (m/z 372.1805). Shown for comparison are the products produced via pathway reconstitution in N. benthamiana. This experiment was performed once. f) In vitro assays using microsomal protein isolated from yeast expressing GsCYP75A110. Shown are LC-MS chromatograms of substrate (7) and products (m/z 372.1805) with comparison to the products produced within the N. benthamiana transient expression system. Peak integrations for the substrate (7) are shown in blue text to demonstrate consumption of the substrate in the presence of GsCYP75A110-containing microsomal protein and NADPH. This experiment was performed once. g) Predicted, alternative phenol coupling isomers may explain the three isomeric peaks detected with m/z 372.1805. h) Proposed reaction catalyzed by GsCYP75A110, as supported by MS/MS fragmentation and prior labeling studies.
Extended Data Figure 7.
Extended Data Figure 7.. Characterization of GsOMT4.
a) Addition of of GsOMT4 into the N. benthamiana transient co-expression system with co-infiltrated 1 leads to consumption of 8 (m/z 372.1805) and production of a new compound corresponding to a methylation (m/z 386.1962), as shown here via LC-MS chromatograms. Comparison to an O-methylandrocymbine (9) standard purified from Colchicum autumnale plants supports the identity of this compound as 9. EIC = extracted ion chromatogram. This result was confirmed in >3 independent experiments. b) MS/MS fragmentation spectrum of the generated m/z 386.1962 product (*) compared to the purified 9 standard, with both compounds fragmented at a collision energy of 20V. This was performed twice, with similar results observed each time. c) Tabulated list and putative structures for ion fragments generated from MS/MS analysis of the m/z 386.1962 product. d) Untargeted metabolite analysis (XCMS) comparing the presence vs. absence of GsOMT4 within the transient co-expression system (n=6 independent replicates for each experimental condition). Shown are unique mass signatures (P < 0.1 between samples, as determined via XCMS) in ranked order based upon their increasing (top panel) or decreasing (bottom panel) fold-change in abundance between the two compared conditions. The mass signature for the product (9, m/z 386.1962) is highlighted in red, while the mass signature of the presumed substrate (m/z 372.1805) is highlighted in blue. r.t. = retention time. e) Proposed reaction catalyzed by GsOMT4, as supported by MS/MS fragmentation, prior labeling studies, and comparison to an isolated 9 standard.
Extended Data Figure 8.
Extended Data Figure 8.. Characterization of GsCYP71FB1.
a) Addition of GsCYP71FB1 into the N. benthamiana transient co-expression system with co-infiltrated 1 leads to consumption of 9 (m/z 386.1962) and production of a new compound with identified masses of m/z 400.1755 [M+H+] and 422.1574 [M+Na]+ as shown here via LC-MS chromatograms. Comparison to an authentic N-formyldemecolcine (10) standard supports formation of this compound. EIC = extracted ion chromatogram. This experiment was performed twice, with similar results observed each time. b) MS/MS fragmentation spectrum of the generated m/z 400.1755 product (*) compared to the 10 standard, with both compounds fragmented at a collision energy of 20V. This was performed three times, with similar results each time. c) Transient expression of GsCYP71FB1 individually in N. benthamiana with substrate (9) co-infiltration, as shown through LC-MS chromatograms of substrate (9, m/z 386.1962) and product (10, m/z 400.1755) with comparison to a 10 standard. This experiment was performed once. d) In vitro assays using microsomal protein isolated from yeast expressing GsCYP71FB1. Shown are LC-MS chromatograms of substrate (9) and product (10) with comparison to the 10 standard. Peak integrations for the substrate (9) are shown in blue text to demonstrate its consumption in the presence of GsCYP71FB1-containing microsomal protein and NADPH. This experiment was performed once. e) Untargeted metabolite analysis (XCMS) comparing the presence vs. absence of GsCYP71FB1 within the transient co-expression system (n=6 independent replicates for each experimental condition). Shown are unique mass signatures (P < 0.1 between samples, as determined via XCMS) in ranked order based upon their increasing (top panel) or decreasing (bottom panel) fold-change in abundance between the two compared conditions. The mass isotopologues (M0, M1) as well as adducts (+Na, +K) for the product (10, m/z 400.1755) are highlighted in red, while the mass isotopologues (M0, M1) and adducts (2M+Na) of the substrate (9, m/z 386.1962) are highlighted in blue. r.t. = retention time. f) Proposed reaction catalyzed by GsCYP71FB1, as supported by MS/MS fragmentation, prior labeling studies, and comparison to an authentic 10 standard.
Extended Data Figure 9.
Extended Data Figure 9.. Comparison of intermediates produced in the Nicotiana benthamiana co-expression system to Gloriosa superba metabolites.
Each biosynthetic product downstream of 1 produced in our co-expression system (black traces) were compared to the equivalent mass ion found within G. superba rhizome extracts (blue traces) or to a verified standard (red traces) via LC-MS analysis. EIC = extracted ion chromatogram. Additionally, MS/MS spectra for co-eluting peaks were compared to demonstrate the chemical similarity between these compounds. Collision energies for all shown MS/MS analyses were 20V, with the exception of 1, for which fragmentation at 10V is shown. These LC-MS comparisons were performed once with multiple biological replicates of G. superba metabolite extractions (n=6 biological replicates from four different tissues: leaf, stem, root, and rhizome). The chromatographic traces for G. superba metabolites in this figure are from a representative rhizome extract. Retention time and MS/MS spectra for compounds produced via heterologous expression in N. benthamiana were consistent among individual experiments.
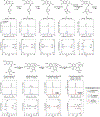
Extended Data Figure 10.
Extended Data Figure 10.. Engineering early metabolites in colchicine biosynthesis.
a) List of module 1 biosynthetic genes and their best BLASTP hit in Arabidopsis thaliana. Note that all genes except for GsAER seem to have an ortholog in Arabidopsis with >60% identity, suggesting functional equivalence. b) Generalized pathway for the proposed engineered production of 4-HDCA in N. benthamiana. c) LC-MS chromatograms demonstrating that co-expression of module 1 in N. benthamiana leads to production of 4-HDCA, which was detected as the Girard reagent T derivative (m/z 264.1707). EIC = extracted ion chromatogram. Production of 4-HDCA with module 1 genes was demonstrated three times with similar results each time. d) LC-MS chromatograms (via HILIC analysis) assessing the production of tyramine (left panel, m/z 138.0913), L-DOPA (middle panel, m/z 198.0761), and dopamine (right panel, m/z 154.0863) upon individual and co-expression of GsTyDC/DDC and BvCYP76AD5 (module 2). Next to each set of chromatograms is the corresponding relative quantifications of tyramine (m/z 138), L-DOPA (m/z 198), and dopamine (m/z 154) within each reaction. Shown for each reaction is the mean of 3 distinct biological replicates along with the corresponding standard deviation. n.d. = not detected. Module 2 activity was confirmed in >3 times individual experiments. e) Proposed scheme for the engineered biosynthesis of dopamine. f) Comparison of native CjNCS function within benzylisoquinoline alkaloid (BIA) biosynthesis to the putative reaction required within colchicine alkaloid biosynthesis. g) Co-expression of both module 1 and module 2 genes in N. benthamiana leads to concurrent production of the requisite aldehyde (m/z 264.1707, Girard T derivative), as well as dopamine (m/z 154.0863), as shown here via LC-MS chromatograms. Note that dopamine is observed here with C18 chromatography. Co-expression of both modules was performed >3 times, with similar results each time. h) LC-MS chromatograms for the co-expression of module 1 and module 2 with CjNCS with comparison to an authentic 1 standard. These experiments were performed >3 times, with similar results observed each time. i) MS/MS fragmentation comparison between the newly identified m/z 286.1438 peak (*) and the 1 standard. Both were analyzed with a collision energy of 10V. This MS/MS comparison was performed twice. j) Comparison of wild-type, full-length CjNCS function to N-terminal truncations of 24 (Δ24-CjNCS) and 29 (Δ29-CjNCS) amino acids. Filled-in boxes (gray) indicate the presence of a gene within the co-expression experiment, while an empty box (white) indicates its absence. Shown for each reaction is the mean of 3 biological replicates along with the corresponding standard deviation.
Extended Data Figure 11.
Extended Data Figure 11.. Metabolic engineering of colchicine alkaloids in Nicotiana benthamiana.
a) Biosynthetic scheme of the transient metabolic engineering system in N. benthamiana for the production of 2 and 9. b) LC-MS chromatograms for the co-expression of GsOMT1 with module 1, module 2, and Δ24-CjNCS compared to that of GsOMT1 expressed alone with co-infiltration of 1. Shown are the extracted ion chromatograms (EICs) for 1 (blue traces, m/z 286.1438) and the production of 2 (red traces, m/z 300.1594). c) LC-MS chromatograms demonstrating the production of 9 via co-expression of module 3 (without GsCYP71FB1) with module 1, module 2, and Δ24-CjNCS. This is compared to infiltration of 1 (as substrate) with co-expression of module 3 (without GsCYP71FB1), as well as to a standard of O-methylandrocymbine (9). Shown are the EICs specific to the exact mass of 9 (m/z 386.1962). Engineered production of 2 and 9 was demonstrated three times for each molecule. d) Production of two different colchicine alkaloids (2, m/z 300.1594; 10, m/z 400.1755, 422.1574) via metabolic engineering in N. benthamiana when GsAER is either omitted or included. Filled-in boxes (gray) indicate the presence of a module/gene within the co-expression experiment, while an empty box (white) indicates its absence. Shown for each reaction is the mean of 6 biological replicates ± standard deviation for each condition. Statistical significance was assessed using a two-tailed Student’s t-test with an assumption of unequal variance. Production of 2 in this context was assessed once, while production of 10 was performed twice with similar results each time. e) Individual dropout of each module 1 and module 2 gene within the engineered production of 10 (m/z 400.1755, 422.1574). Shown for each reaction is the mean ± standard deviation for each reaction condition. n=3 for GFP control; n=5 for PAL, CCR, AER, C4H, TyDC/DDC, and BvCYP76AD5 dropouts; n=6 for 4CL and DAHPS dropouts and for the no-dropout control. All replicates represent independent biological replicates. Statistical comparisons made using Dunnett’s test (two-tailed) with comparison to the full pathway control (indicated by arrow). *** = P < 0.001. This experiment was performed twice, with similar results each time.
Extended Data Figure 12.
Extended Data Figure 12.. Dropout analysis of module 3 biosynthetic genes.
Metabolic engineering of the full pathway to N-formyldemecolcine (10) in N. benthamiana was compared to transient co-expression systems in which individual module 3 enzymes were removed. a) Accumulation of proposed pathway intermediates within dropout experiments. Gray boxes to the left of the graph indicate biosynthetic genes/modules included within a co-expression experiment, while white boxes indicate their absence. Shown for each intermediate is the mean extracted ion abundance (n=3, ± standard deviation) for the exact ion mass [M+H]+ (for 10, both [M+H]+ and [M+Na]+), as well as the retention time (r.t.) that corresponds to each compound. b) Dropout of GsOMT1 from the full engineered pathway leads to accumulation of a new compound with a mass equivalent to 2 (m/z 300.1594), as shown via LC-MS chromatograms. The newly identified peak is indicated via the arrow. EIC = extracted ions chromatogram. c) Transient co-expression of GsOMT1 or GsNMTt with module 1, module 2, and Δ24-CjNCS (for production of 1). Shown are the LC-MS chromatograms for the substrate (1, m/z 286.1438), singly-methylated products (2a and 2b, m/z 300.1574) and doubly-methylated product (3, m/z 314.1751). d) MS/MS fragmentation spectrum of 2a/2 (collision energy of 20V), as well as a tabulated list and putative structures for the ion fragments. e) MS/MS fragmentation spectrum of 2b (collision energy of 20V), as well as a tabulated list and putative structures for the ion fragments. Note that fragment B (m/z 269) supports the placement of the methyl group on the nitrogen. For reference, compare to fragment B of 2a in panel “d”. f) Comparative consumption of 1 by GsOMT1 and GsNMTt. Gray boxes indicate the presence of a gene/module within the co-expression experiment, while a white box indicates its absence. n=3 for each reaction; statistical comparisons made using Dunnett’s test with comparison to the module 1/module 2/Δ24-CjNCS control. g) Proposed scheme for the initial methylations of 1. All experiments shown in this figure were performed once.
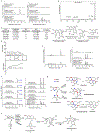
Figure 1.
Figure 1.. Summary of predicted colchicine biosynthesis.
The proposed pathway for colchicine biosynthesis is based on extensive radioisotope labeling studies and structural characterization of alkaloids isolated from colchicine-producing plants. The black circle in the structures of O-methylandrocymbine and colchicine indicates the rearrangement of carbon 12 (C12) during the ring expansion reaction. See Supplementary Information Scheme 1 for a full description of the proposed biosynthetic pathway.
Figure 2.
Figure 2.. Candidate methyltransferase (MT) and cytochrome P450 (CYP) transcripts identified within the public Gloriosa superba transcriptome via expression correlation analysis.
Discovery of a tentative function for GsOMT1 within colchicine alkaloid biosynthesis prompted its use as a query for Pearson correlation analysis of contig expression within the public G. superba transcriptome (87,123 contigs compared across 8 tissue samples). The expression of each candidate transcript is represented as the fragments per kilobase of trascript per million mapped reads (FPKM). Tissue samples 1 thru 4 represent distinct tissue types with two replicate libraries of each. a) Comparison of GsOMT1 expression to previously cloned MT candidate gene transcripts. b) Identification of CYP transcripts that show strong co-expression with GsOMT1. Candidate genes ultimately found to have a role in colchicine alkaloid biosynthesis are highlighted in red.
Figure 3.
Figure 3.. Combined transcriptomics and metabolomics identify notable co-expression of colchicine biosynthetic genes within Gloriosa superba.
a) Tissues from G. superba plants (leaf, stem, rhizome, and root) were used to quantify colchicine alkaloid accumulation and to isolate RNA for subsequent RNA-seq analysis. b) Colchicine accumulates in all tissues, but to the highest level in the rhizome, suggesting this to be the most active site of biosynthesis. Shown is the extracted ion abundance of colchicine, m/z 400.1755 ± 20 ppm. n=7 independent biological replicates for each tissue type, shown here via box and whisker plots. The center line indicates the median; box limits indicate upper and lower quartiles; whiskers indicate 1.5x interquartile range; points outside of the whiskers indicate outliers. c) Hierarchical clustering analysis (distance metric: uncentered Pearson correlation) was performed on contigs with a TMM-normalized, counts per million (CPM) value greater than 25 (for a total of 11,315 out of 38,466 total contigs compared across 11 tissue samples). This analysis identifies an 89 contig cluster that is populated with a substantial number of colchicine biosynthetic genes, as shown here, indicating a high level of co-expression.
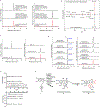
Figure 4.
Figure 4.. Discovery of a pathway for colchicine alkaloid biosynthesis.
Transient co-expression of eight identified biosynthetic genes from G. superba within N. benthamiana allows for step-by-step conversion of a co-infiltrated 1-phenethylisoquinoline substrate (1) into the tropolone-containing alkaloid N-formyldemecolcine (10) via the proposed pathway shown here. Gray boxes to the left of the bar graphs indicate biosynthetic genes included within a co-expression experiment, with the red box indicating the final acting enzyme within a set of co-expressed genes. Shown for each intermediate is the mean extracted ion abundance (n=6, ± standard deviation) for the exact ion mass [M+H]+ (for 10, both [M+H]+ and [M+Na]+) that corresponds to each compound.
Figure 5.
Figure 5.. Engineered biosynthesis of N-formyldemecolcine (10) from primary metabolism in Nicotiana benthamiana.
a) Biosynthetic scheme depicting the combination of three biosynthetic modules and CjNCS from benzylisoquinoline alkaloid (BIA) biosynthesis for the engineered production of 10 in N. benthamiana. b) LC-MS chromatograms demonstrating formation of 10 ([M+H]+ = 400.1755 Da, [M+Na]+ = 422.1574 Da) via transient pathway expression in N. benthamiana leaves, as compared to an authentic standard of 10. EIC = extracted ion chromatogram. Metabolic engineering of 10 was repeated >3 times with similar results observed in each experiment. c) MS/MS fragmentation (m/z = 400.1755, 20V) of the new compound highlighted in panel b compared to that of the 10 standard. d) Calculated yield of products synthesized via module 1 (4-HDCA), module 2 (dopamine), and the full engineered pathway (10). Yields are reported as mass of compound per gram dry weight of extracted N. benthamiana leaf tissue (n=3 independent replicates for each experiment), along with the corresponding standard deviation (SD). See Supplementary Information for a discussion of yield comparisons to native colchicine-producing plants.

Comment in

References

    1. Atanasov AG et al. Discovery and resupply of pharmacologically active plant-derived natural products: A review. Biotechnol. Adv 33, 1582–1614 (2015). - PMC - PubMed
    1. Slobodnick A, Shah B, Pillinger MH & Krasnokutsky S Colchicine: old and new. Am. J. Med 128, 461–470 (2015). - PMC - PubMed
    1. Davis MW Colchicine compositions and methods. U.S. Patent No 7,964,647. July 19 (2011).
    1. Jana S & Shekhawat GS Critical review on medicinally potent plant species: Gloriosa superba. Fitoterapia 82, 293–301 (2011). - PubMed
    1. Sivakumar G Upstream biomanufacturing of pharmaceutical colchicine. Crit. Rev. Biotechnol 38, 83–92 (2018). - PubMed

Publication types