[Preprint]. 2021 Apr 5:2020.07.13.20153114.
doi: 10.1101/2020.07.13.20153114.

Dynamics of B-cell repertoires and emergence of cross-reactive responses in COVID-19 patients with different disease severity

Affiliations

Dynamics of B-cell repertoires and emergence of cross-reactive responses in COVID-19 patients with different disease severity

Zachary Montague et al. medRxiv. .

Update in

Abstract

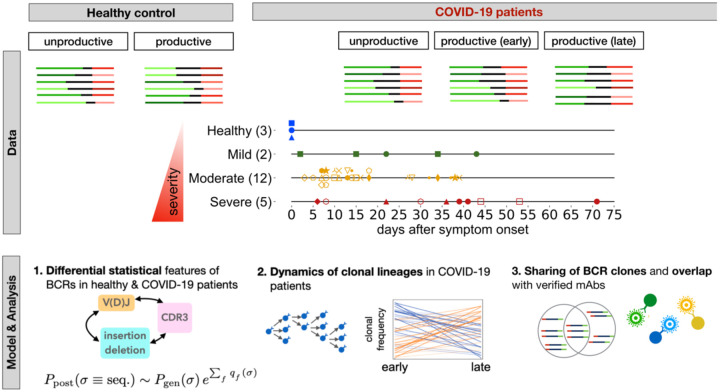
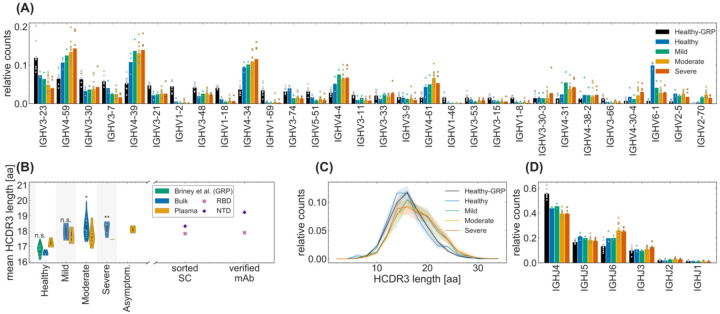
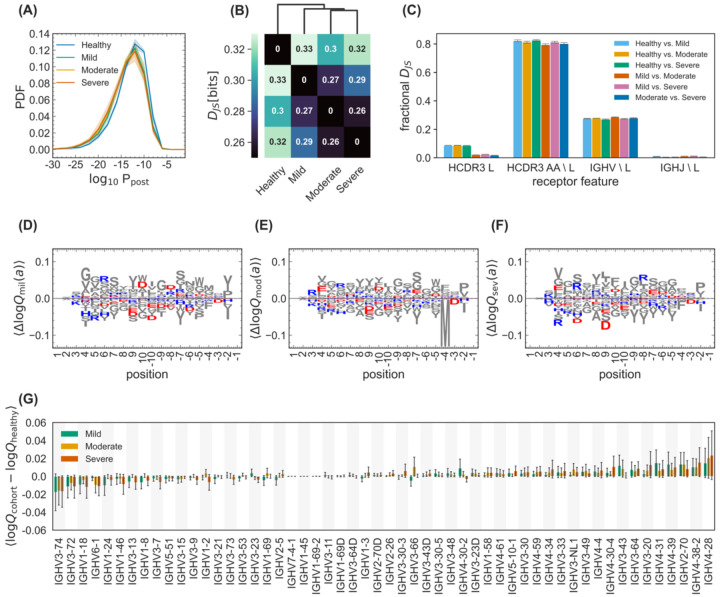
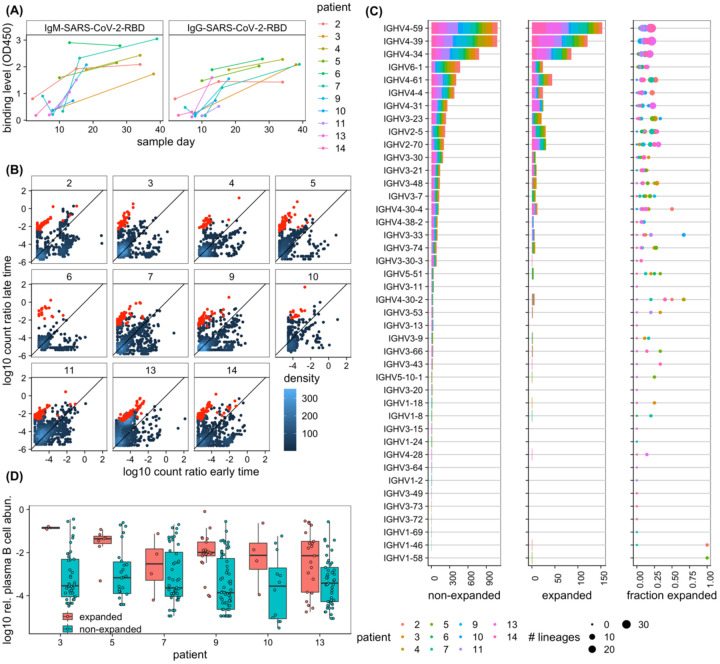
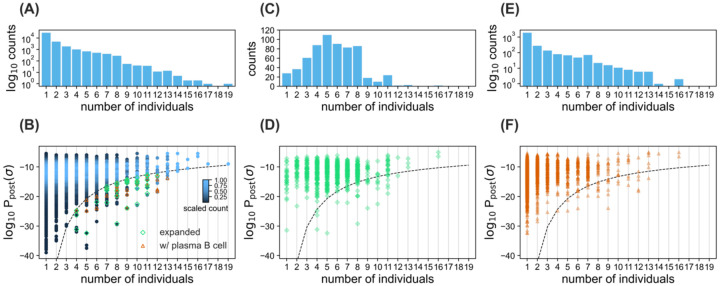
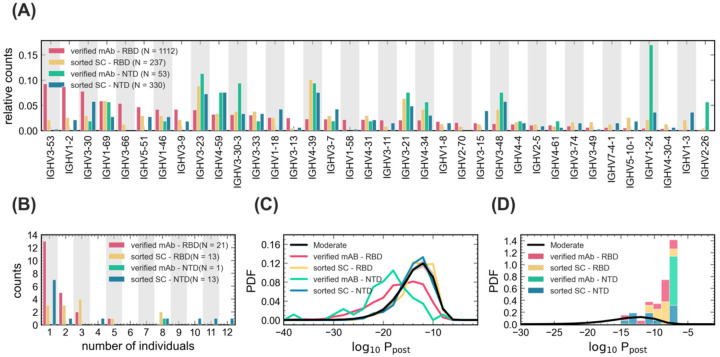
COVID-19 patients show varying severity of the disease ranging from asymptomatic to requiring intensive care. Although a number of SARS-CoV-2 specific monoclonal antibodies have been identified, we still lack an understanding of the overall landscape of B-cell receptor (BCR) repertoires in COVID-19 patients. Here, we used high-throughput sequencing of bulk and plasma B-cells collected over multiple time points during infection to characterize signatures of B-cell response to SARS-CoV-2 in 19 patients. Using principled statistical approaches, we determined differential features of BCRs associated with different disease severity. We identified 38 significantly expanded clonal lineages shared among patients as candidates for specific responses to SARS-CoV-2. Using single-cell sequencing, we verified reactivity of BCRs shared among individuals to SARS-CoV-2 epitopes. Moreover, we identified natural emergence of a BCR with cross-reactivity to SARS-CoV-1 and SARS-CoV-2 in a number of patients. Our results provide important insights for development of rational therapies and vaccines against COVID-19.

Keywords: B-cell repertoires; COVID-19; SARS-CoV-2; cross-reactivity.


Conflict of interest statement

Competing Interests The authors declare no competing interests.

Figures

Figure 1.
Figure 1.. Roadmap for analysis of BCR repertoires.
Top: We collected bulk blood IgG BCR samples from three healthy individuals and 19 COVID-19 patients where two patients had mild symptoms, 12 had moderate symptoms, and five had severe symptoms (different markers and colors); see Methods. We also collected CD38+ plasma B-cells from PBMC samples of seven patients in this cohort (six moderate, one severe) and from seven additional patients (two asymptomatic, three mild, two moderate), and three healthy individuals (Fig. S2, Tables S1, S2). Samples were collected at different time points during infection (shown in center for bulk repertoires). We distinguished between productive receptors and unproductive receptors that had frameshifts due to V(D)J recombination. Line segments of varying lengths represent full V(D)J rearrangements (colors). In each patient, we constructed clonal lineages for productive and unproductive BCRs and inferred the naïve progenitor of the lineage (Methods). Bottom: 1. Using the set of unproductive inferred naïve BCRs, we inferred a model to characterize the null probability for generation of receptors Pgen(σ)(Marcou et al., 2018). We inferred a selection model (Sethna et al. 2020) to characterize the deviation from the null among inferred naïve productive BCRs, with the probability of entry to the periphery Pgen(σ) and selection factors qf(σ), dependent on receptor sequence features. 2. Based on temporal information of sampled BCRs, we identified clonal lineages that showed significant expansion during infection. 3. We identified progenitors of clonal lineages shared among individuals and assessed the significance of these sharing statistics based on the probabilities to find each receptor in the periphery. The shared expanding clonal lineages that contain plasma B-cells, are likely candidates for secreting responsive antibodies during infection. We verified reactivity of receptors to SARS-CoV-2 antigenic epitopes using sorted single-cell data. We also identified previously characterized monoclonal antibodies (mAbs) specific to SARS-CoV-2 and SARS-CoV-1.
Figure 2.
Figure 2.. Sequence features of immune receptors in the bulk repertoire across cohorts.
(A) The relative counts for IGHV-gene usage is shown for inferred naïve progenitors of clonal lineages in cohorts of healthy individuals and COVID-19 cohorts of patients exhibiting mild, moderate, and severe symptoms. The bars indicate the usage frequency averaged over individuals in each cohort, and dots indicate the variation in V-gene frequencies across individuals within each cohort. (B, C) Statistics of length of HCDR3 amino acid sequence is shown for different patients in each cohort. The violin plots in (B) show the mean HCDR3 length of each patient (dots) in a given cohort (color), with violin plot cut parameter set to 0.1. The mean HCDR3 lengths of the sorted single cells and verified monoclonal antibodies (axis) for RBD-reactive (pink squares) and NTD-reactive (purple pluses) receptors are shown on the right. Full lines in (C) show distributions averaged over individuals in each cohort (color), and shadings indicate regions containing one standard deviation of variation across individuals within a cohort. One-way ANOVA statistical tests were performed comparing the means HCDR3 of all the COVID-19 cohort and the healthy repertoires from Great Repertoire Project (GRP) dataset (Briney et al. 2019), with the healthy control from this study: Healthy-Mild: F1,3 = 12.0, p-value = 0.04; Healthy-Moderate: F1,13 = 15.7, p-value = 0.0016; Healthy-Severe: F1,6 = 37.5, p-value = 0.00087; Healthy-GRP: F1,11 = 0.9), p-value = 0.359. Significance cutoffs: n.s. p – value > 0.01, * p – value ≤ 0.01, ** p – value < 0.001. (D) The relative counts for IGHJ-gene usage is shown for inferred naive progenitors of clonal lineages in cohorts of healthy individuals and COVID-19 cohorts of patients exhibiting mild, moderate, and severe symptoms. The bars indicate the usage frequency averaged over individuals in each cohort, and dots indicate the variation in J-gene frequencies across individuals within each cohort.
Figure 3.
Figure 3.. Differential statistics of immune repertoires across cohorts.
(A) The distribution of the log-probability to observe a sequence σ in the periphery log10 Ppost(σ) is shown as a normalized probability density function (PDF) for inferred naïve progenitors of clonal lineages in cohorts of healthy individuals and the mild, moderate, and severe cohorts of COVID-19 patients. Full lines show distributions averaged over individuals in each cohort, and shadings indicate regions containing one standard deviation of variation among individuals within a cohort. (B) Clustering of cohorts based on their pairwise Jensen-Shannon divergences DJS as a measure of differential selection on cohorts is shown (Methods). (C) The bar graph shows how incorporating different features into a SONIA model contributes to the fractional Jensen-Shannon divergence between models trained on different cohorts. The error bars show the variations of these estimates over five independently inferred models (Methods). Logo plots show the expected differences in the log-selection factors for amino acid usage, 〈Δlog Qcohort(a)〉 = 〈log Qcohort(a) − log Qhealthy(a)〉 for the (D) mild, (E) moderate, and (F) severe COVID-19 cohorts. The expectation values 〈•〉 are evaluated on the mixture distribution 12(Ppostcohort+Pposthealthy). Positively charged amino acids (lysine, K; arginine, R; and histidine, H) are shown in blue while negatively charged amino acids (aspartate, D, and glutamate, E) are shown in red. All other amino acids are grey. Positions along the HCDR3 are shown up to 10 residues starting from the 3’ (positive position values) and the 5’ ends (negative position values). (G) The bar graph shows the average mean difference between the log-selection factors for IGHV-gene usage for the mild (green), moderate (yellow), and severe (red) COVID-19 cohorts, with the mean computed using the mixture distribution 12(Ppostcohort+Pposthealthy) and the average taken over the mean differences of 30 independently trained SONIA models for each cohort. Error bars show one standard deviation for the estimated mean, due to variations in the inferred SONIA models.
Figure 4.
Figure 4.. Dynamics of BCR repertoires during infection.
(A) The binding level (measured by OD450 in ELISA assay) of the IgM (left) and IgG (right) repertoires to SARS-CoV-2 (RBD) epitopes increases over time in most individuals. (B) The log-ratio of BCR (mRNA) abundance at late time versus early time is shown for all clonal lineages that are present at least in two time points (see Methods). Each panel shows dynamics of lineages for a given individual, as indicated in the label. The analysis is shown in individuals for whom the binding level (OD450) of the IgG repertoire increases over time (shown in (A)). The count density indicates the number of lineages at each point. Lineages that show a significant expansion over time are indicated in red (see Methods for estimation of associated p-values). (C) IGHV-gene usage of lineages is shown for non-expanded (left) and expanded (middle) lineages in all individuals (colors). The right panel shows, for each patient (colors), the fraction of expanded lineages with a given IGHV gene as the number of expanded lineages divided by the total number of lineages with that given IGHV gene. The size of the circles indicates the total number of lineages in each category. (D) Boxplot of log10 relative read abundance in the plasma B-cell (Methods) are shown for expanding (red) and non-expanding (cyan) lineages that contain reads from the plasma B-cell in different patients. Receptors from the plasma B-cell are significantly more abundant in expanding lineages in a number of patients based on the ANOVA test statistics: patient 3: F1,42 = 5.4, p-value = 0.02; patient 5: F1,31 = 0.5, p-value = 0.5; patient 7: F1,49 = 0.01, p-value = 0.91; patient 9: F1,42 = 4.1, p-value = 0.04; patient 10: F1,42 = 2.9, p-value = 0.1; patient 13: F1,64 = 7.7, p-value = 0.007.
Figure 5.
Figure 5.. Sharing of BCRs among patients.
(A) The histogram shows the number of clonal lineages that share a common progenitor in a given number of individuals, indicated on the horizontal axis. (B) The density plot shows the distribution of log10 Ppost for progenitors of clonal lineages shared in a given number of individuals, indicated on the horizontal axis. Histogram bin size is 0.5. The scaling of sequence counts sets the maximum of the density in each column to one. Sharing of rare lineages with log10 Ppost below the dashed line is statistically significant (Methods). Green diamonds indicate clonal lineages below the dashed line with significant expansion in at least one of the individuals. Orange triangles indicate clonal lineages below the dashed line that contain reads from the plasma B cell repertoire in at least one of the individuals. (C, E) The histograms show the number of clonal lineages that share a common progenitor in a given number individuals, which have significantly expanded during infection in at least one of the individuals (C), or contained reads from the plasma B-cell repertoire in at least one of the individuals (E). (D, F) The scatter plots with transparent overlapping markers show log10 Ppost for progenitors of clonal lineages shared in a given number individuals that have expanded (D), or contain reads from the plasma B cell repertoire (E), in at least one individual. The dashed line is similar to (B).
Figure 6:
Figure 6:. Statistics of BCRs reactive to RBD and NTD epitopes.
(A) The relative counts for IGHV-gene usage is shown for known mAbs (Table S8) reactive to RBD (pink) and NTD (green) epitopes of SARS-CoV-2 and for receptors obtained from single cell sequencing of the pooled sample from all patients (Methods), sorted for RBD (yellow) and NTD (blue) epitopes. (B) The histogram shows the number of NTD-sorted receptors from single cell sequencing (Table S6) and RBD- and NTD-specific verified mAbs (Table S7) found in the bulk+plasma B-cell repertoires of a given number of individuals (Methods), indicated on the horizontal axis. (C) The distribution of the log-probability to observe a sequence σ in the periphery log10 Ppost(σ) is shown as a normalized probability density function (PDF) for inferred naïve progenitors of known RBD- and NTD-sorted receptors from single cell sequencing. Ppost(σ) values were evaluated based on the repertoire model created from patients with moderate symptoms. The corresponding log10 Ppost distribution for bulk repertoires of the moderate cohort (similar to Fig. 3A) is shown in black as a reference. (D) Similar to (C) but restricted to receptors that are found in the bulk+ plasma B-cell repertoire of at least one patient in the cohort (Tables S6, S7). Colors are consistent between panels and the number of samples used to evaluate the statistics in each panel is indicated in the legend.

References

    1. Almagro J.C., Raghunathan G., Beil E., Janecki D.J., Chen Q., Dinh T., LaCombe A., Connor J., Ware M., Kim P.H., et al. (2012). Characterization of a high-affinity human antibody with a disulfide bridge in the third complementarity-determining region of the heavy chain. J Mol Recognit 25, 125–135. - PubMed
    1. Barnes C.O., West A.P., Huey-Tubman K.E., Hoffmann M.A.G., Sharaf N.G., Hoffman P.R., Koranda N., Gristick H.B., Gaebler C., Muecksch F., et al. (2020). Structures of human antibodies bound to SARS-CoV-2 spike reveal common epitopes and recurrent features of antibodies. Cell 182, 828–842.e16. - PMC - PubMed
    1. Boyd S.D., Marshall E.L., Merker J.D., Maniar J.M., Zhang L.N., Sahaf B., Jones C.D., Simen B.B., Hanczaruk B., Nguyen K.D., et al. (2009). Measurement and clinical monitoring of human lymphocyte clonality by massively parallel VDJ pyrosequencing. Sci Transl Med 1, 12ra23. - PMC - PubMed
    1. Briney B., and Burton D.R. (2018). Massively scalable genetic analysis of antibody repertoires. BioRxiv 10.1101/447813. - DOI
    1. Briney B., Inderbitzin A., Joyce C., and Burton D.R. (2019). Commonality despite exceptional diversity in the baseline human antibody repertoire. Nature 566, 393–397. - PMC - PubMed

Publication types